Life Science Research Figures and Study Flow Diagrams
Journal figures in the life sciences follow familiar patterns: a signaling pathway, a gel and blot layout, a plate map, a participant flow diagram. This hub lists the figure templates and diagram generators on ConceptViz that cover those patterns, grouped by the part of a paper they usually appear in.
The molecular and cell groups suit introductions and mechanism figures. Lab technique diagrams explain methods. Study design and reporting diagrams such as STROBE, CONSORT, PRISMA and swimmer plots match what reviewers expect to see in results and supplements.
The final group helps with the look of the figure itself: colorblind-friendly palettes and layouts that stay readable in print and on a projector.
42 pages in this collection. Jump to: Molecular biology and signaling · Cells and tissues · Lab methods and assays · Genetics and ecology · Study design and reporting · Figure design and posters
Molecular biology and signaling
Pathways, gene editing and the flow of genetic information.
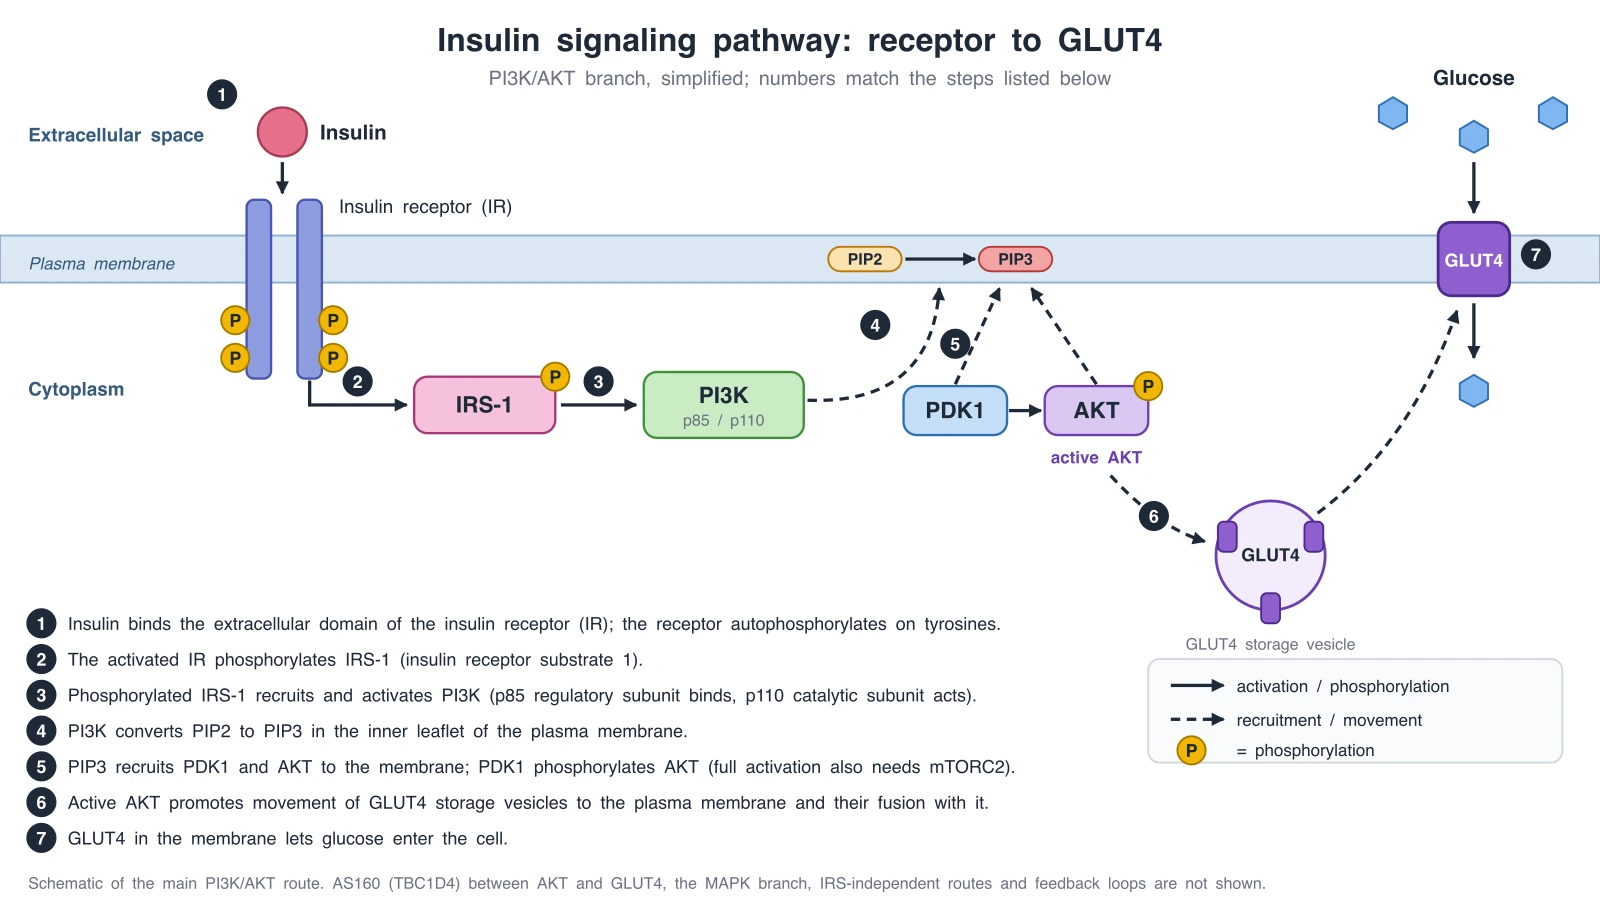 Signaling Pathway Diagram GeneratorGenerate signaling pathway diagrams: insulin to GLUT4, TGF-β/SMAD, and MAPK/ERK, with membrane and nucleus layers and exact reference diagrams.
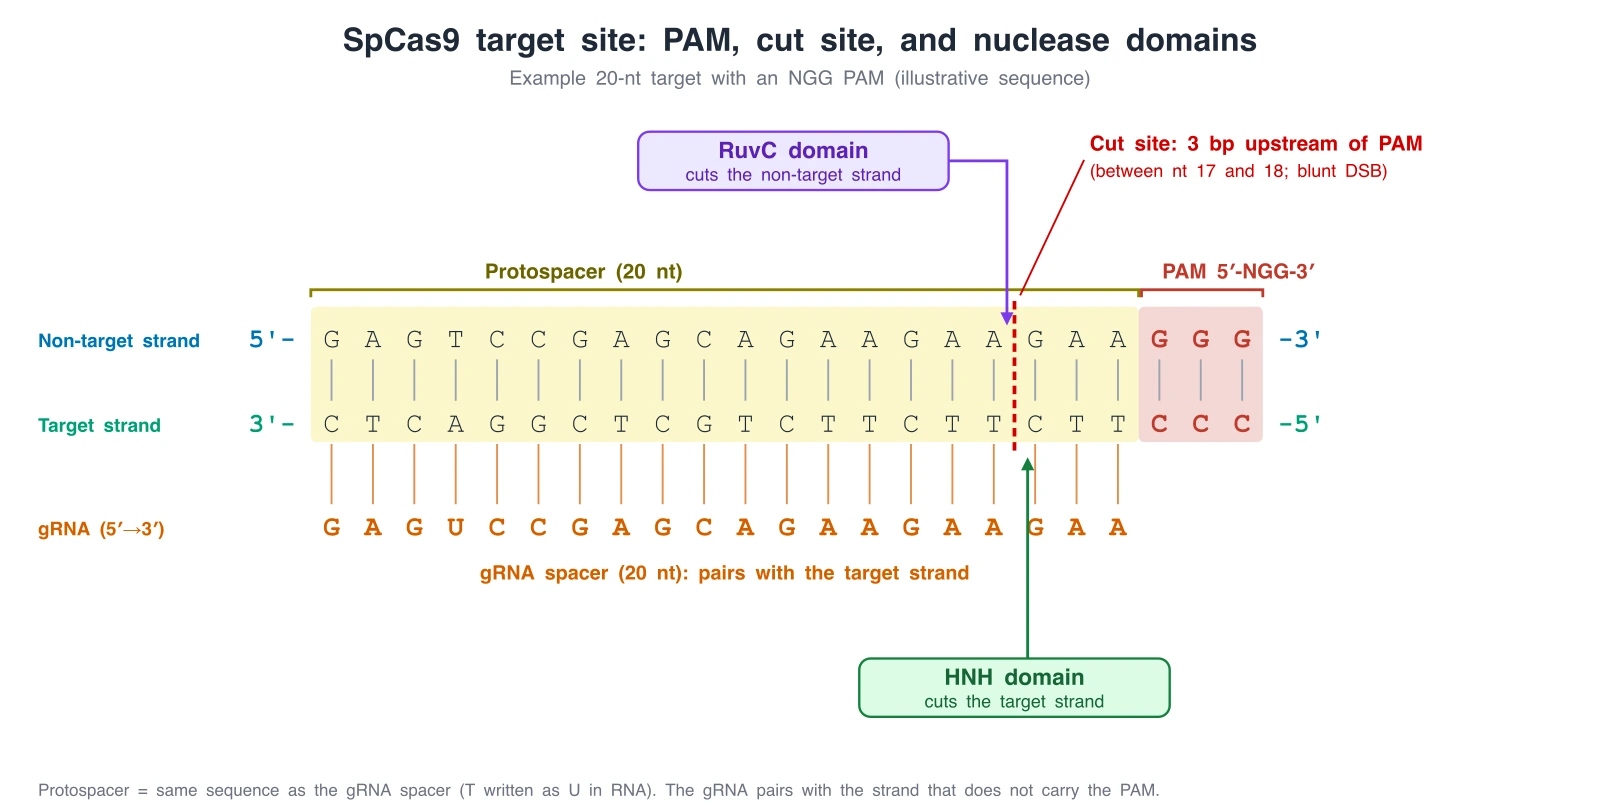 CRISPR Cas9 Diagram GeneratorGenerate CRISPR-Cas9 diagrams: guide RNA, PAM, cut site, NHEJ vs HDR repair, and knockout workflows, with exact reference diagrams.
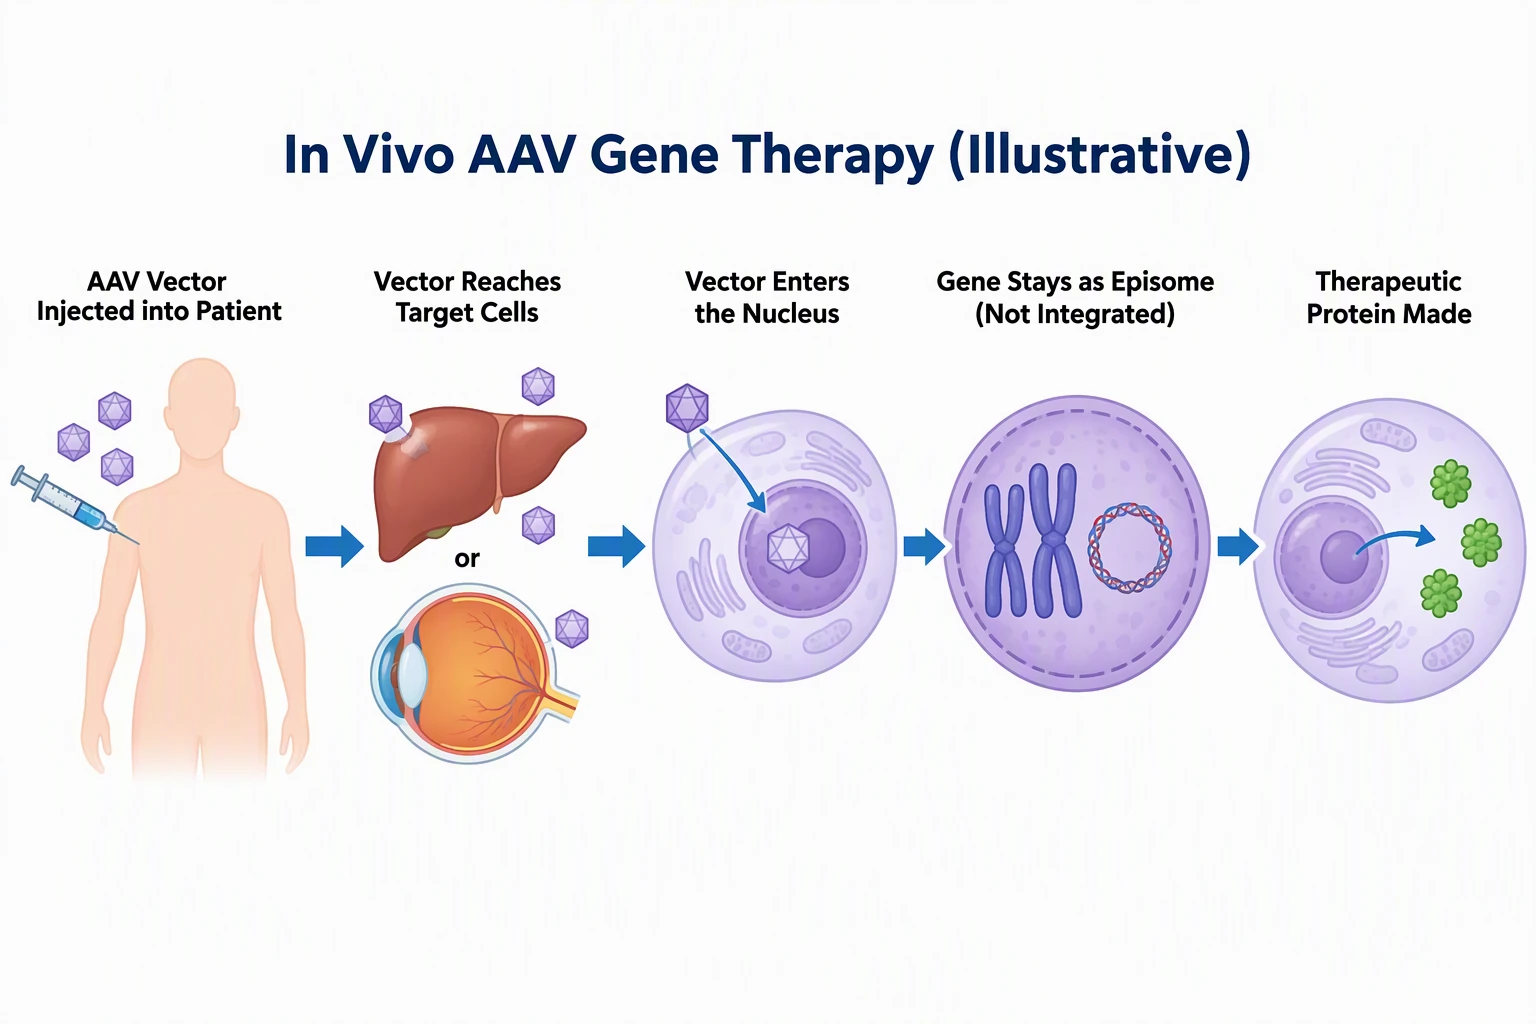 Gene Therapy Diagram GeneratorGenerate gene therapy diagrams for in vivo AAV, ex vivo lentiviral, CAR-T, and CRISPR ex vivo workflows with fixed labels.
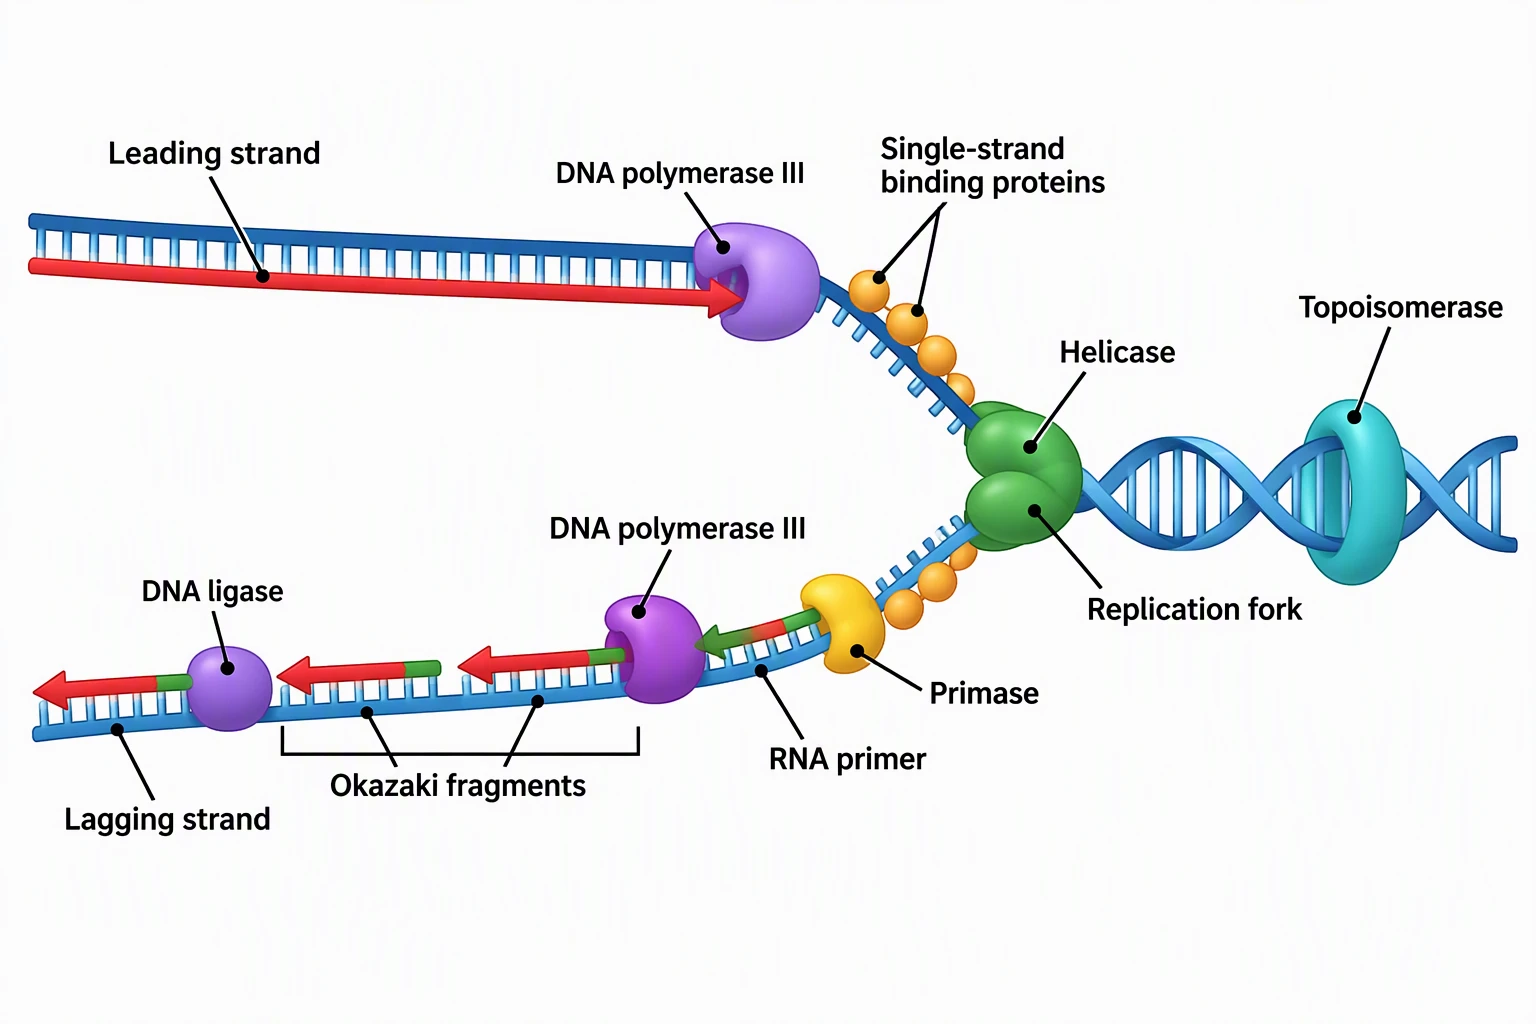 DNA Replication DiagramFree DNA replication diagrams: labeled fork, blank worksheet, simple version, and coloring pages.
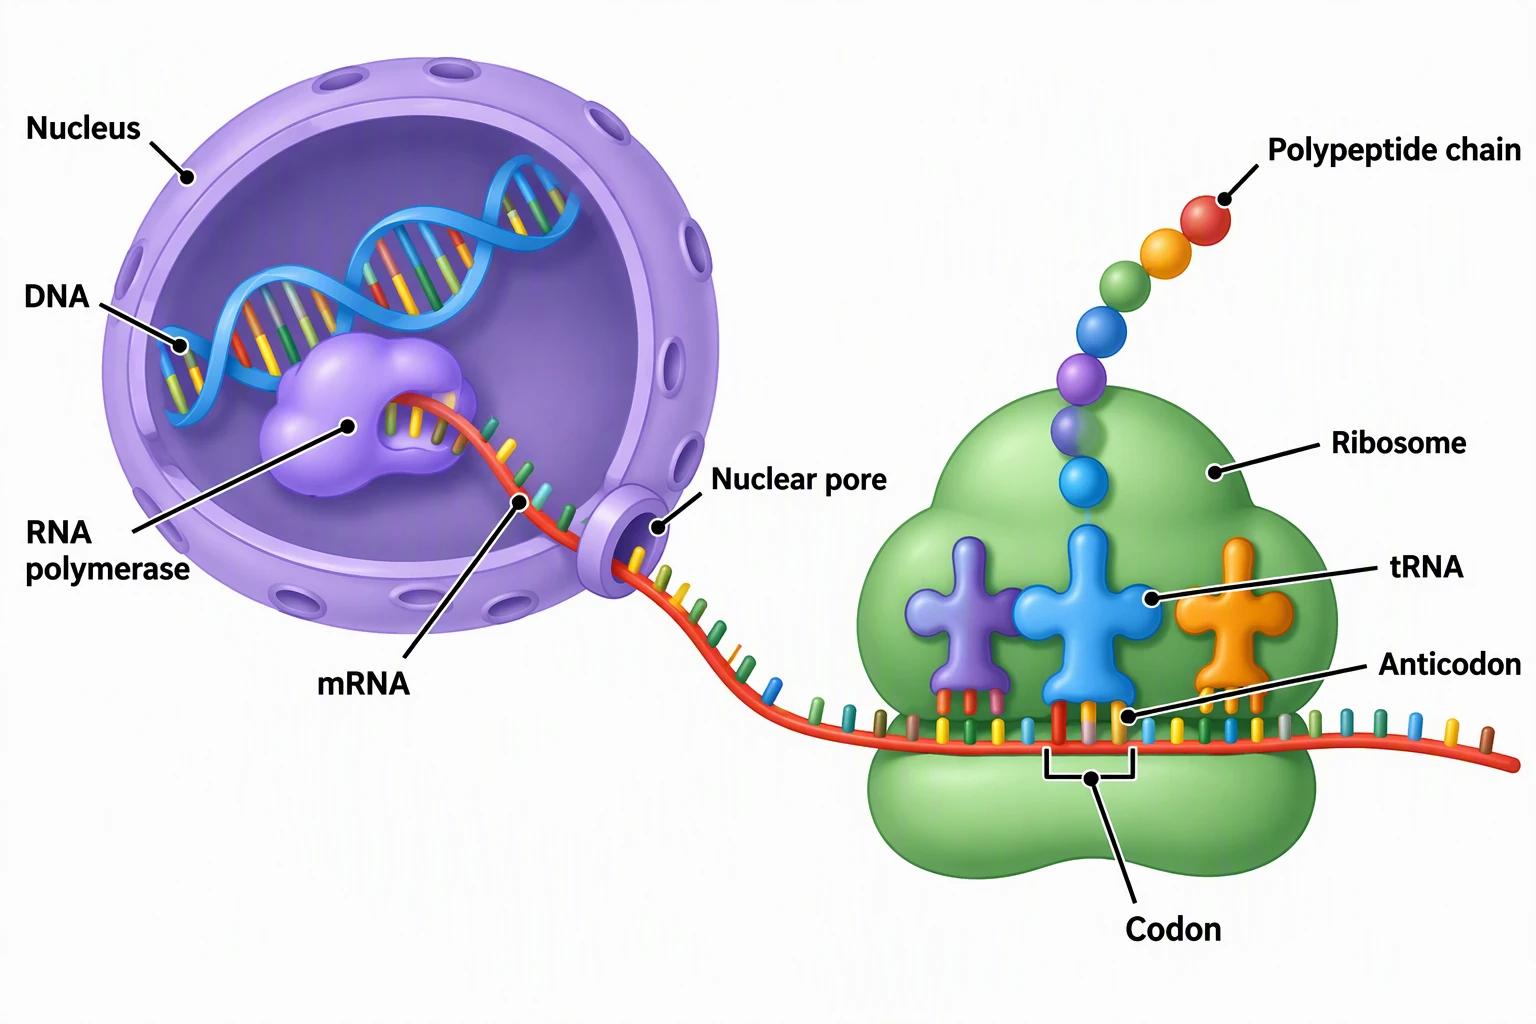 Protein Synthesis DiagramFree protein synthesis diagrams: labeled transcription and translation, blank worksheet, and coloring pages.
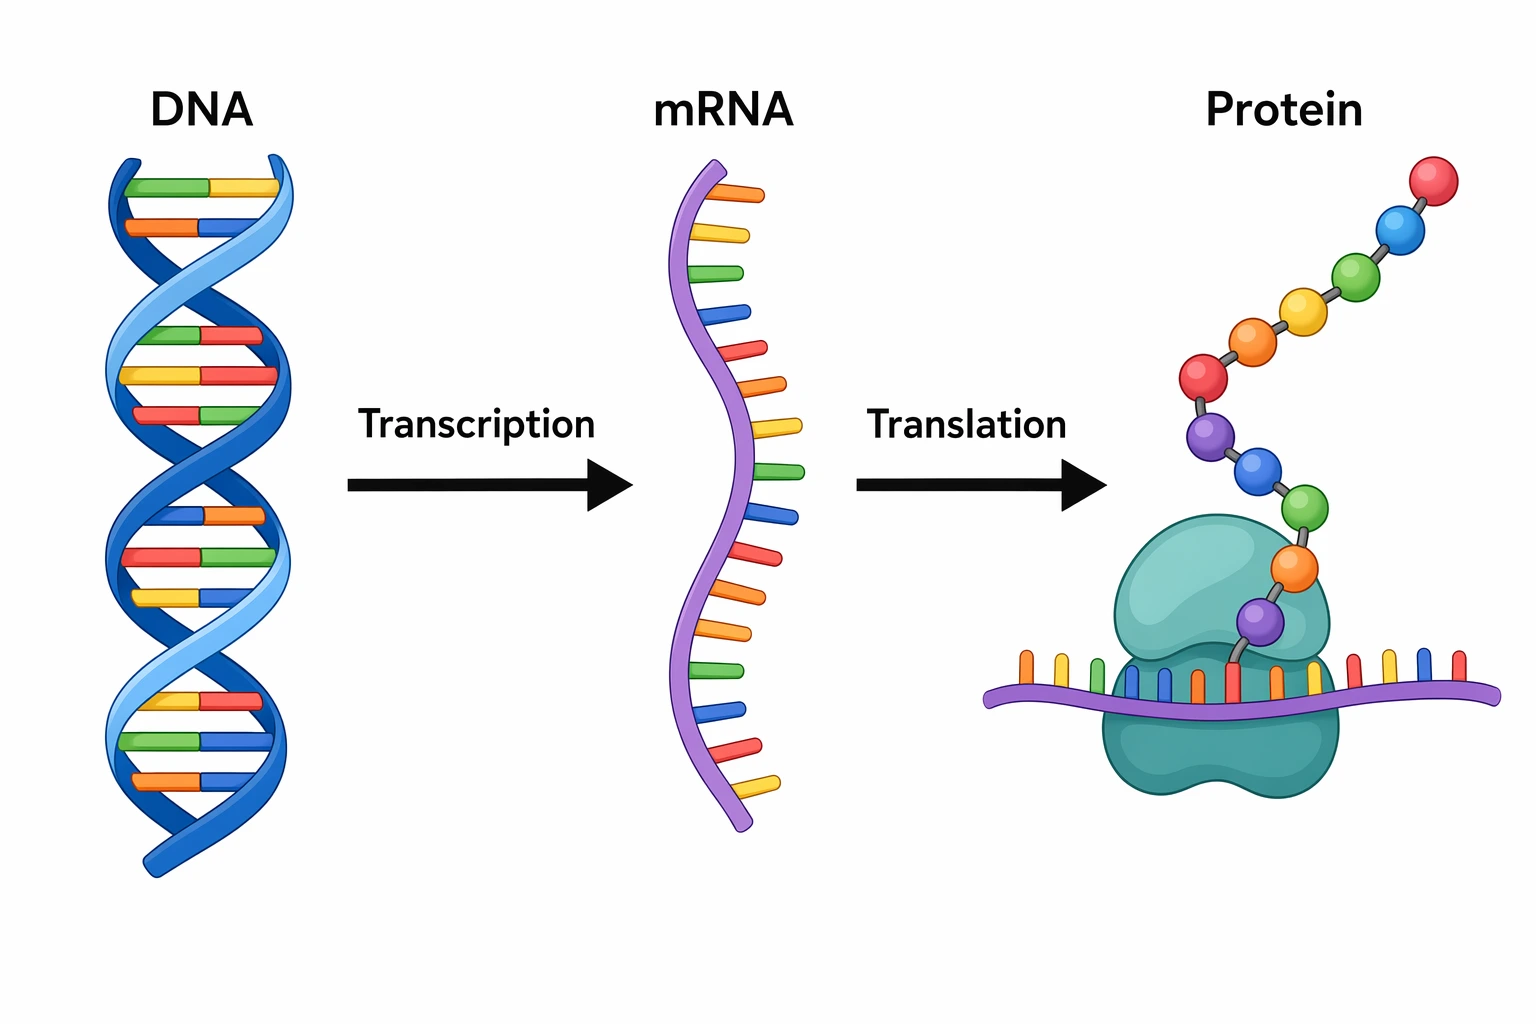 Transcription and Translation Diagram GeneratorMake a protein synthesis diagram: type a DNA sequence and get the mRNA, codons, and amino acids as a labeled transcription-and-translation (central dogma) diagram, with free SVG/PNG export or AI illustrations.
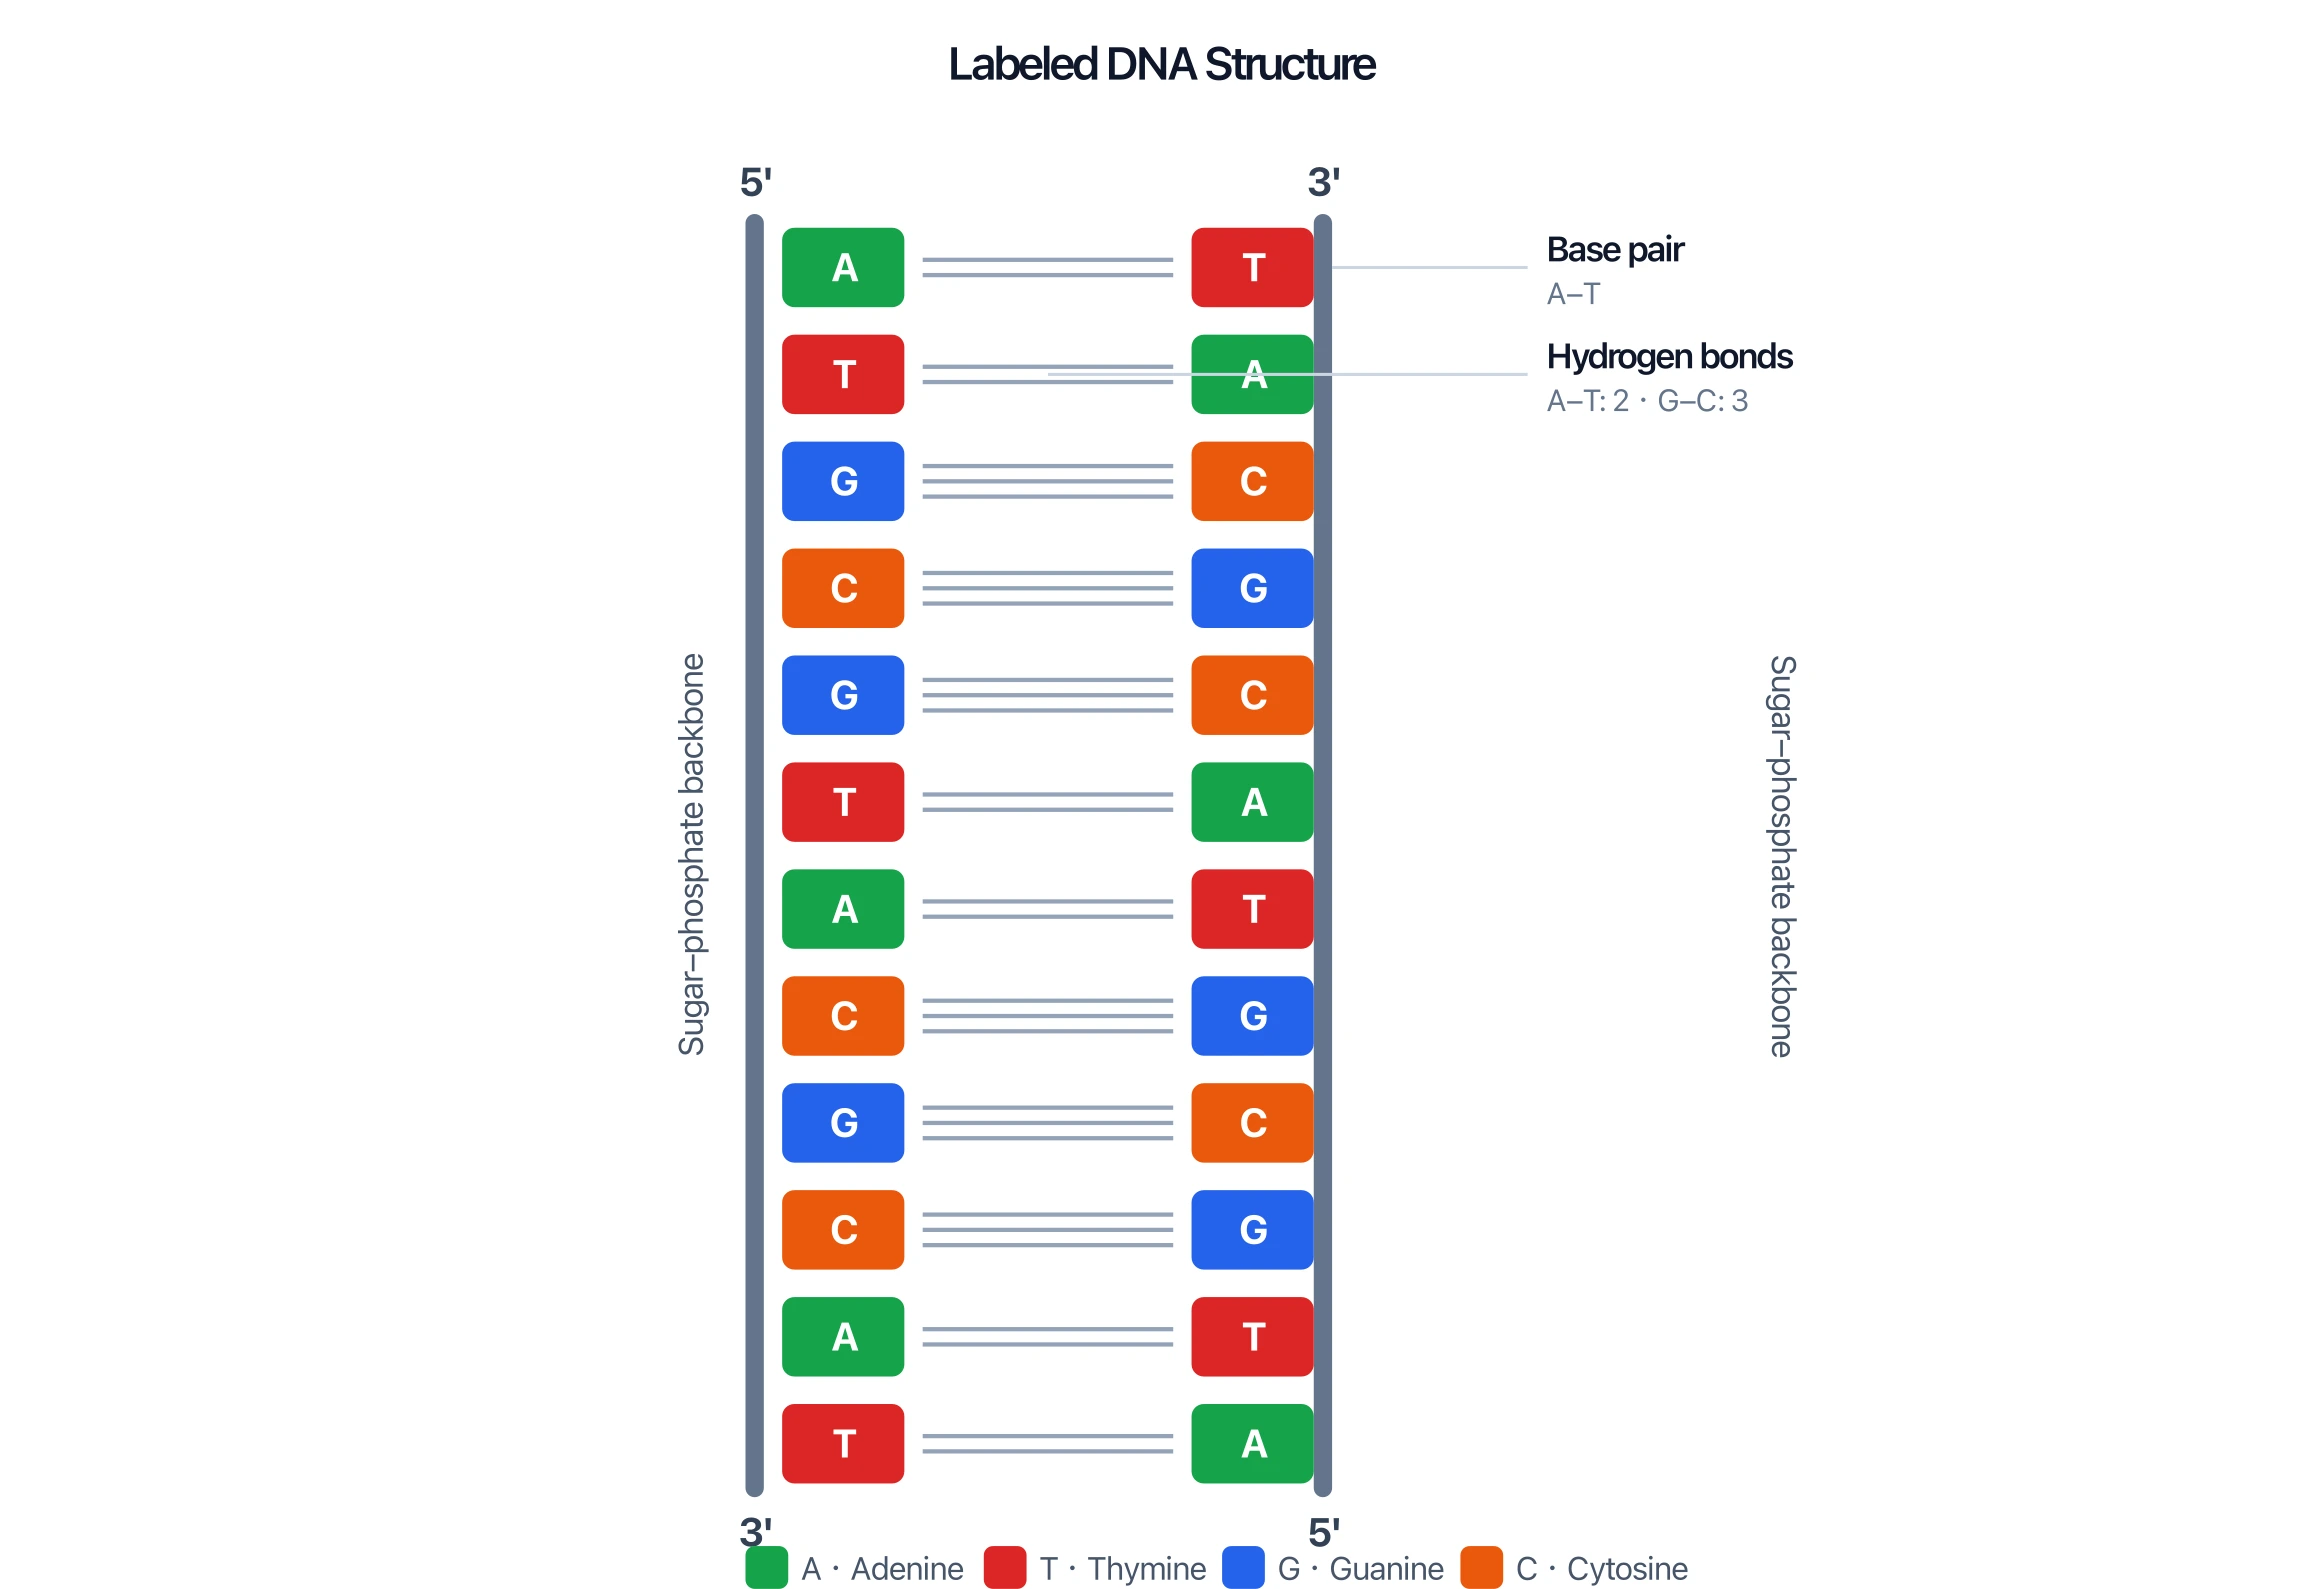 DNA Structure Diagram GeneratorMake a labeled DNA double-helix diagram with the sugar–phosphate backbone, base pairs (A–T, G–C), hydrogen bonds, and antiparallel 5′ and 3′ ends.
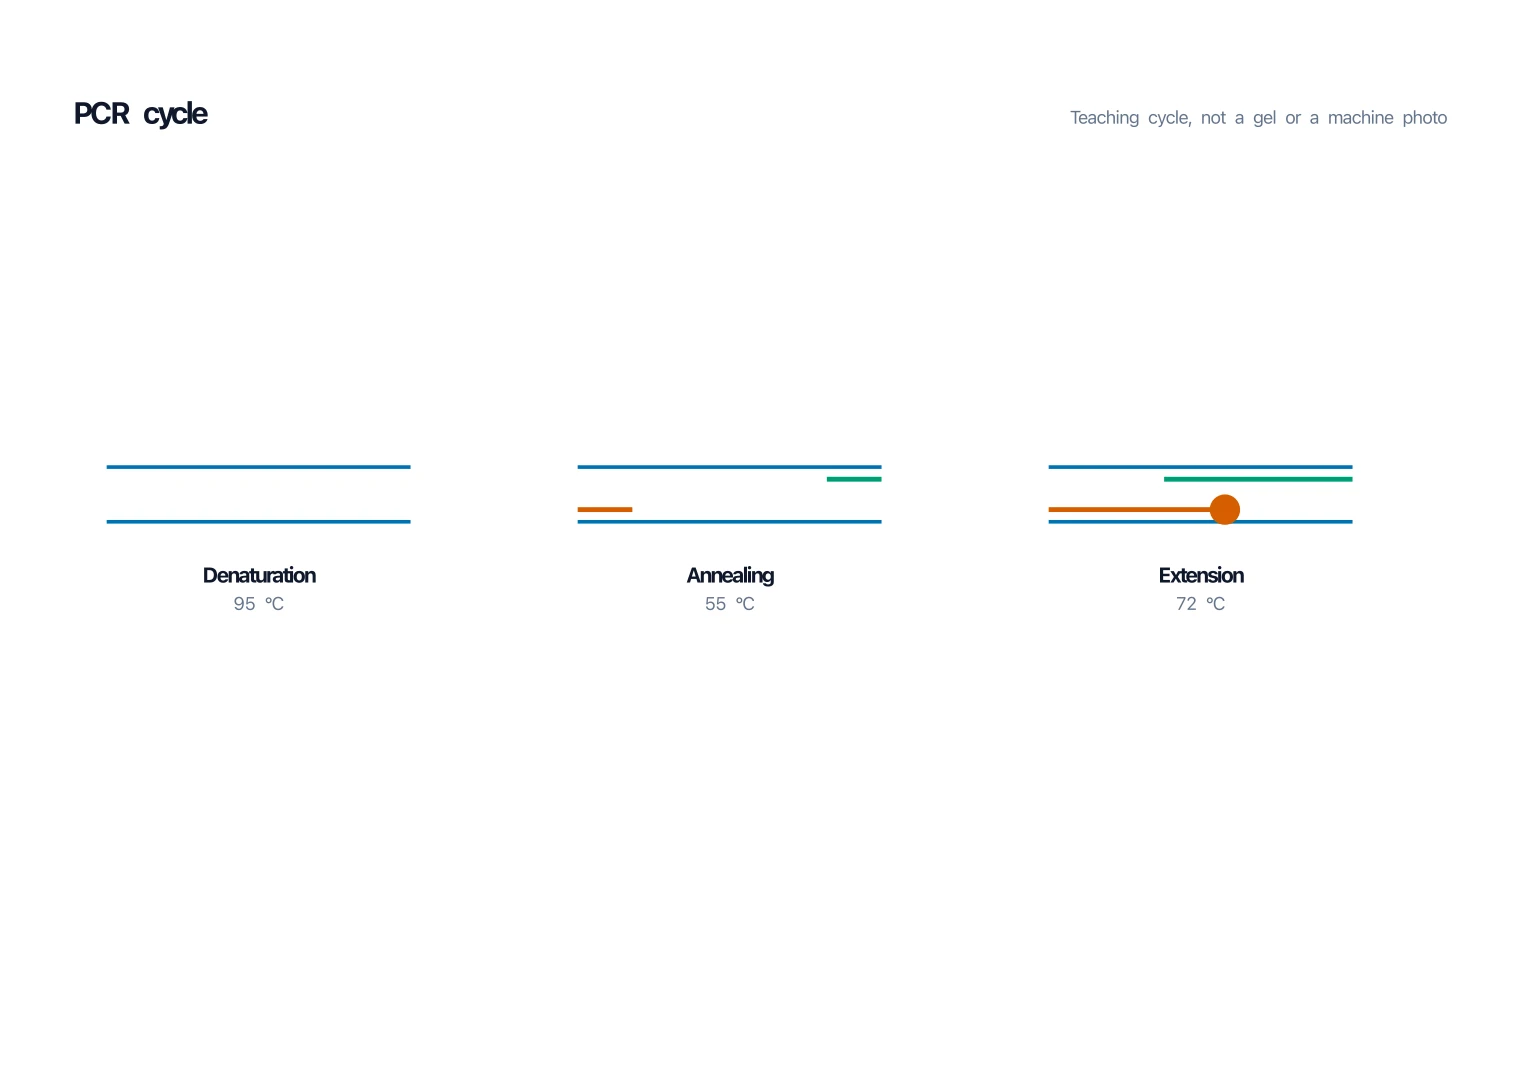 PCR Diagram GeneratorGenerate a labeled PCR cycle — denature, anneal, and extend on DNA strands, not a gel.
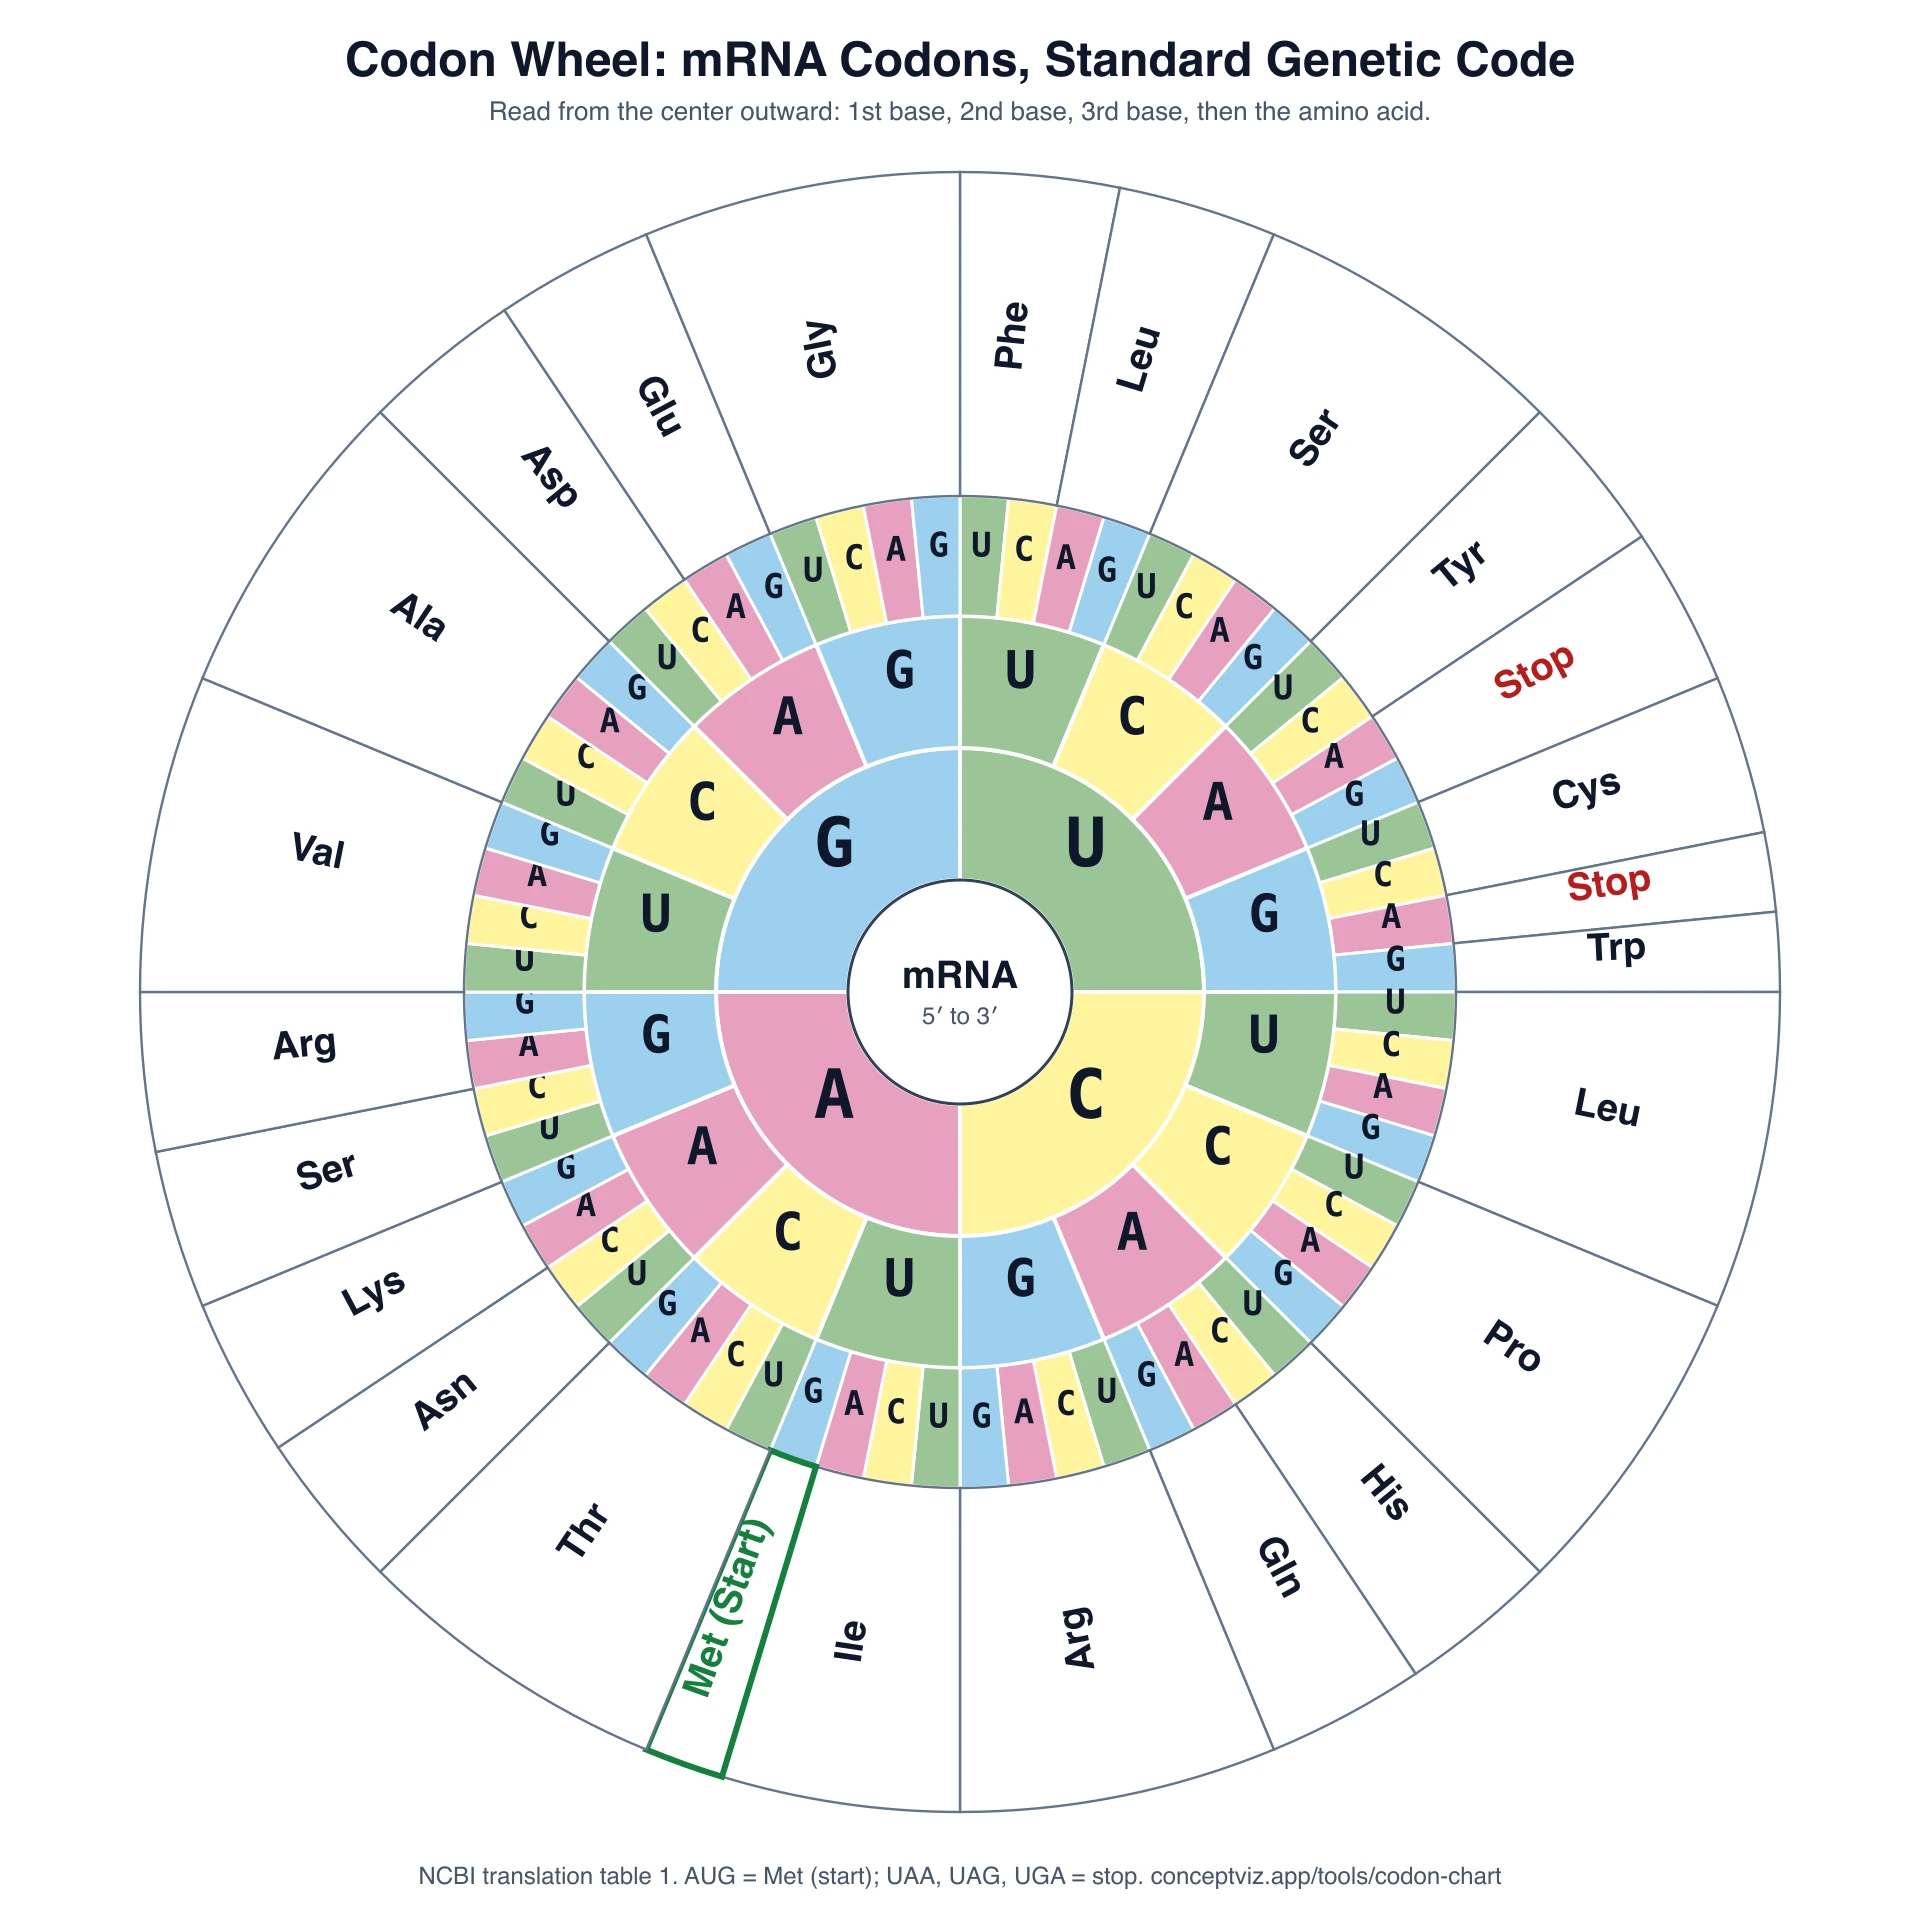 Codon ChartFree codon chart: mRNA and DNA codon table, codon wheel, one-codon lookup, blank practice sheet, and PNG, SVG or print export.
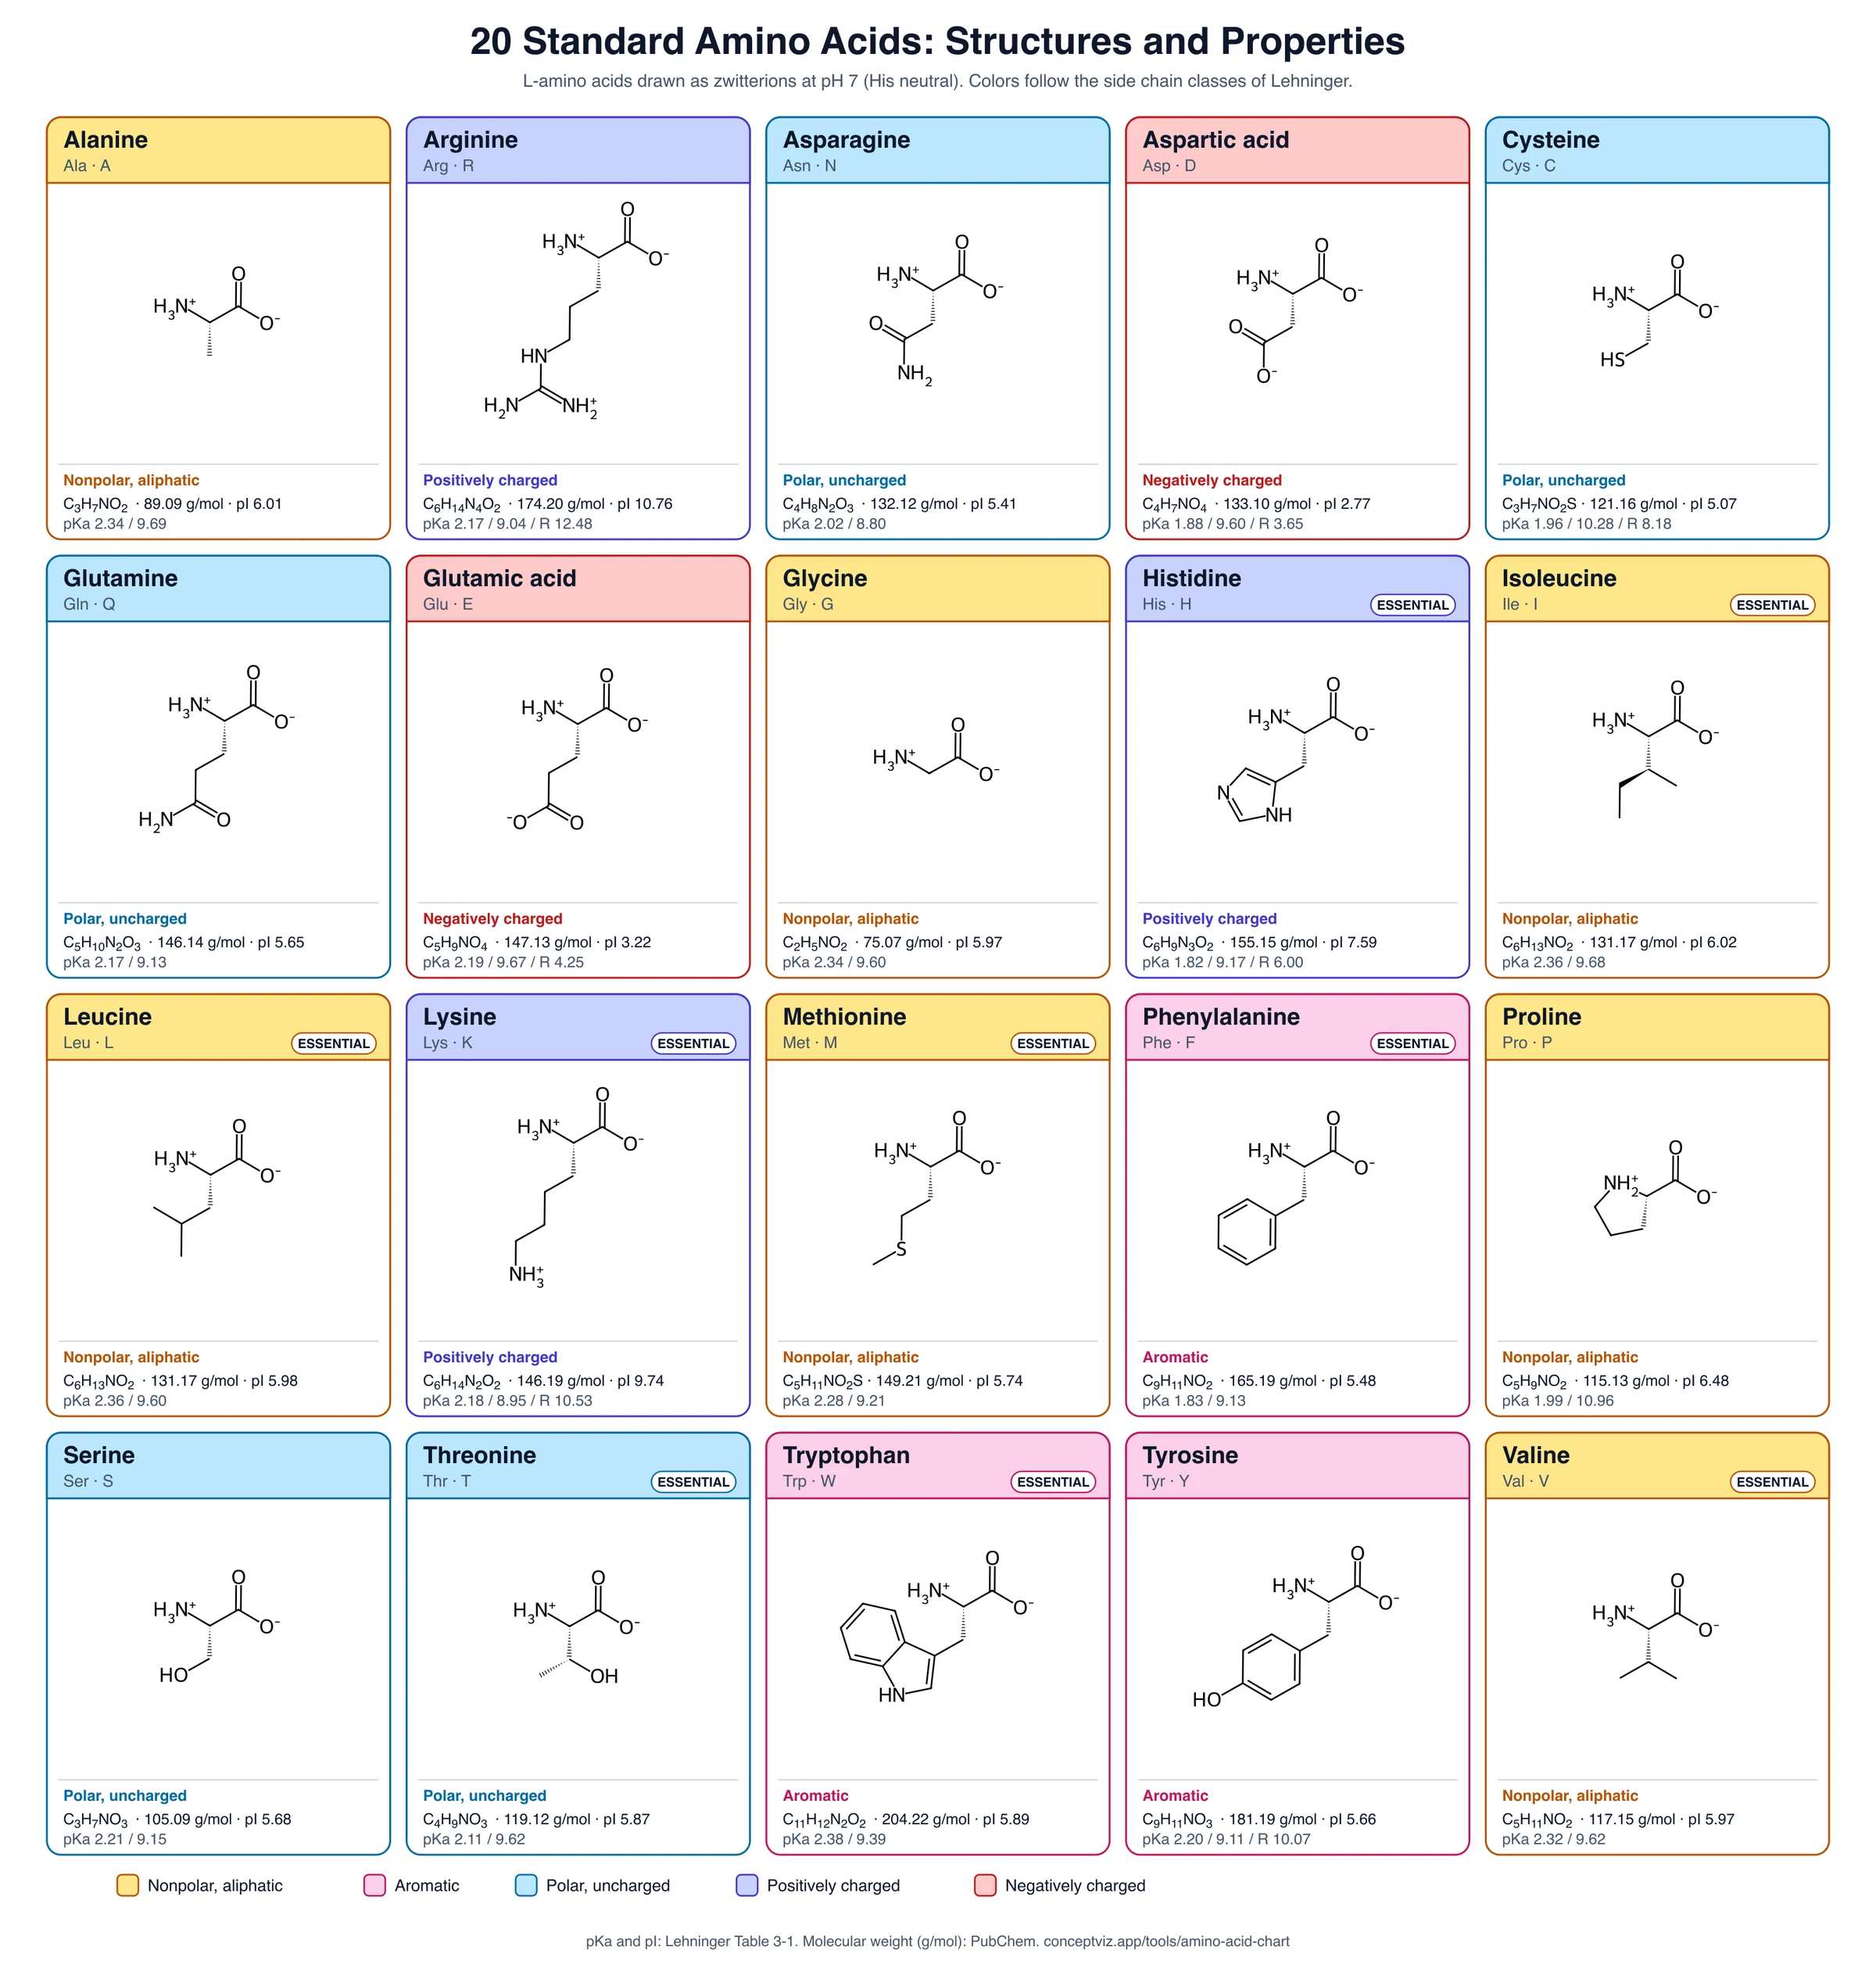 Amino Acid ChartFree amino acid chart: all 20 structures at pH 7 with names, codes, pKa, pI and essential amino acids.
Cells and tissues
Cell structure, muscle and the tumor environment.
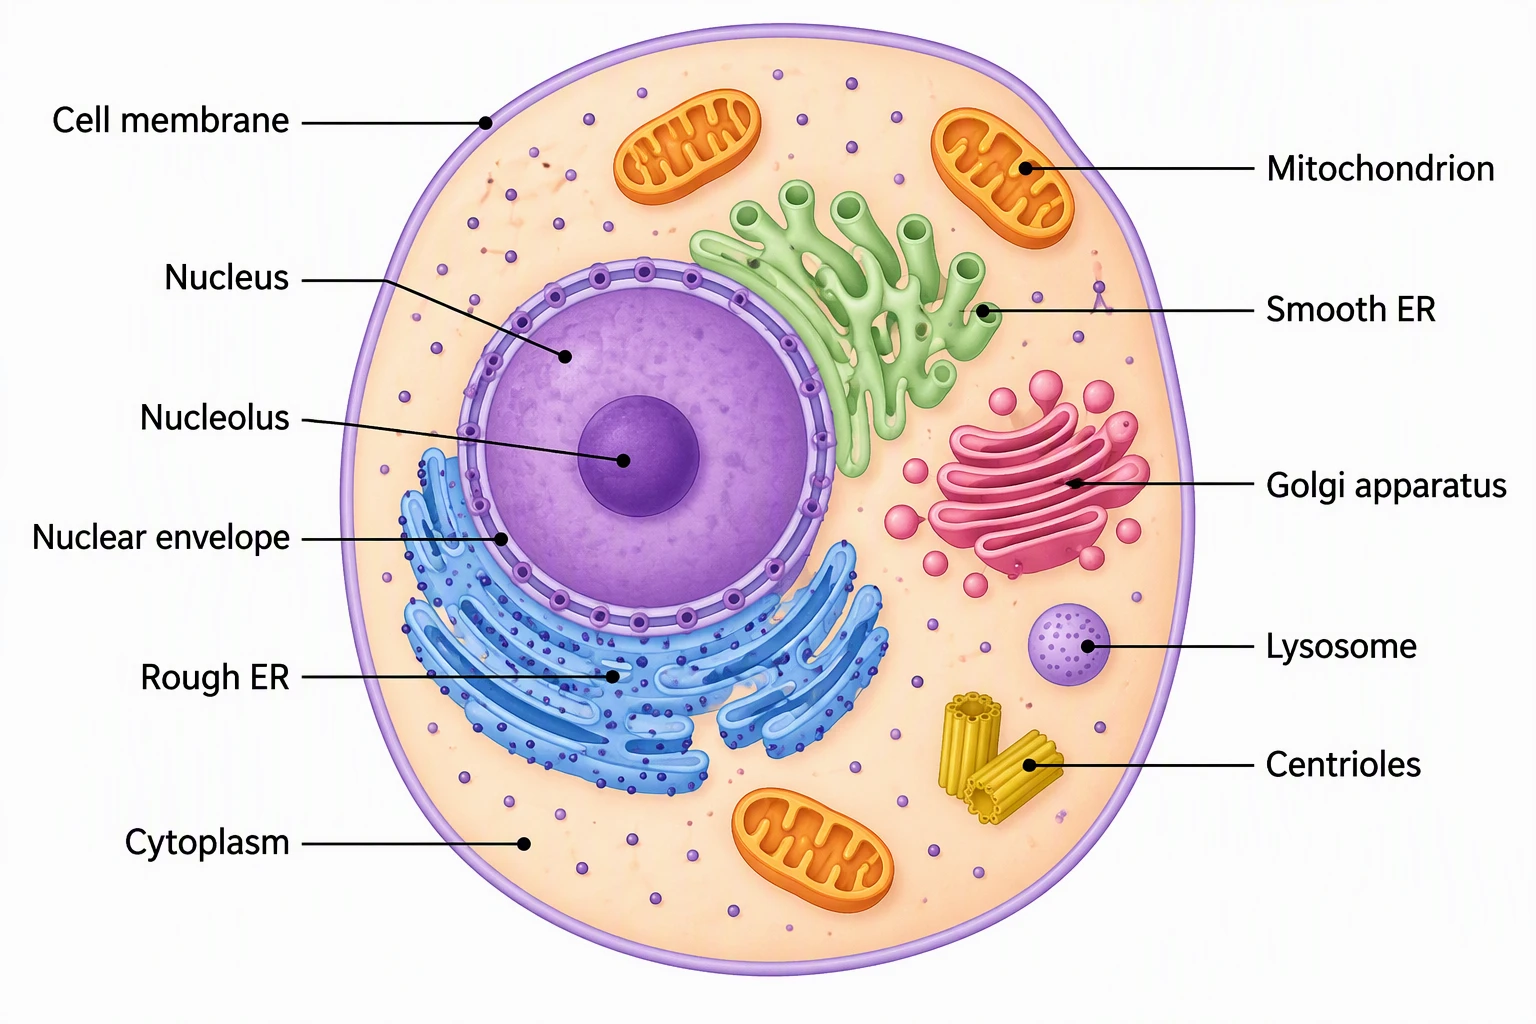 Eukaryotic Cell Diagram GeneratorGenerate labeled eukaryotic cell diagrams and eukaryotic vs prokaryotic cell comparisons, with the nucleus, ER, Golgi, and mitochondria.
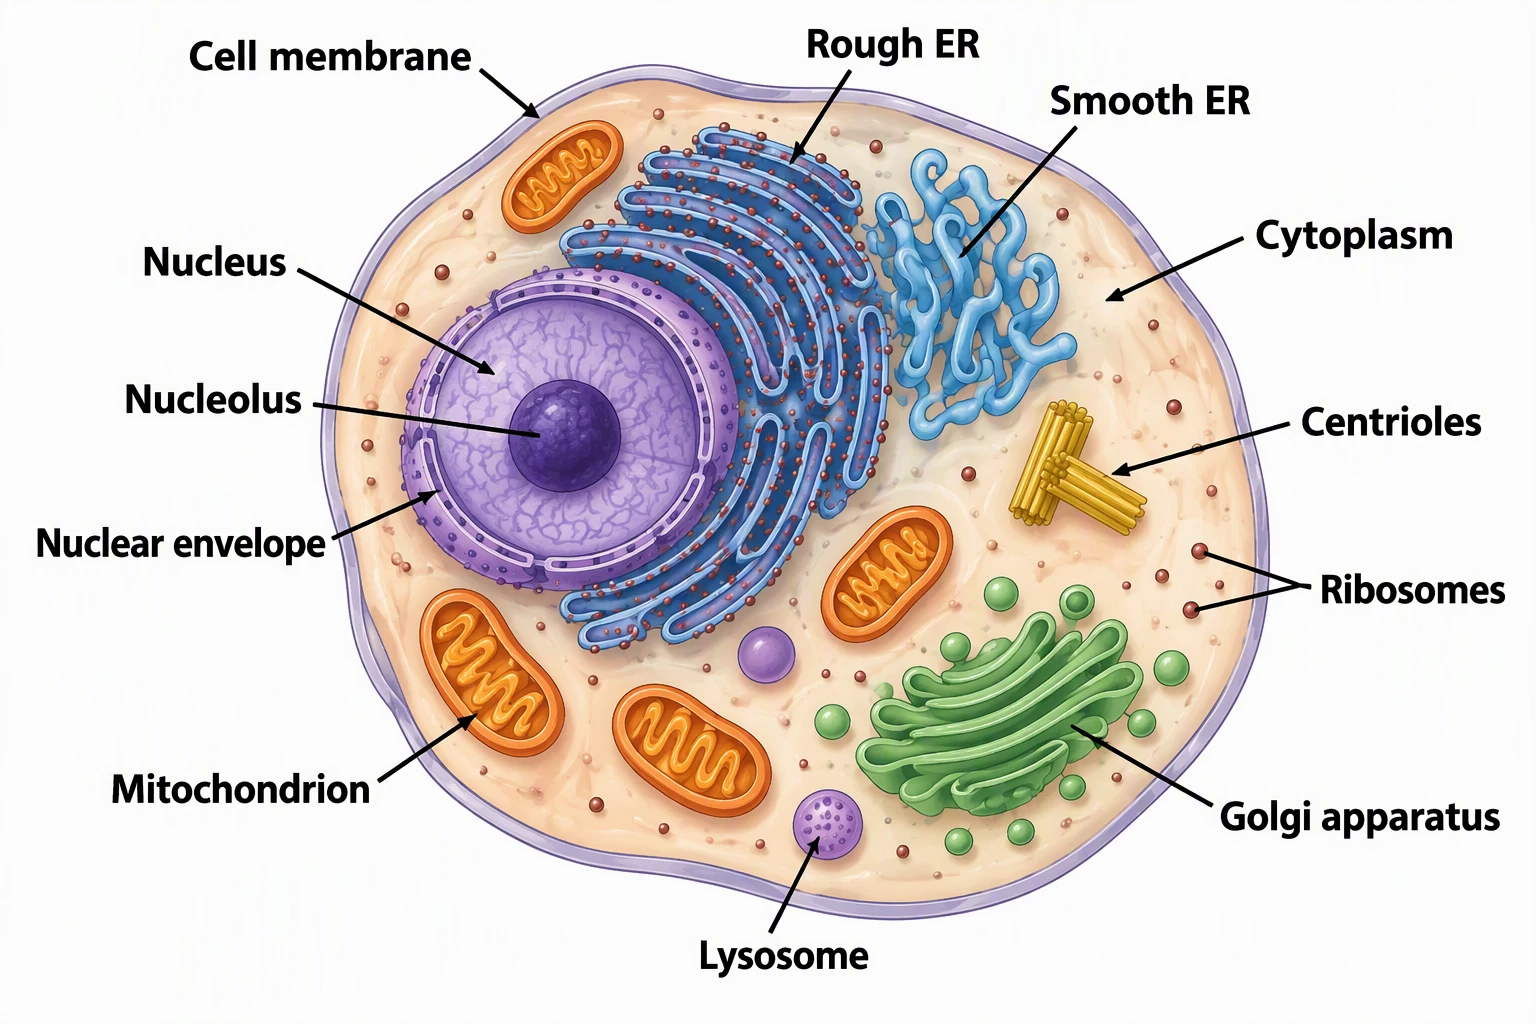 Animal Cell Diagram GeneratorCreate free printable animal cell diagrams.
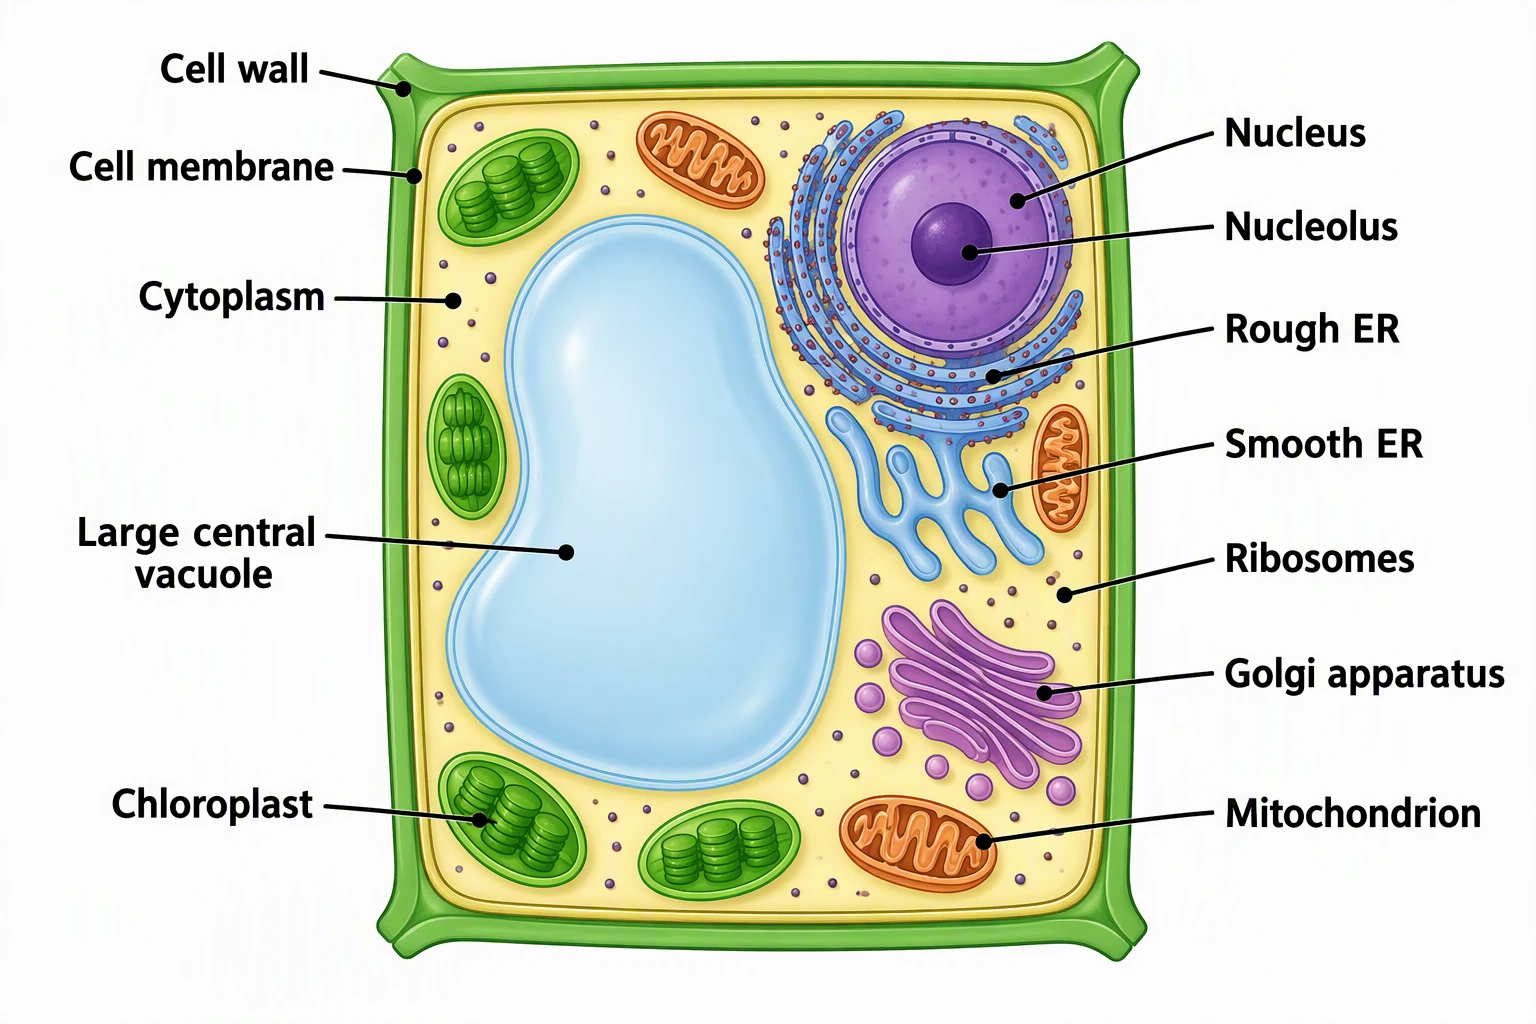 Plant Cell Diagram GeneratorGenerate printable plant cell diagrams showing cell wall, chloroplasts, and central vacuole.
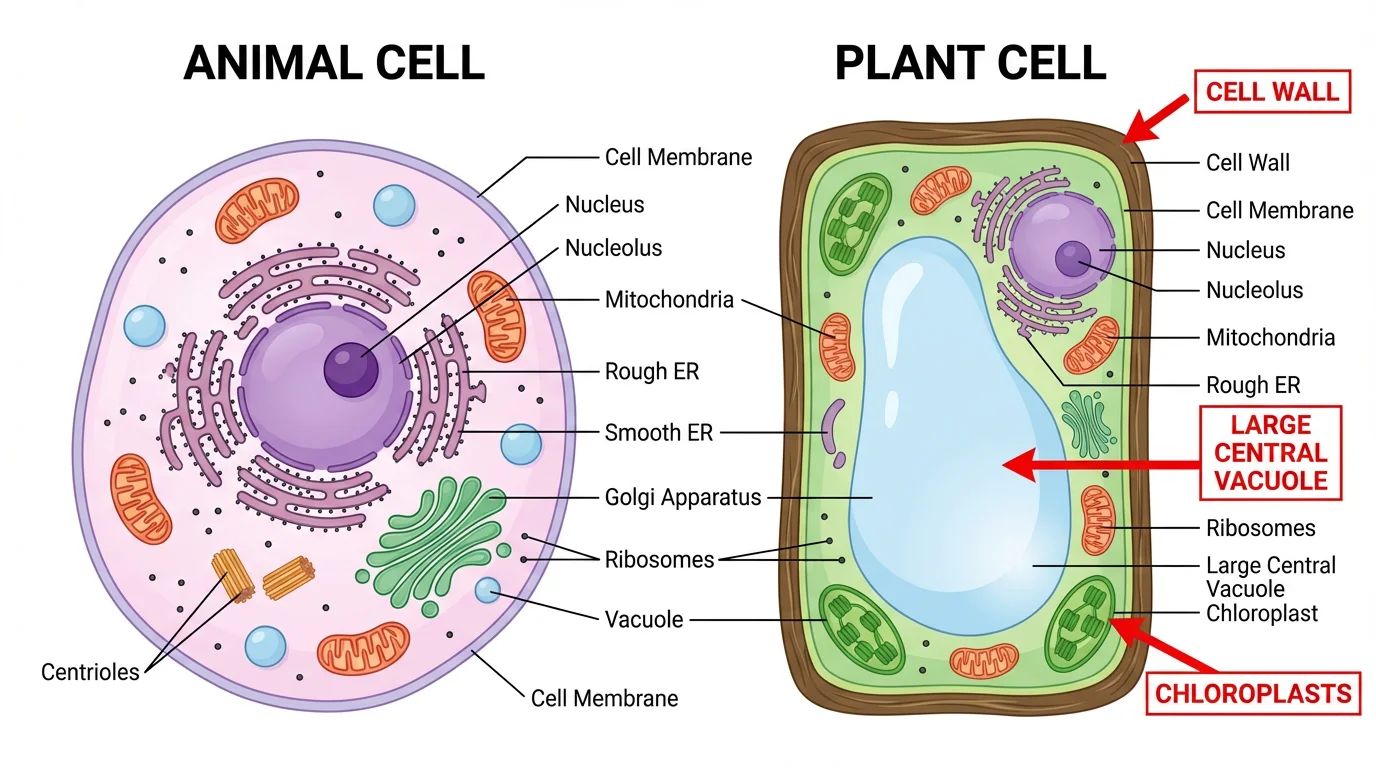 Animal vs Plant Cell ComparisonCreate side-by-side comparison worksheets showing key differences between animal and plant cells for biology class.
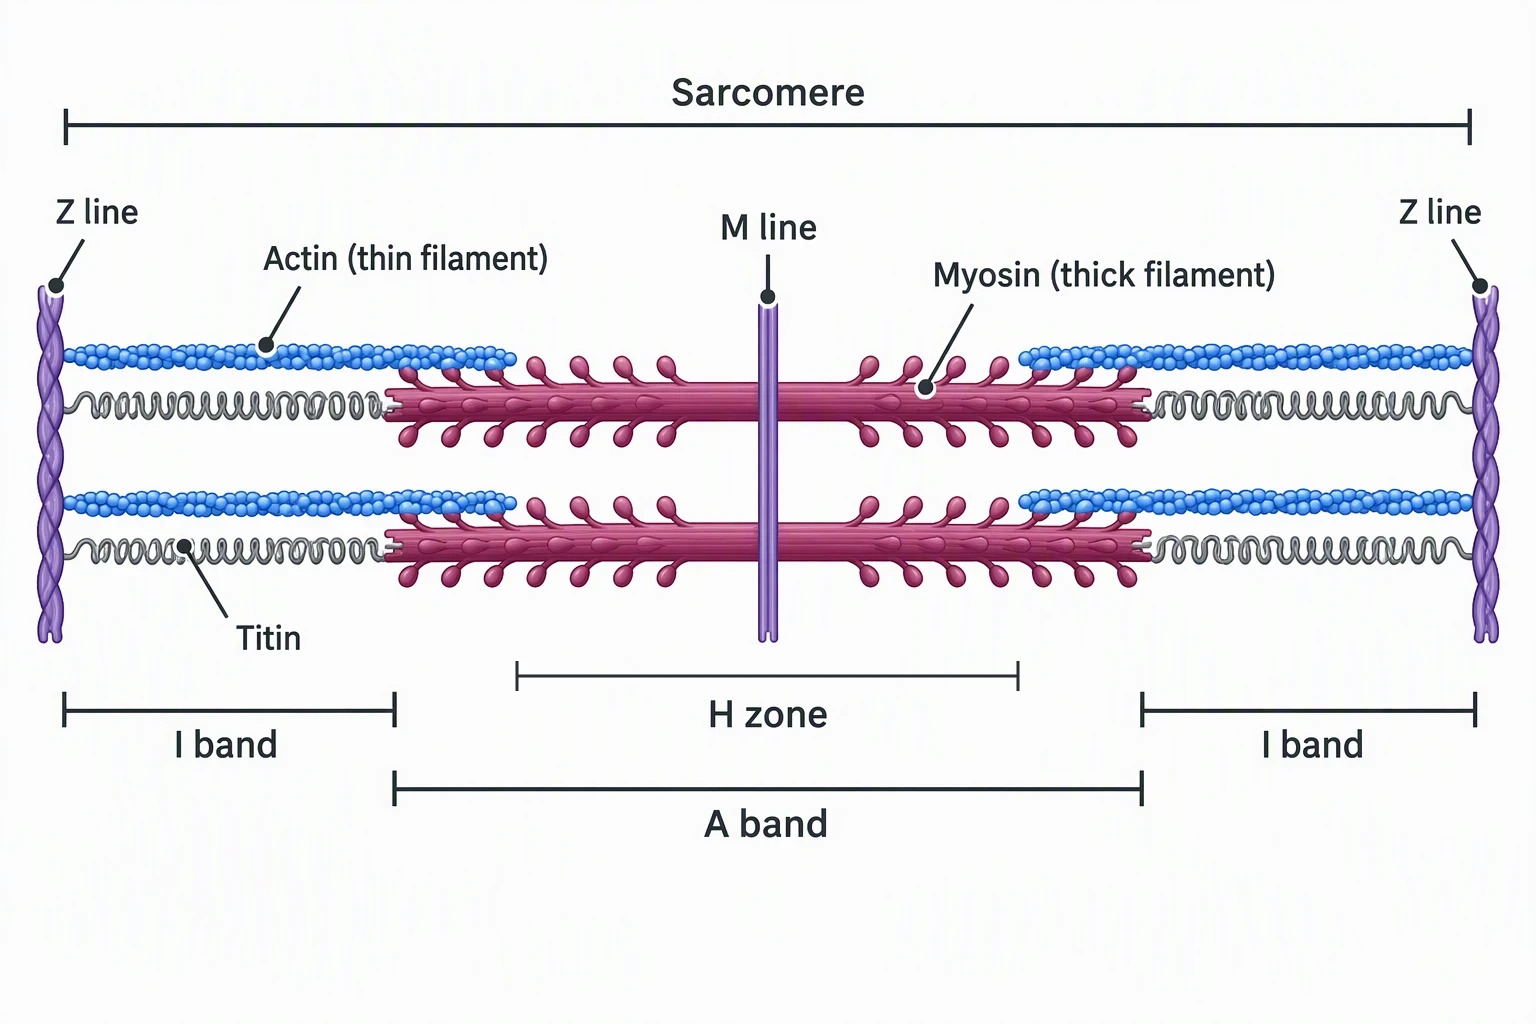 Sarcomere DiagramFree sarcomere diagrams: labeled Z line, A band, I band, contraction, blank worksheet, and coloring pages.
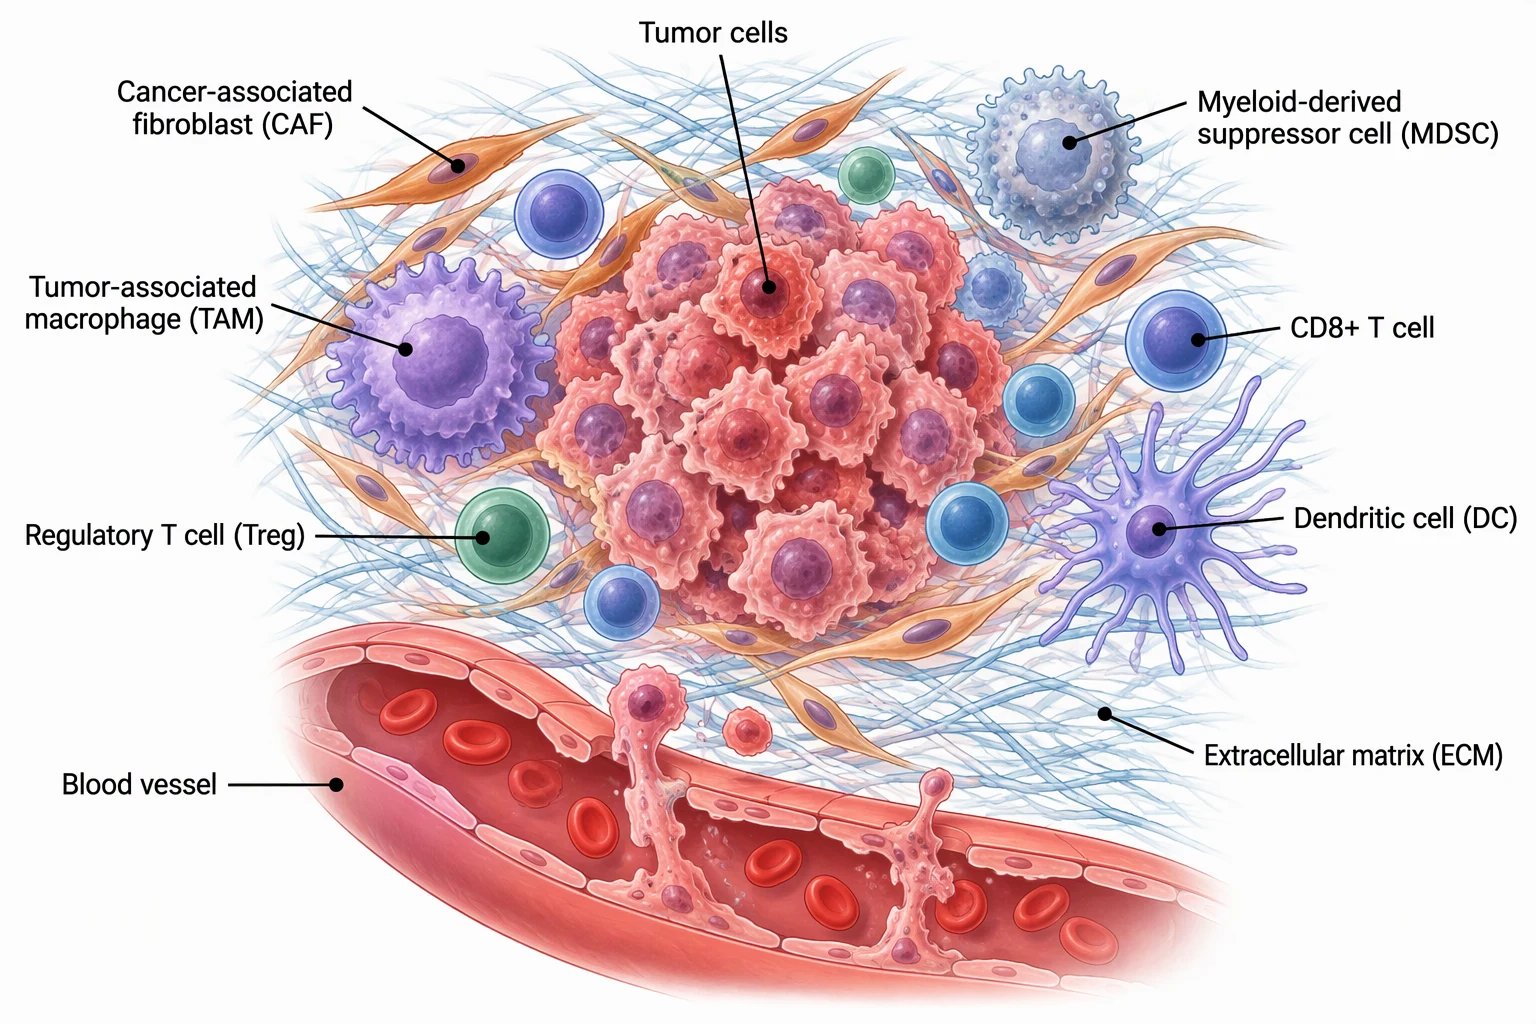 Tumor Microenvironment DiagramFree tumor microenvironment diagrams: labeled cells and stroma, blank worksheet, and hot vs cold tumors.
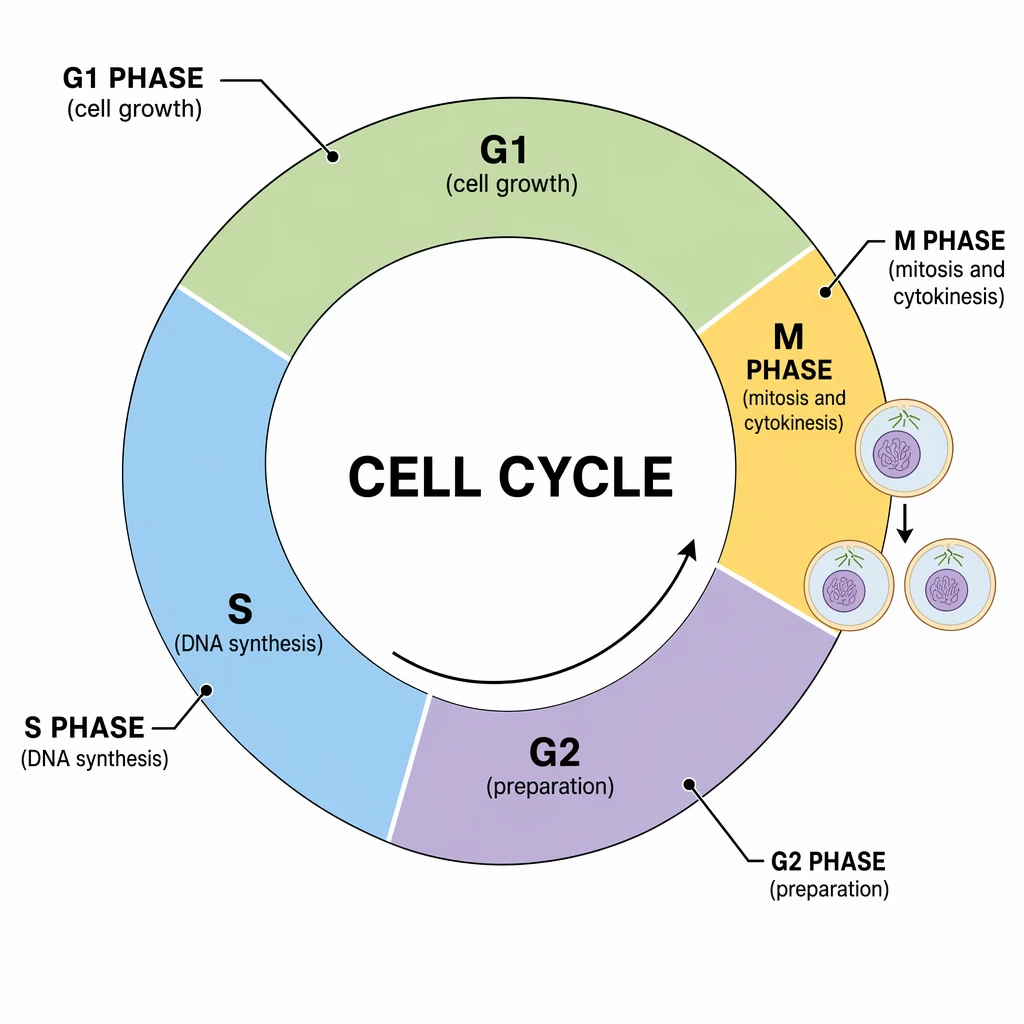 Cell Cycle Diagram GeneratorGenerate labeled cell cycle diagrams showing interphase (G1, S, G2), the M phase, and checkpoints — labeled or blank for biology worksheets and quizzes.
Lab methods and assays
Diagrams and layouts for common techniques.
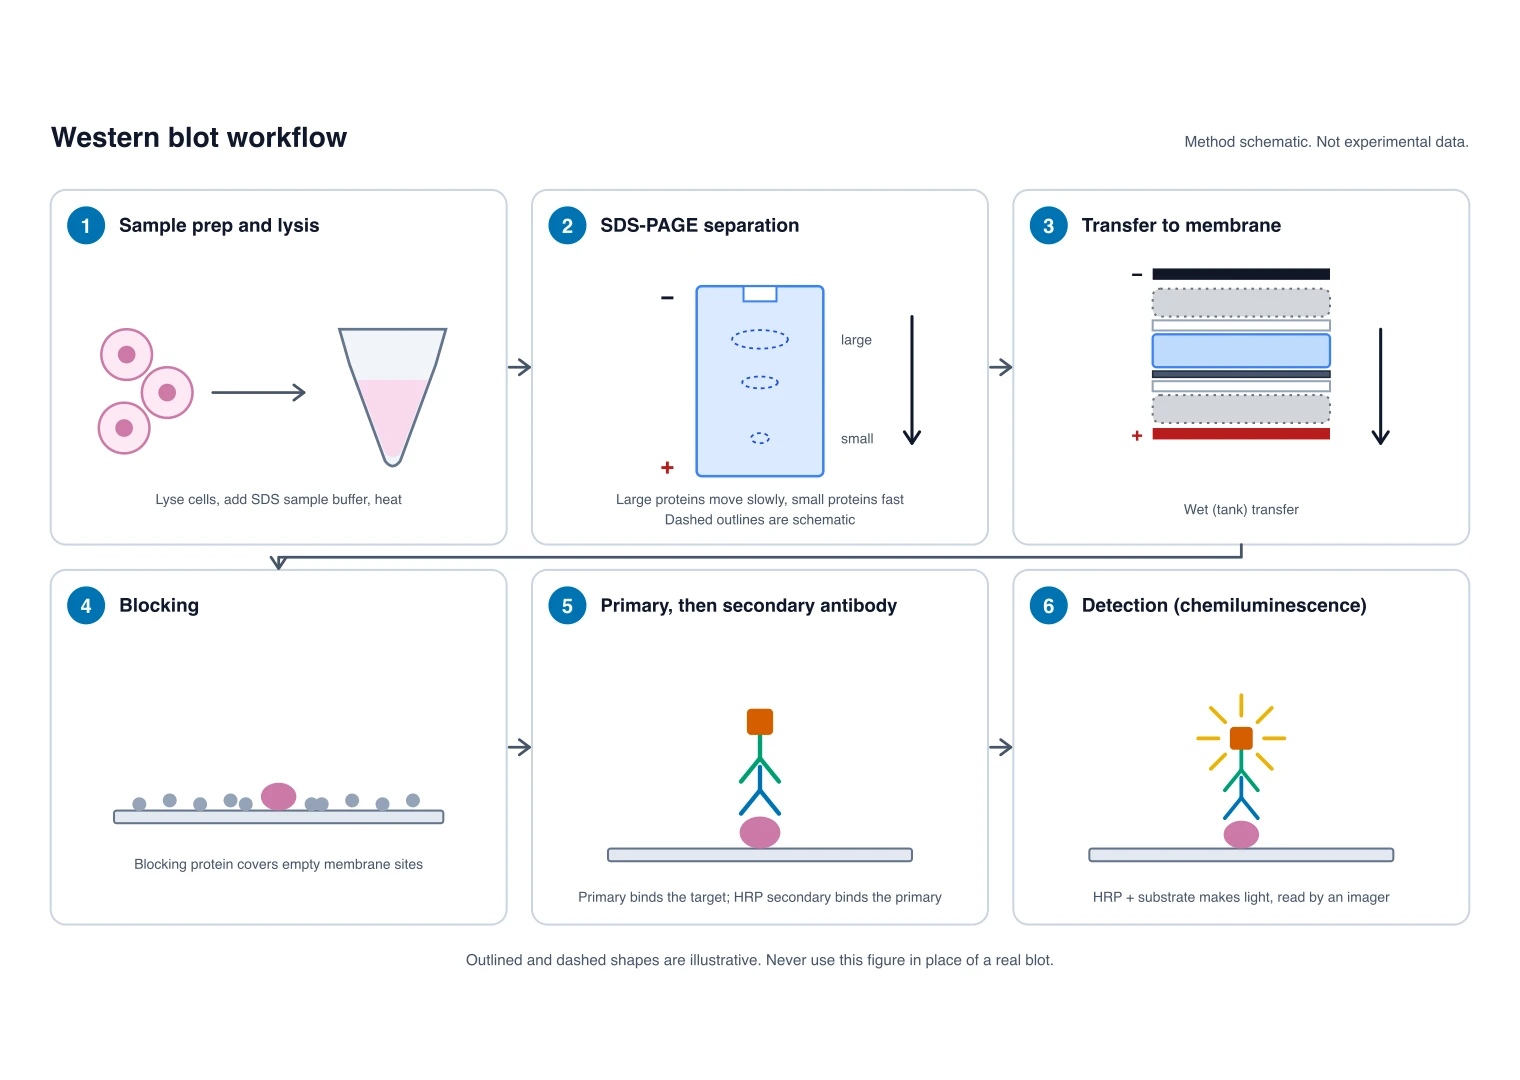 Western Blot Diagram GeneratorGenerate a western blot workflow, transfer sandwich, or antibody detection schematic as a method figure, not blot data.
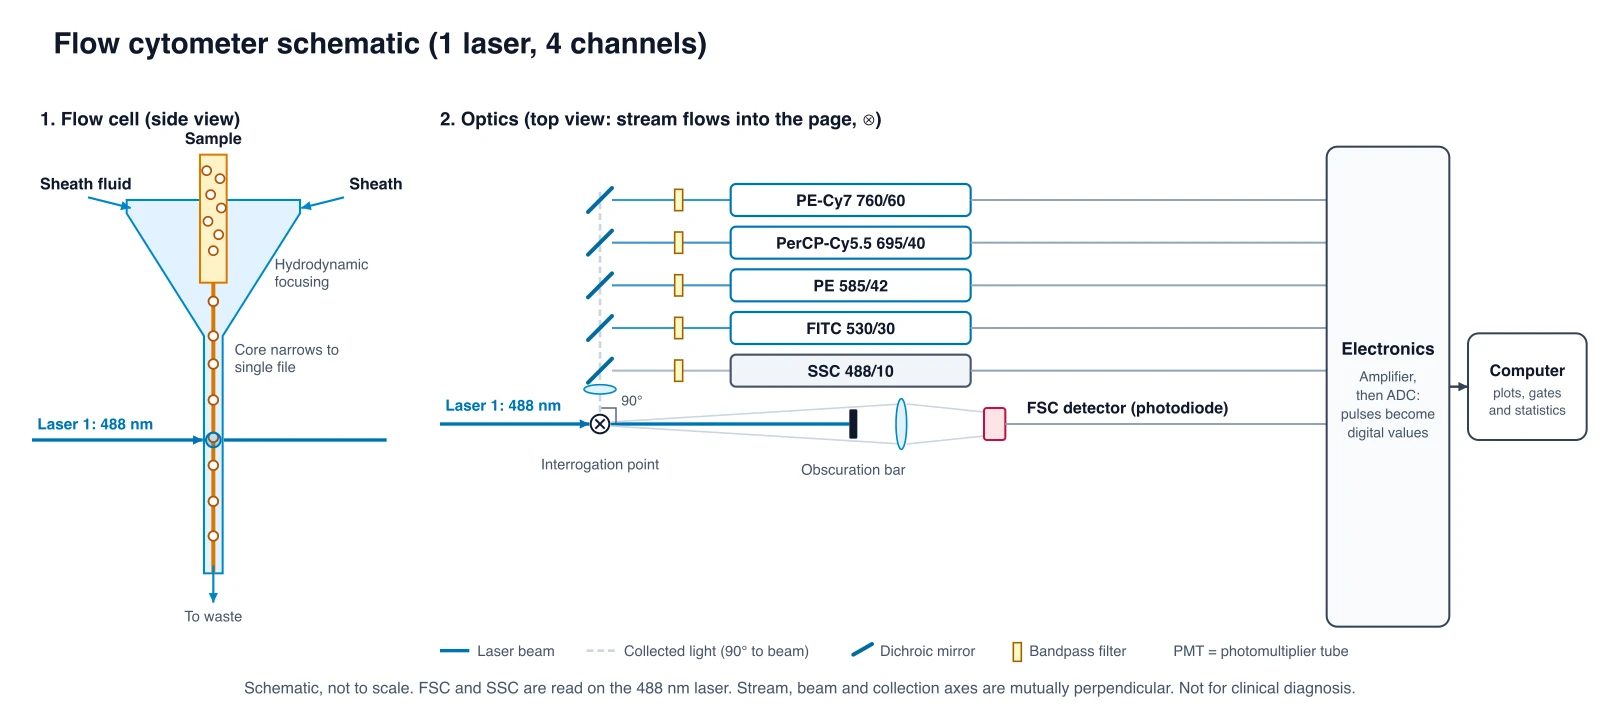 Flow Cytometry Diagram GeneratorDraw a flow cytometer schematic with editable lasers and channels, an illustrative FSC vs SSC gating plot, or a FACS sorting diagram.
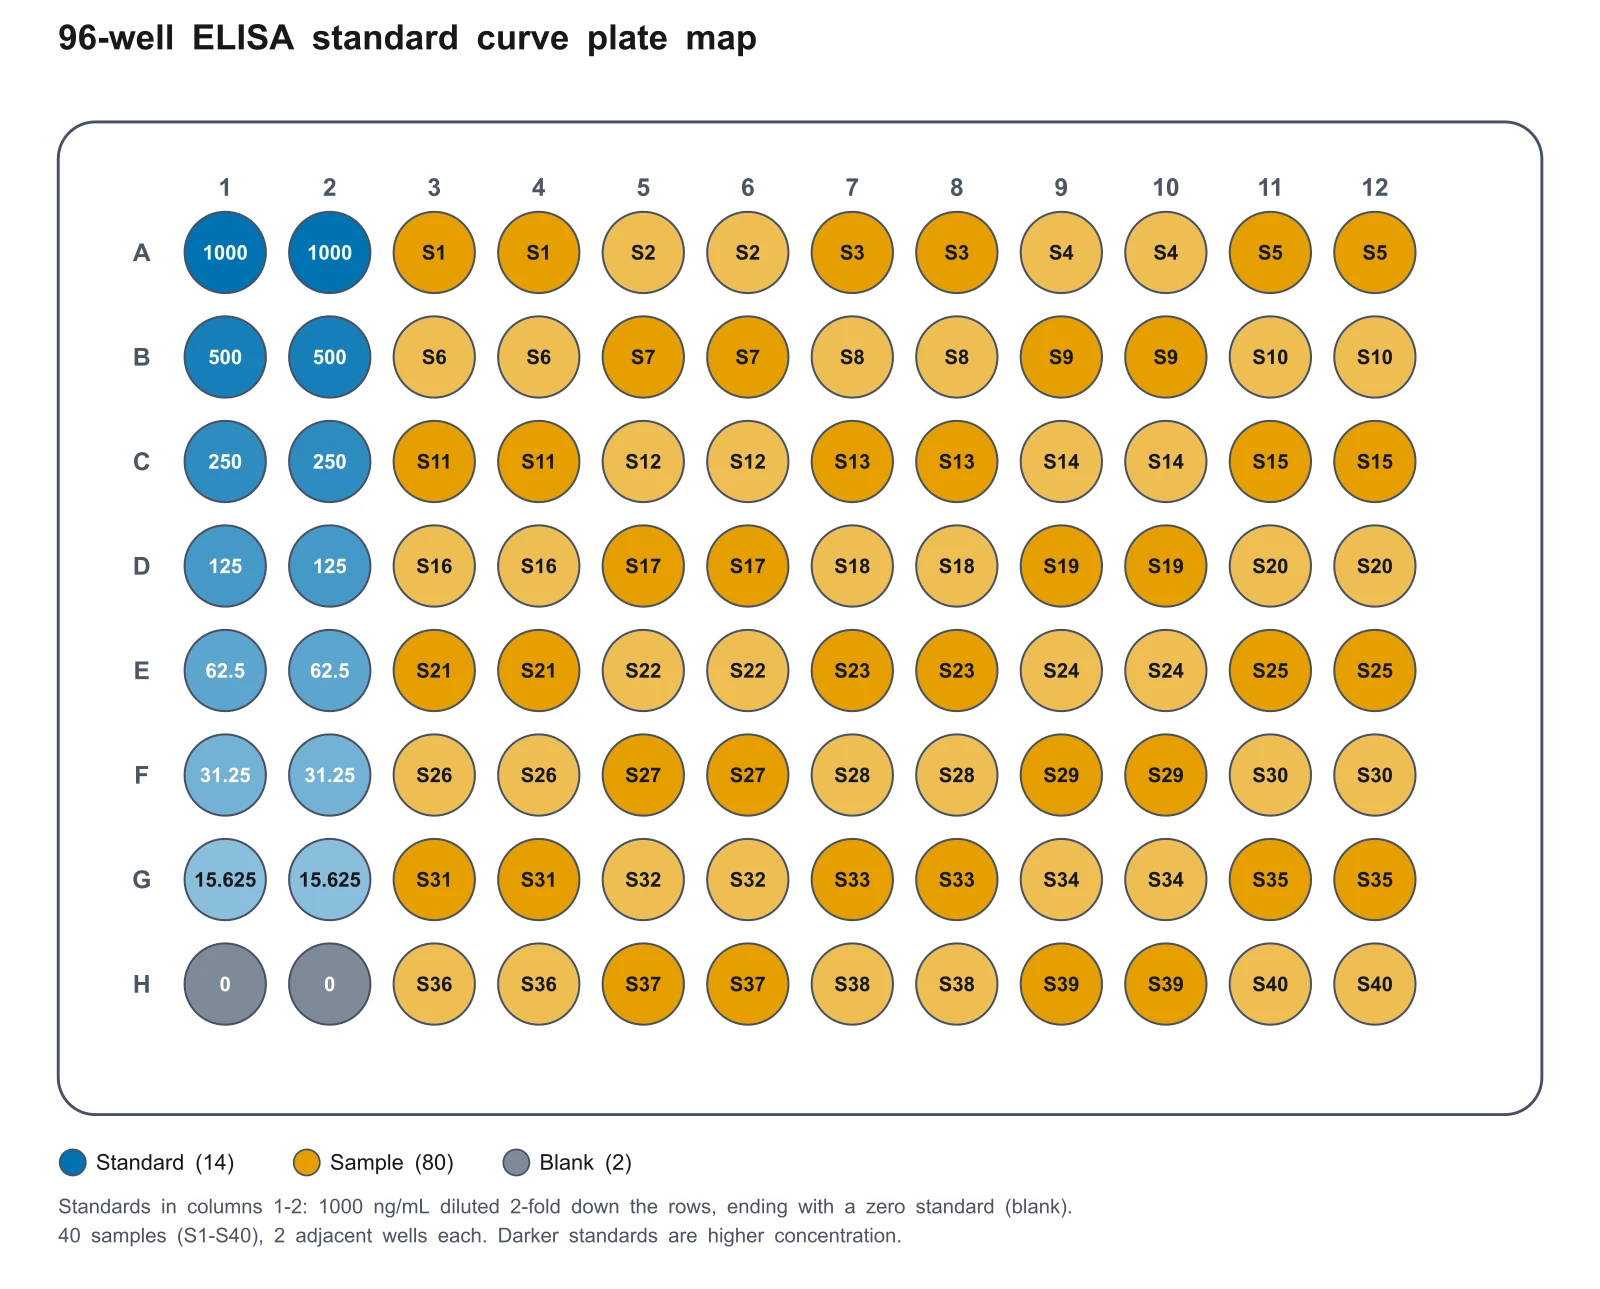 96 Well Plate Template GeneratorMake a 96 or 384 well plate map with standard curve, serial dilution, replicate and control presets, and export SVG, PNG, PDF or CSV.
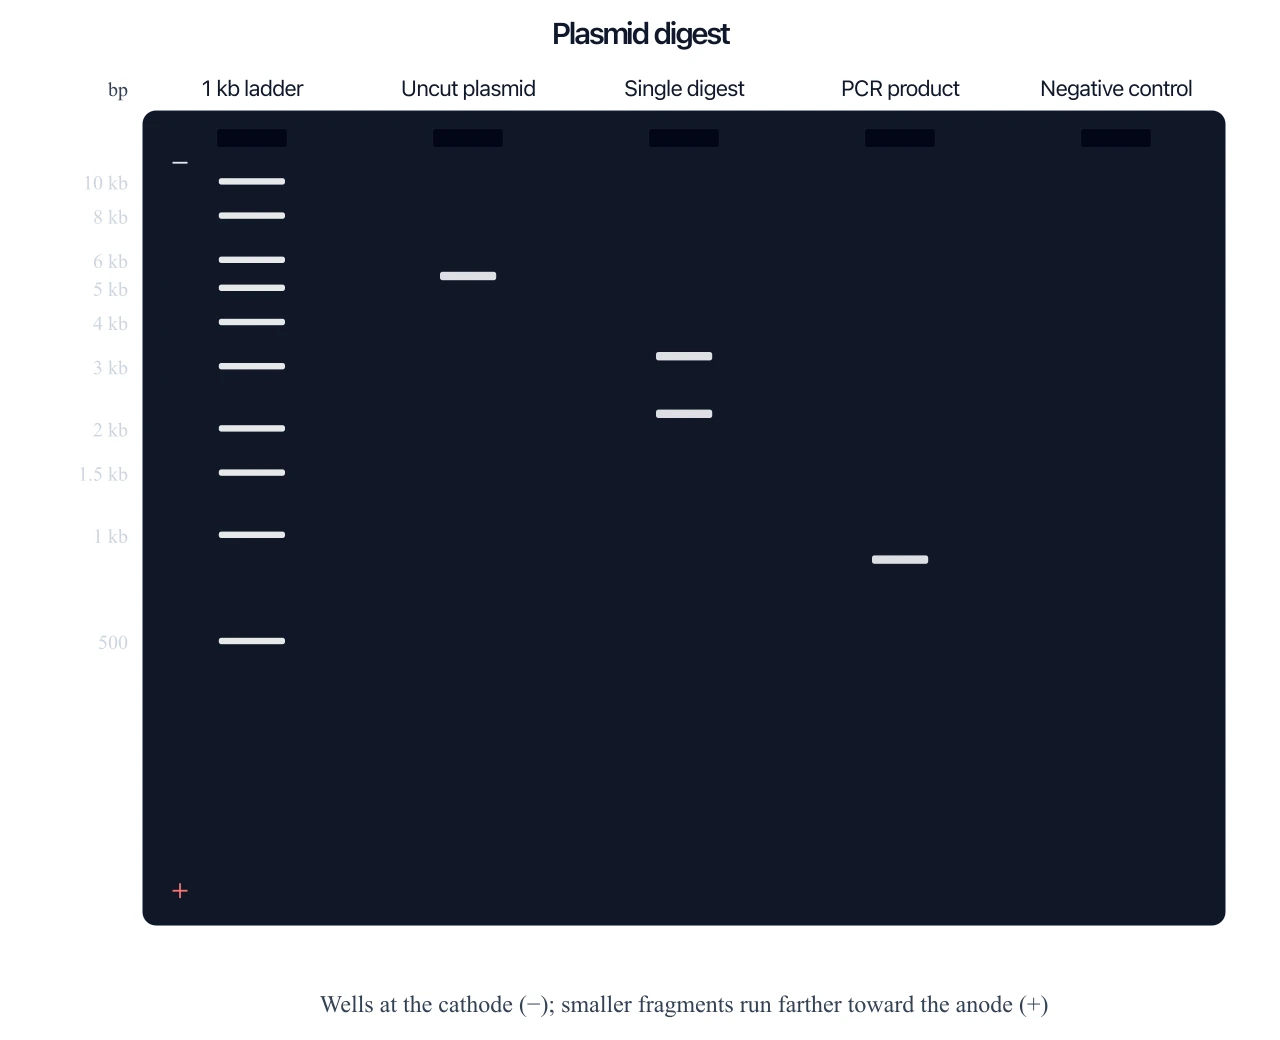 Gel Electrophoresis Diagram GeneratorPaste DNA or protein fragment sizes to draw an exact agarose or SDS-PAGE gel and download SVG.
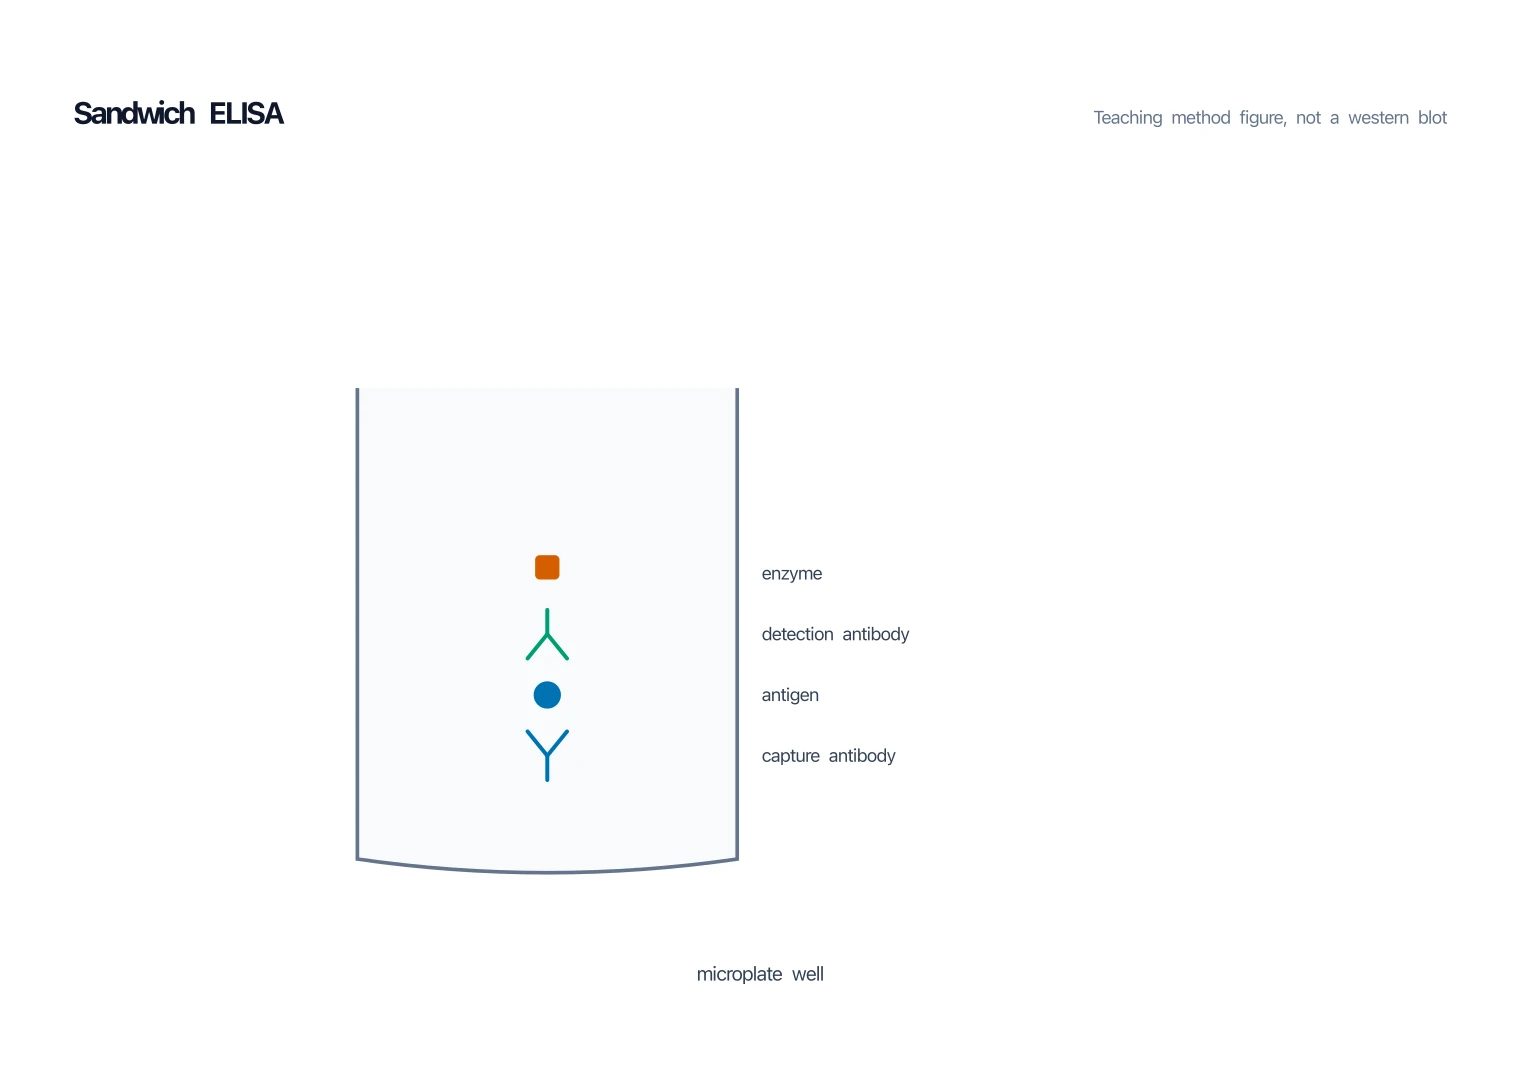 ELISA Diagram GeneratorGenerate a labeled sandwich, blank, or type-comparison ELISA diagram — well and antibody stack, not a western blot.
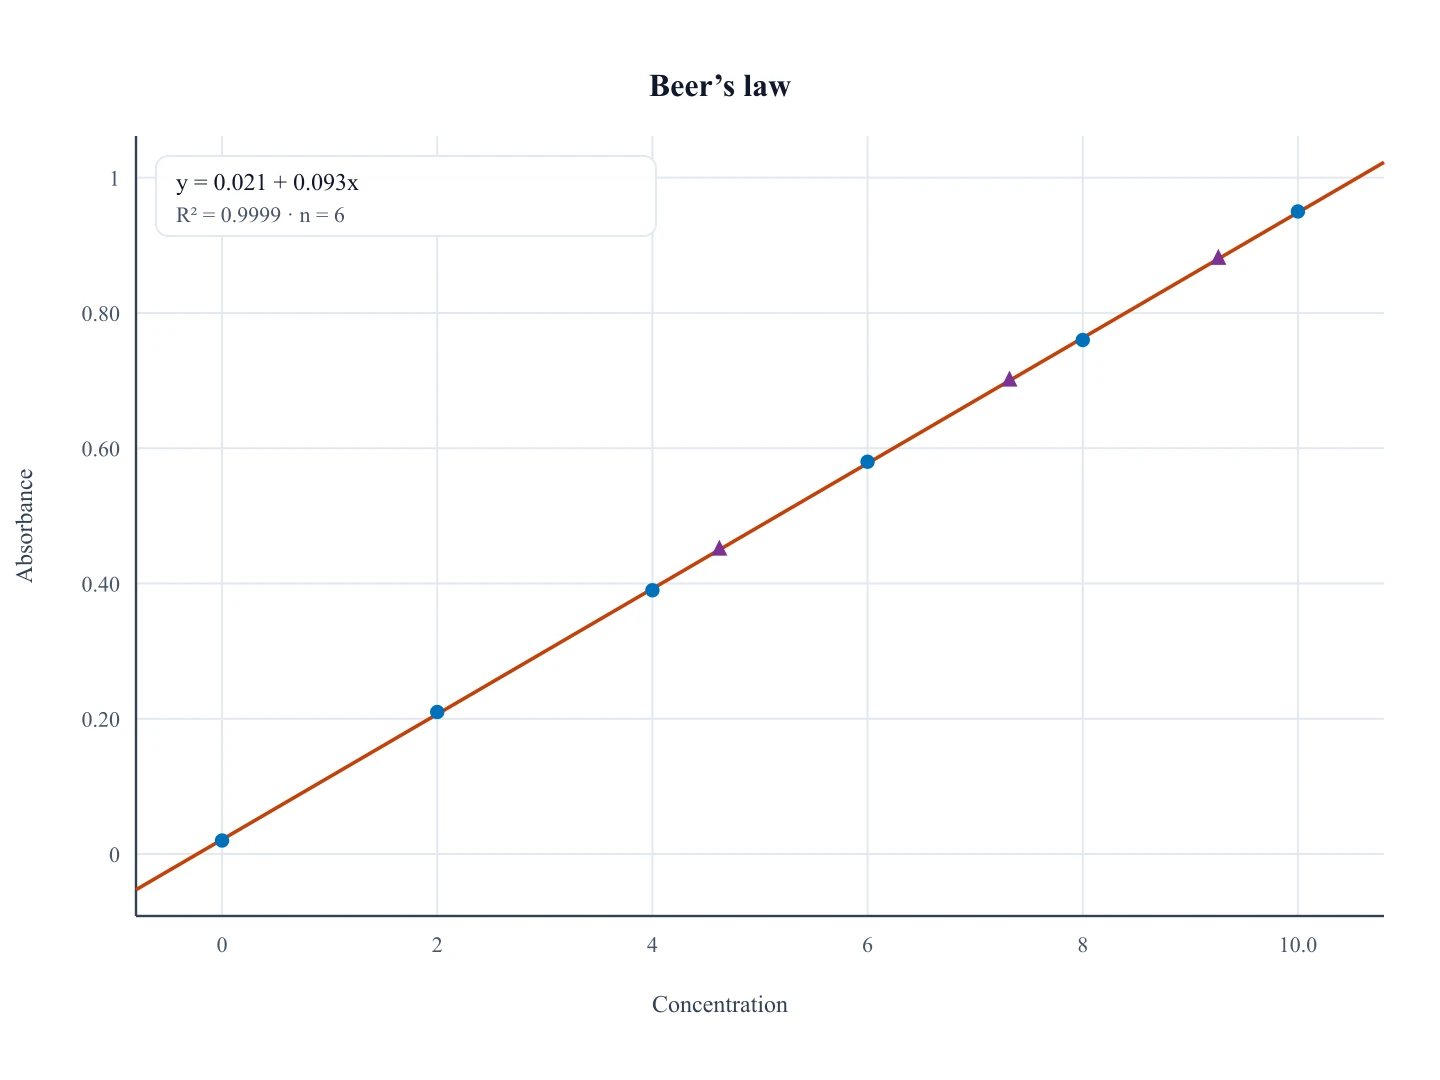 Calibration Curve GeneratorPaste standard concentrations and signals to fit a line, read unknowns, and download SVG.
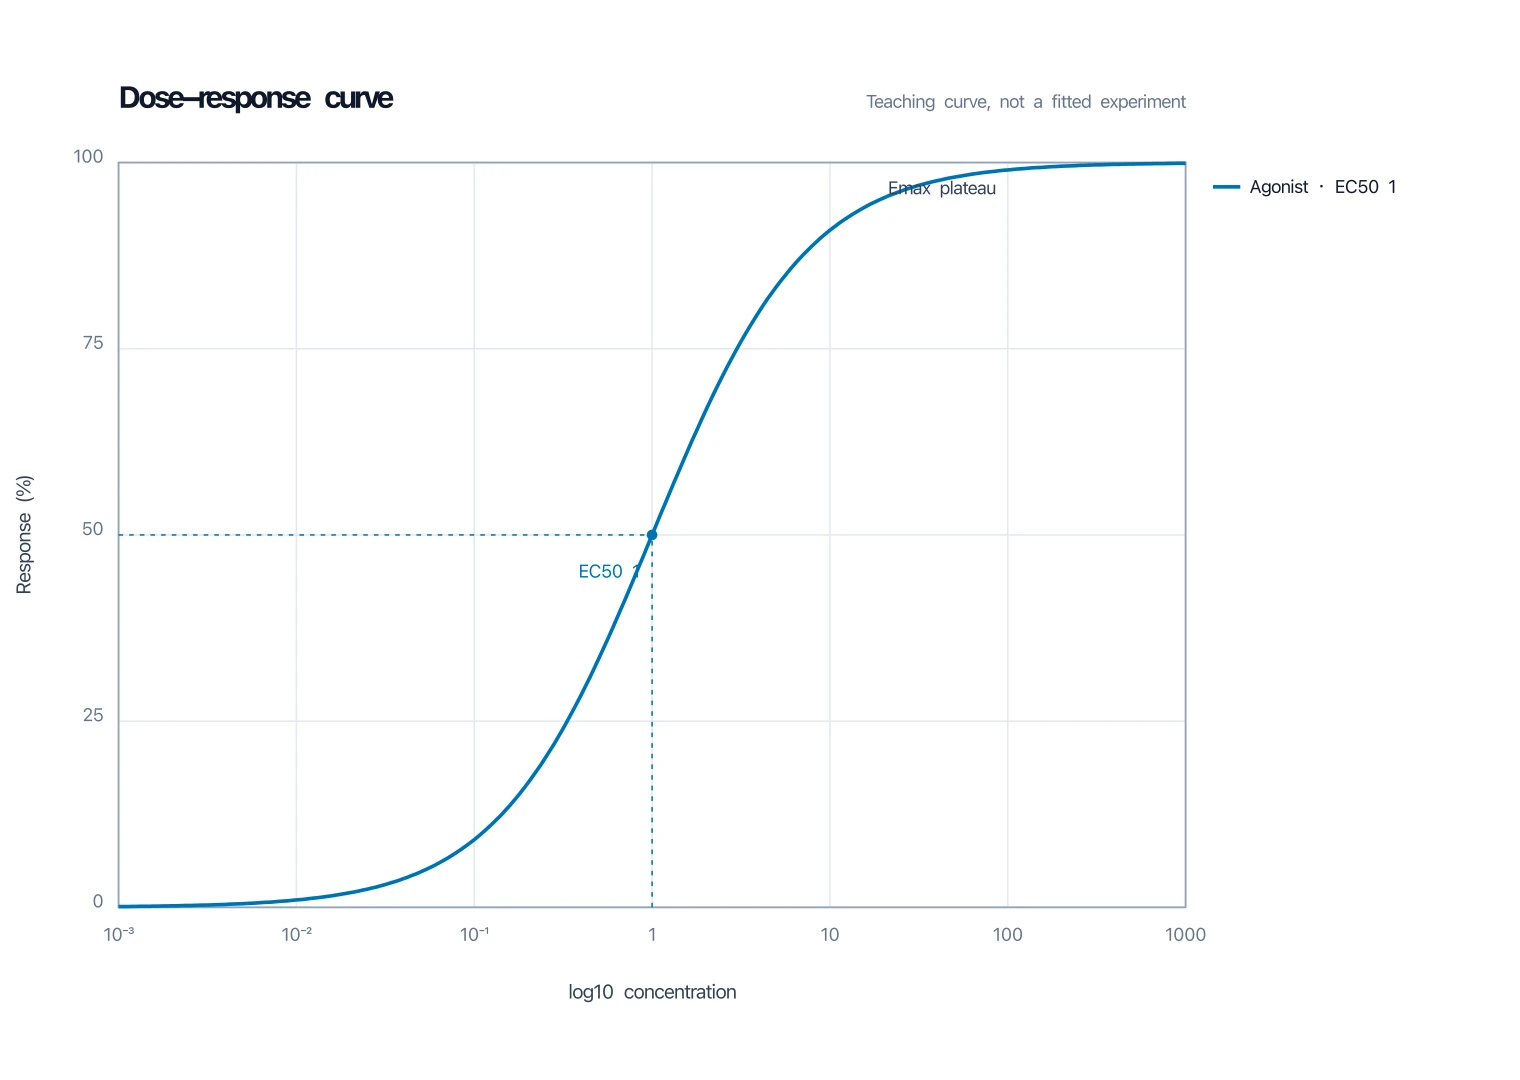 Dose-Response Curve GeneratorGenerate a labeled, blank, IC50, or Hill-slope dose-response curve — sigmoid log-dose plot with EC50.
Genetics and ecology
Inheritance patterns and energy flow.
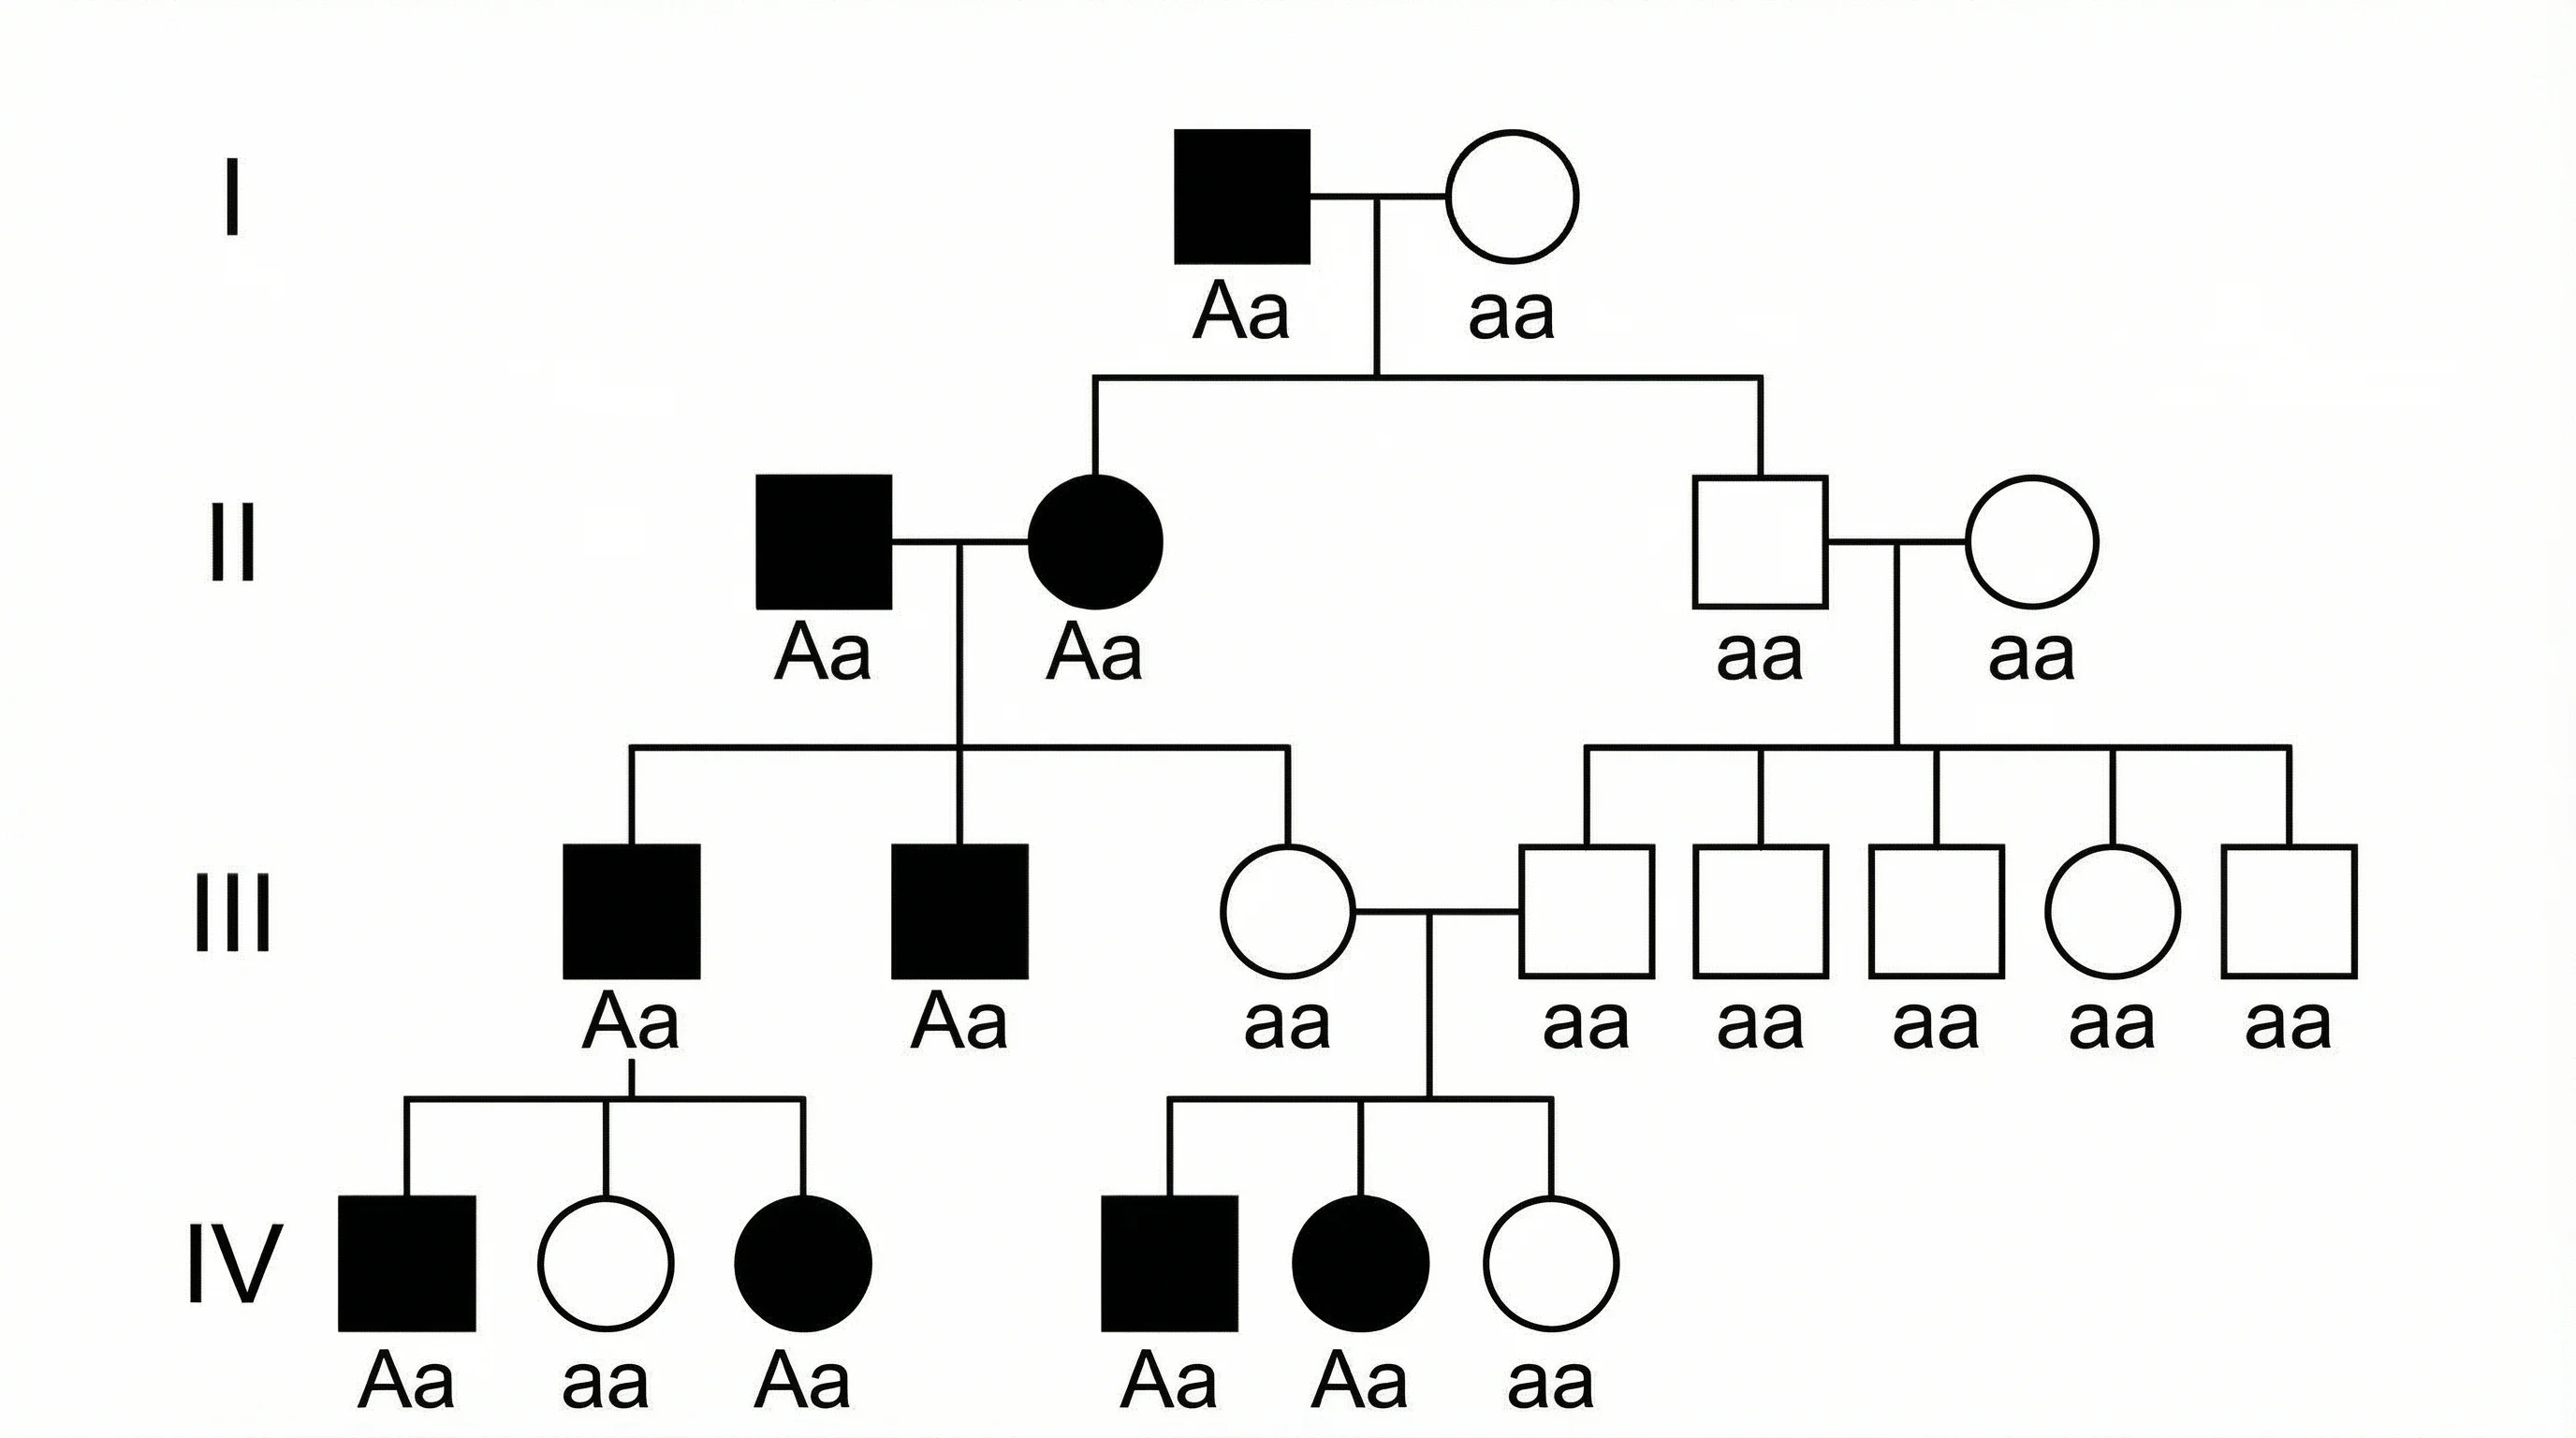 Punnett Square MakerCreate Punnett squares for genetics problems, allele combinations, genotype ratios, and inheritance worksheets.
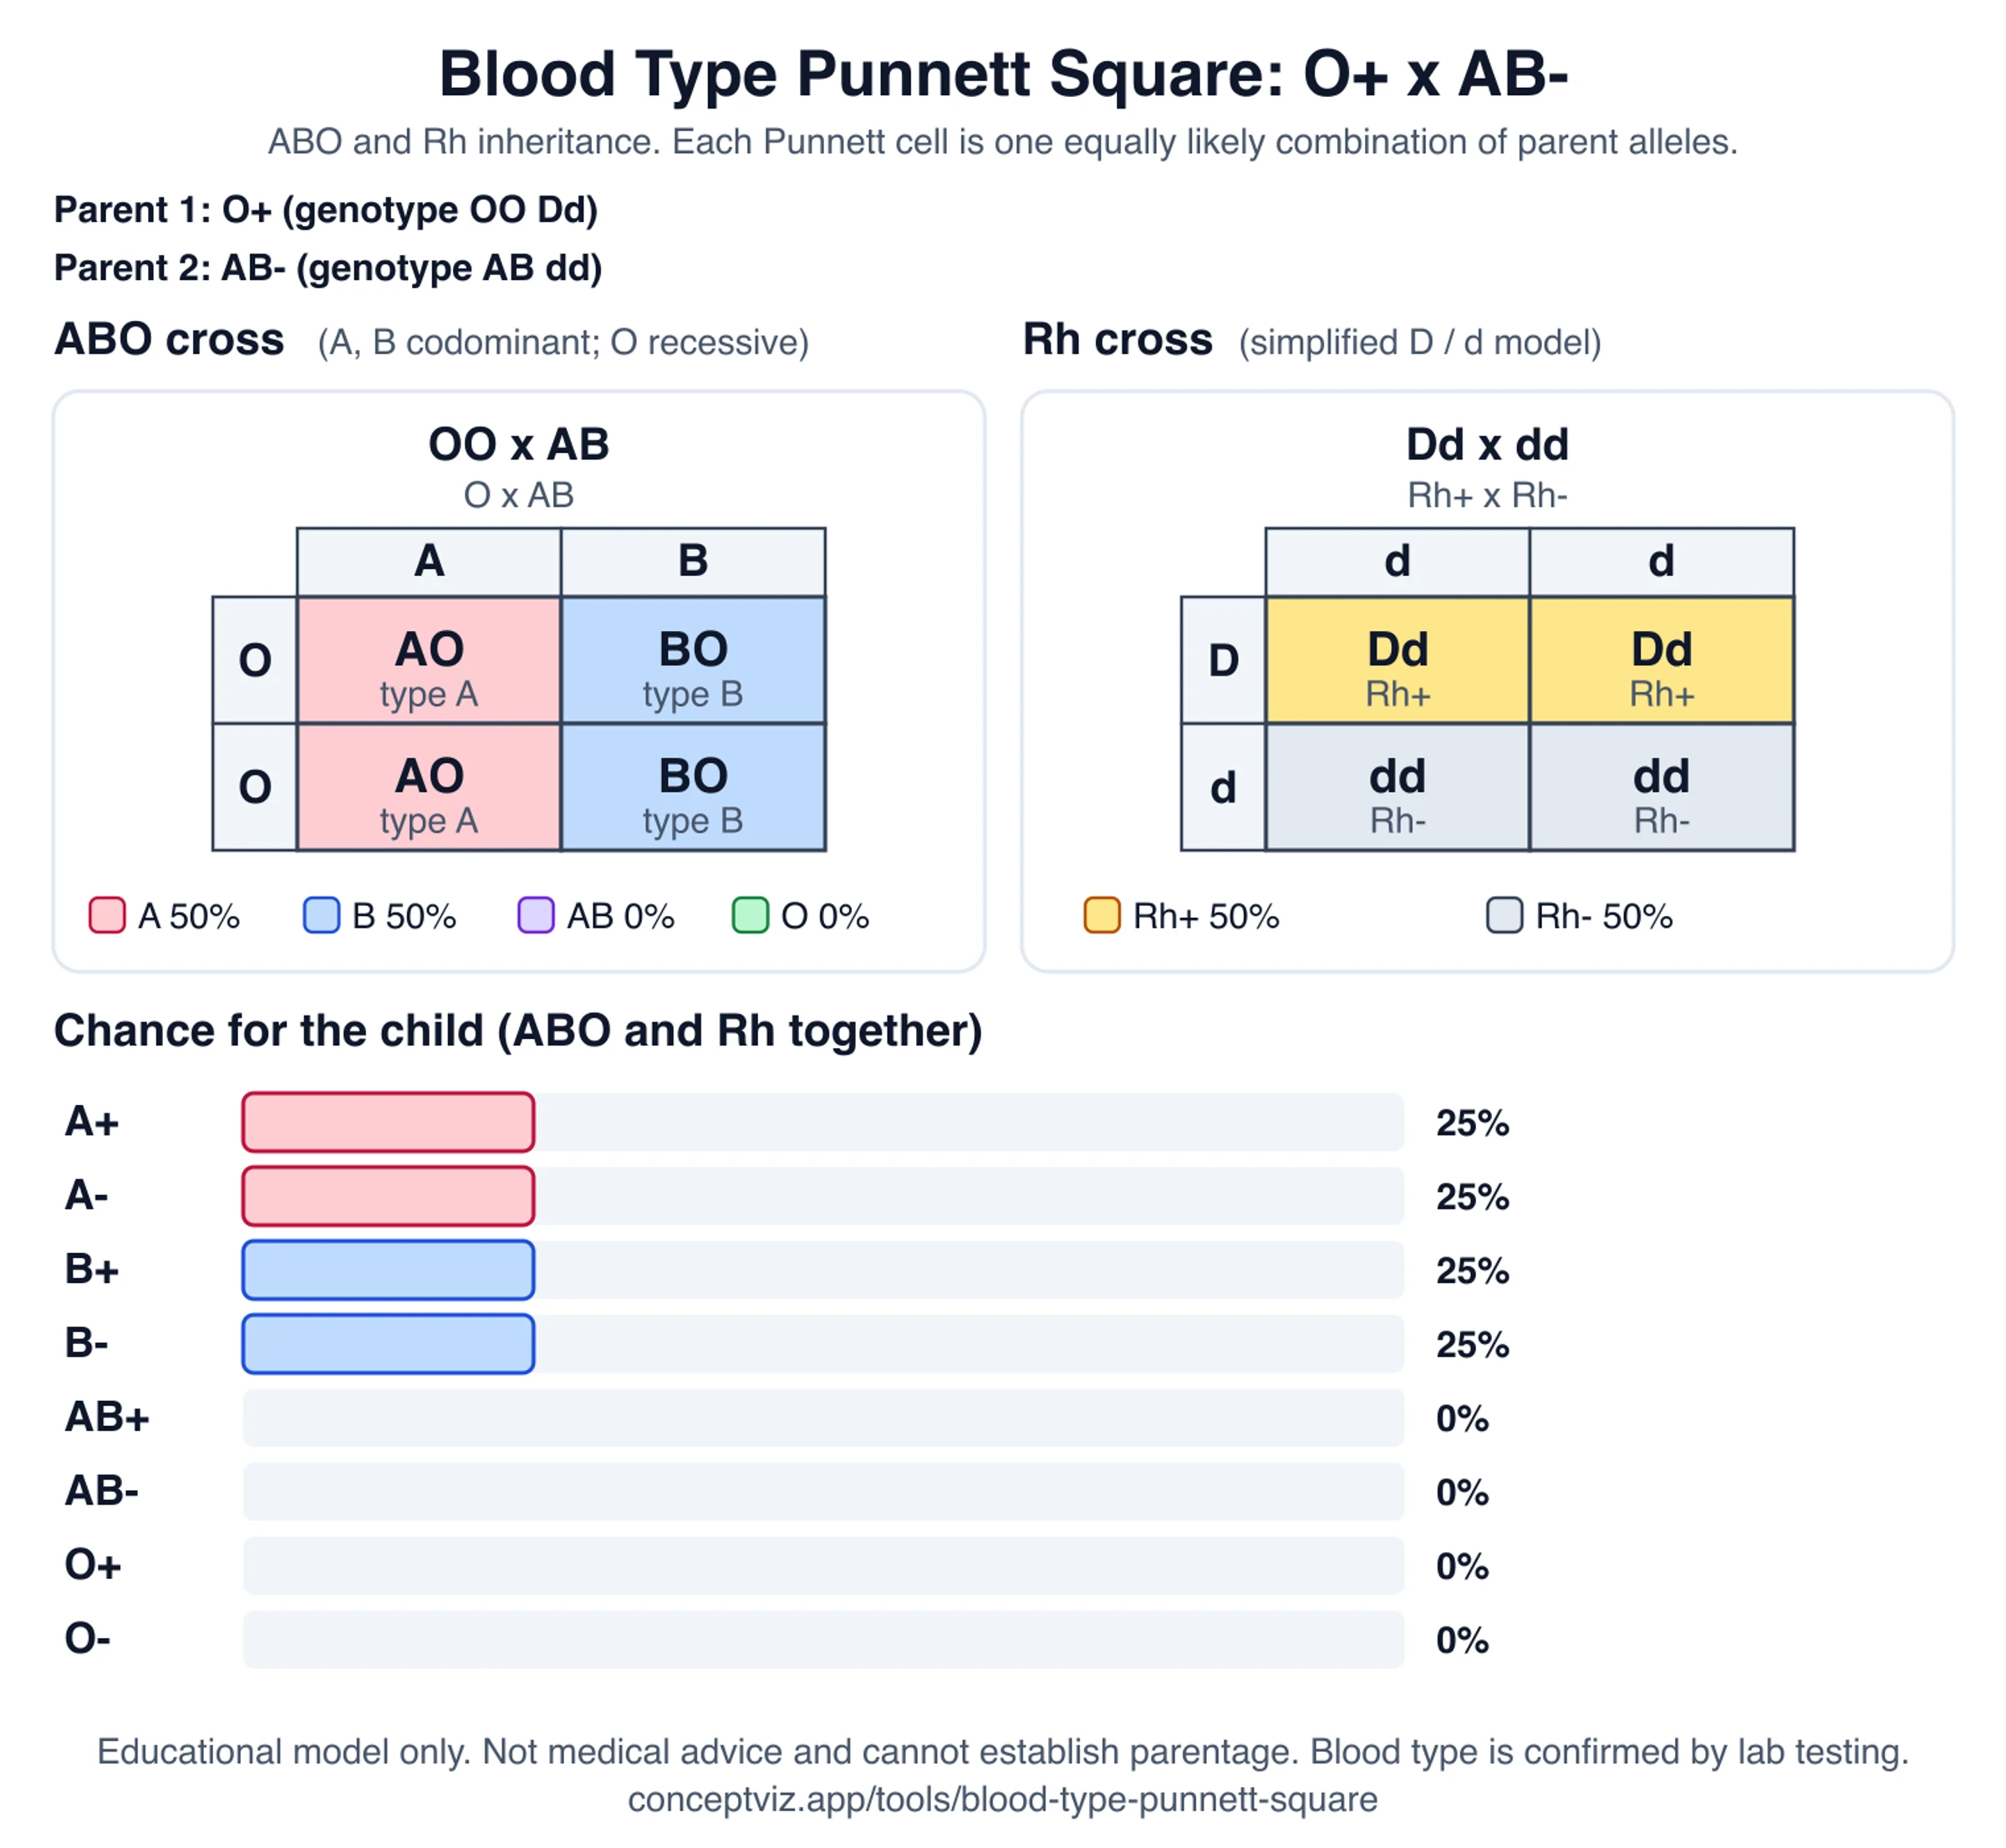 Blood Type Punnett SquareFree blood type Punnett square calculator for ABO and Rh: parents to child chances, genotype tables, printable practice sheet.
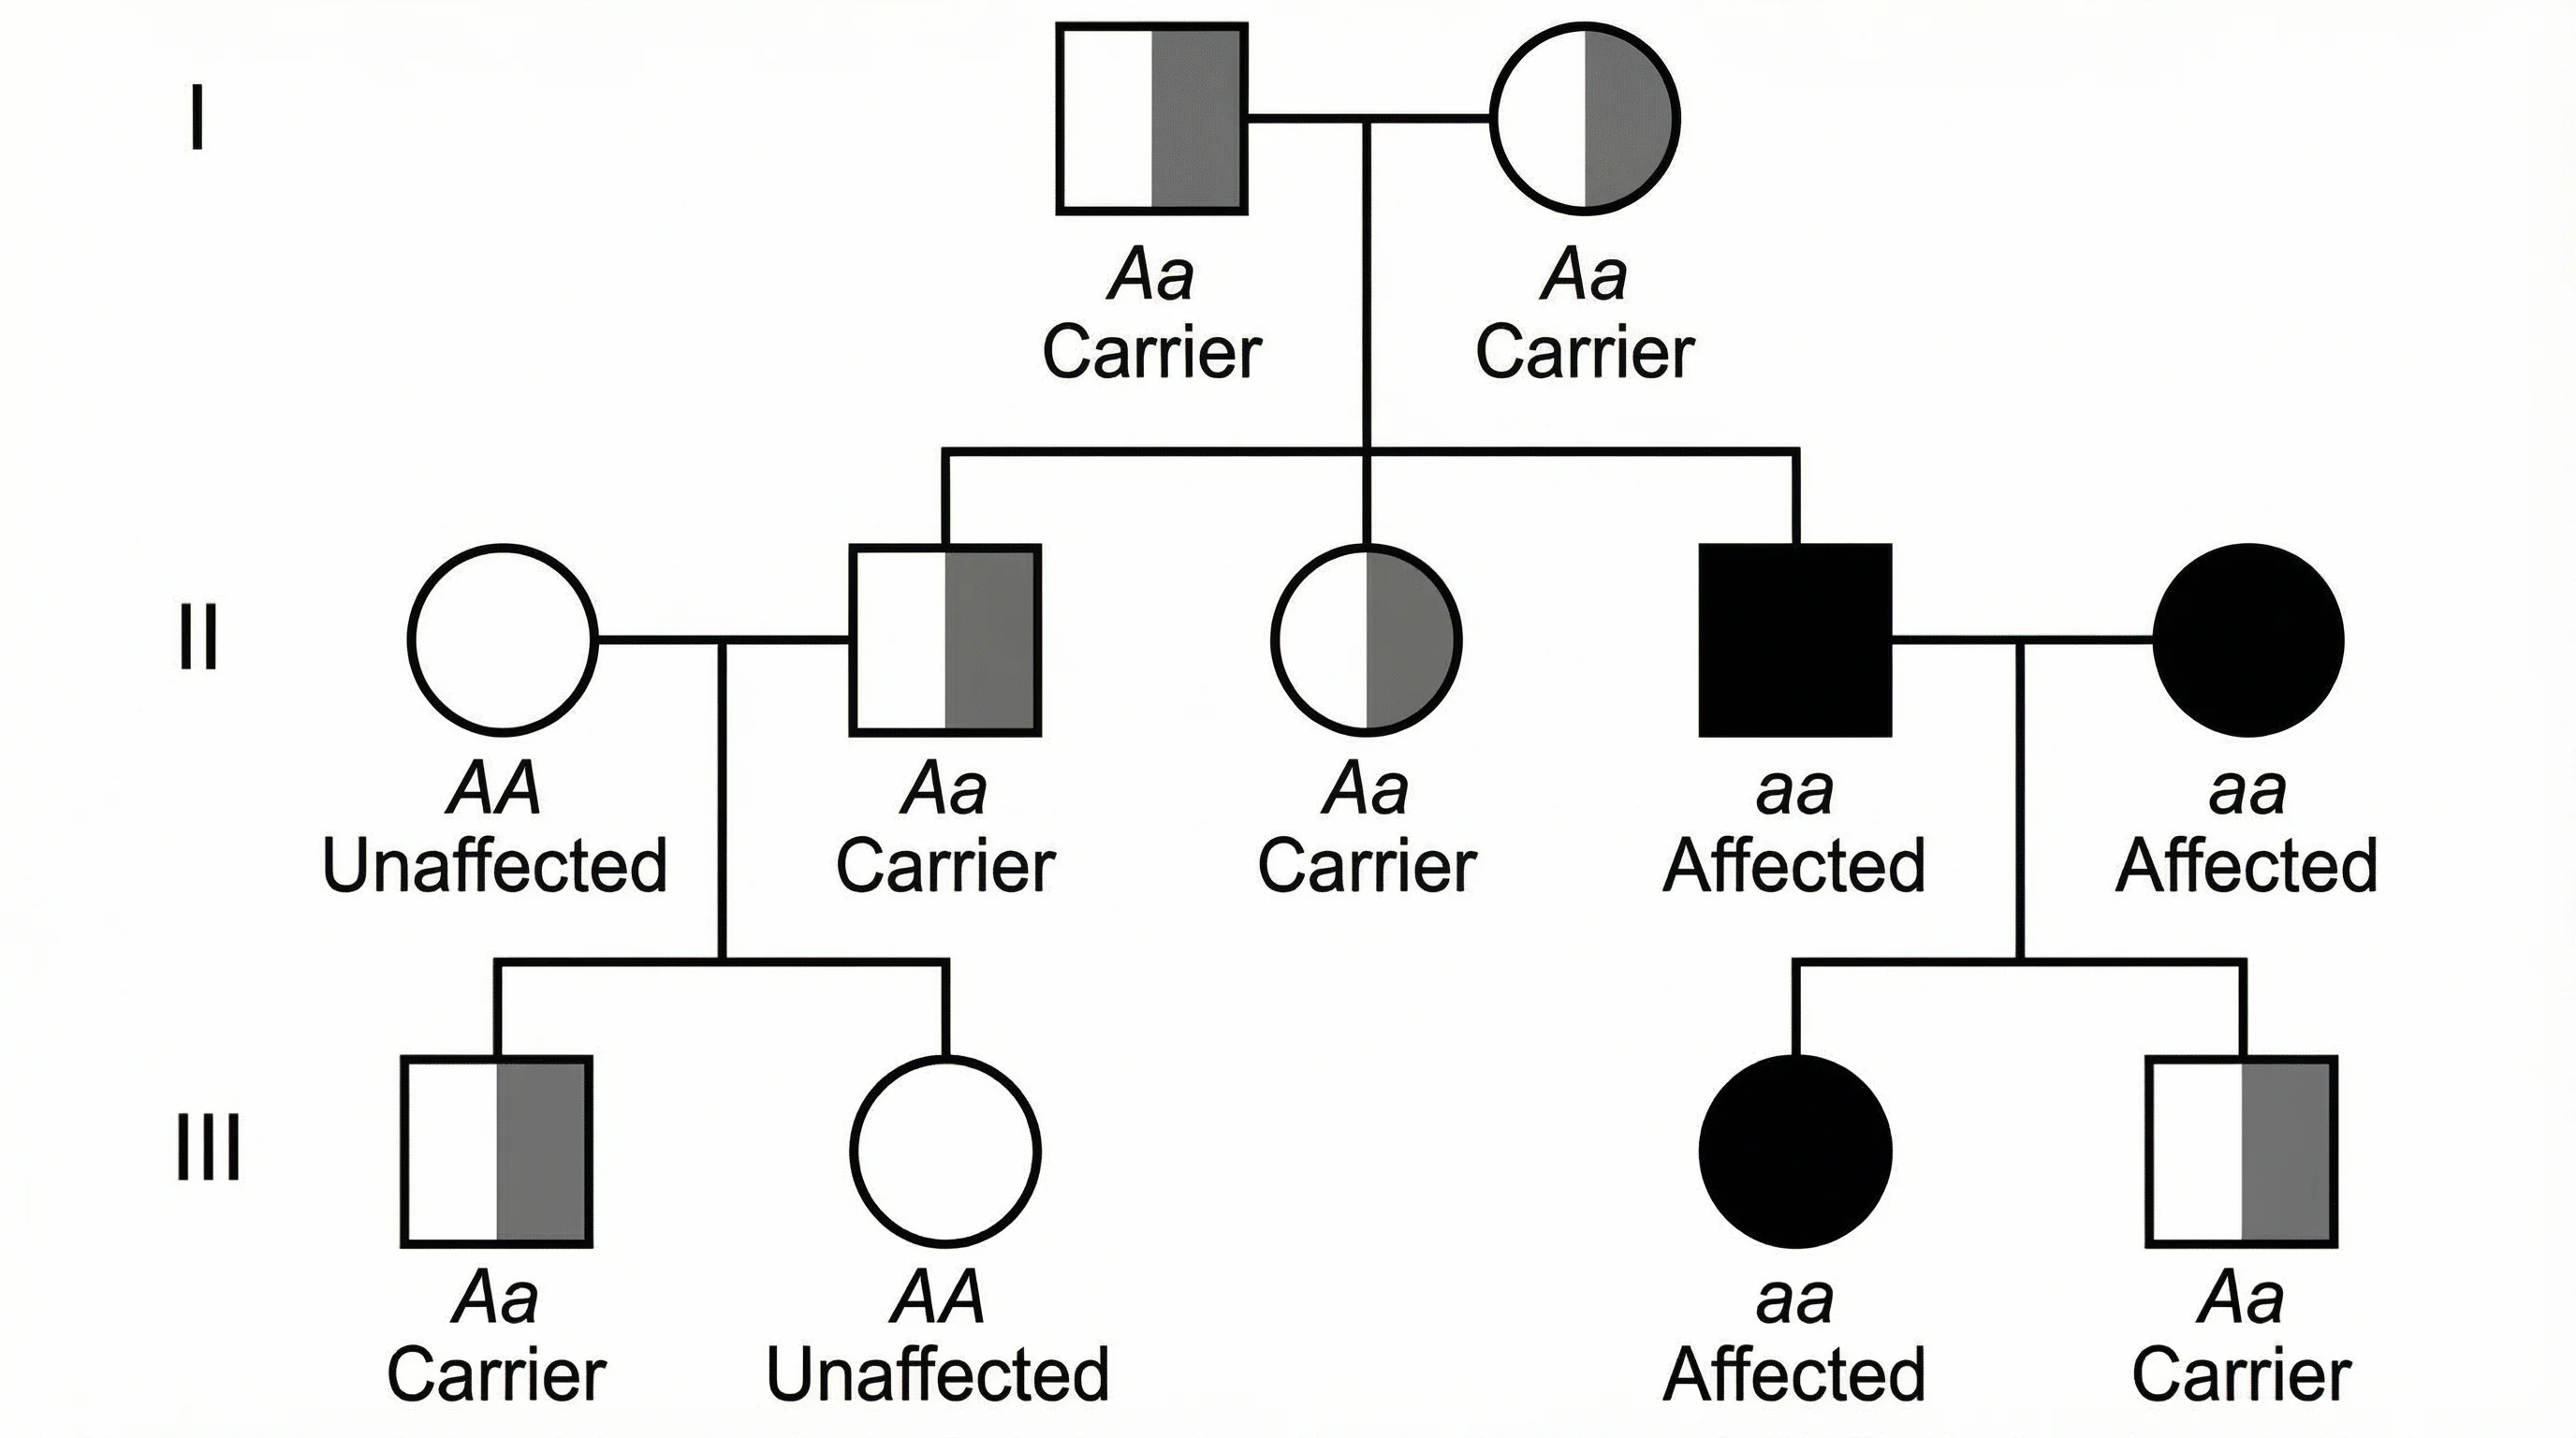 Pedigree Chart MakerCreate genetics pedigree charts with standard symbols, inheritance patterns, and carrier notation for biology class.
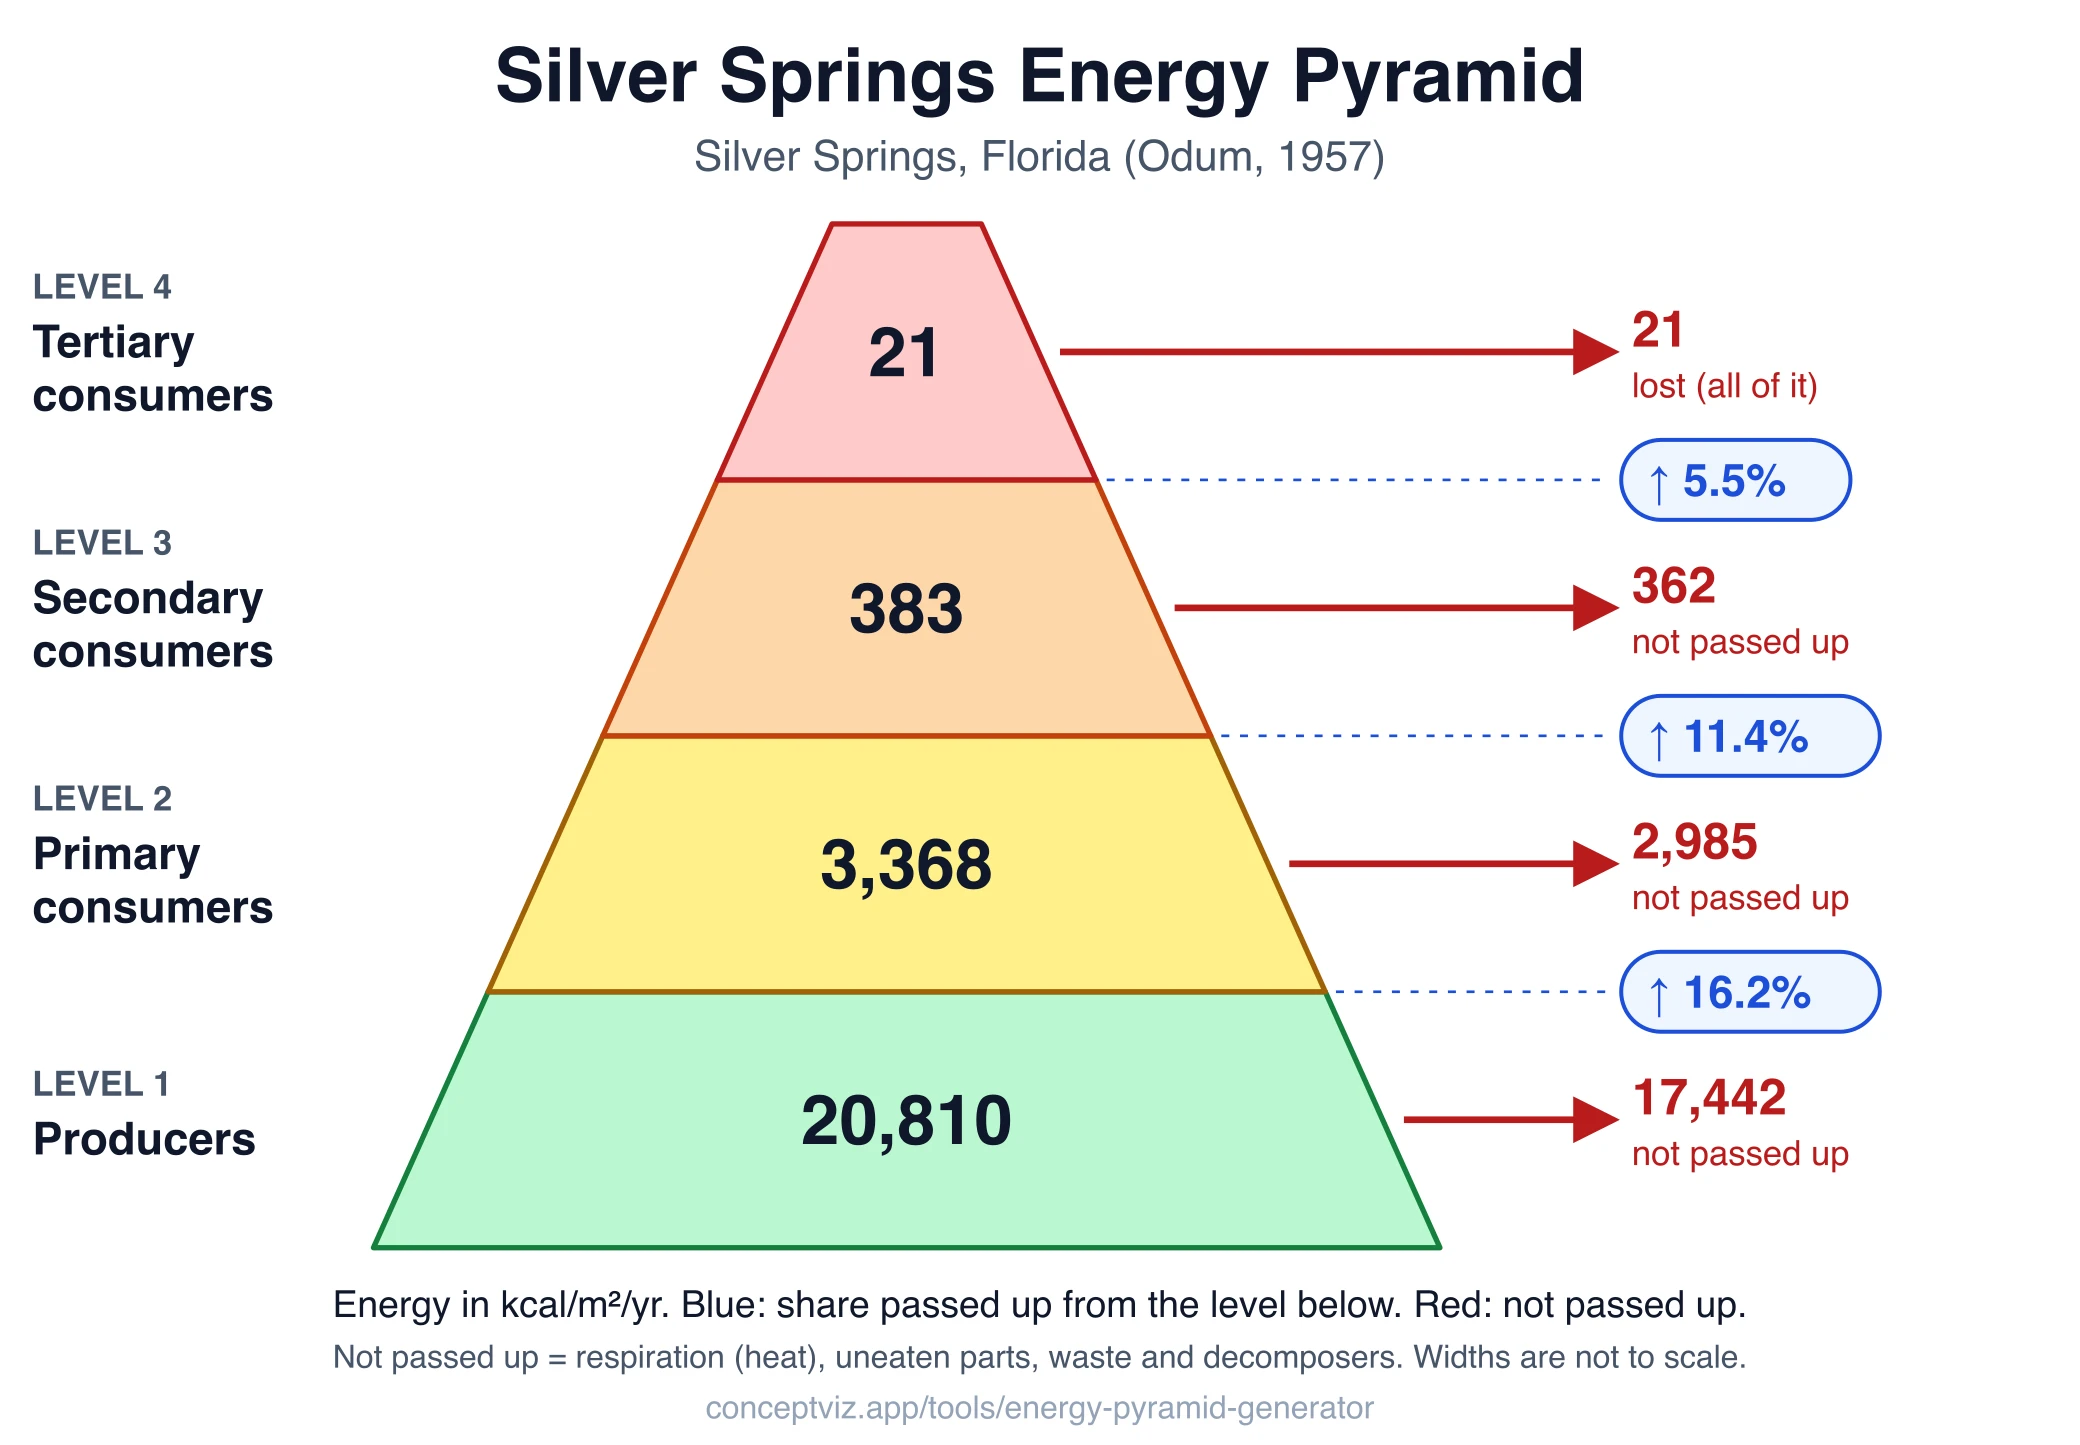 Energy Pyramid GeneratorTurn producer energy and a transfer efficiency into an energy pyramid with values per level, the 10% rule and the Silver Springs example.
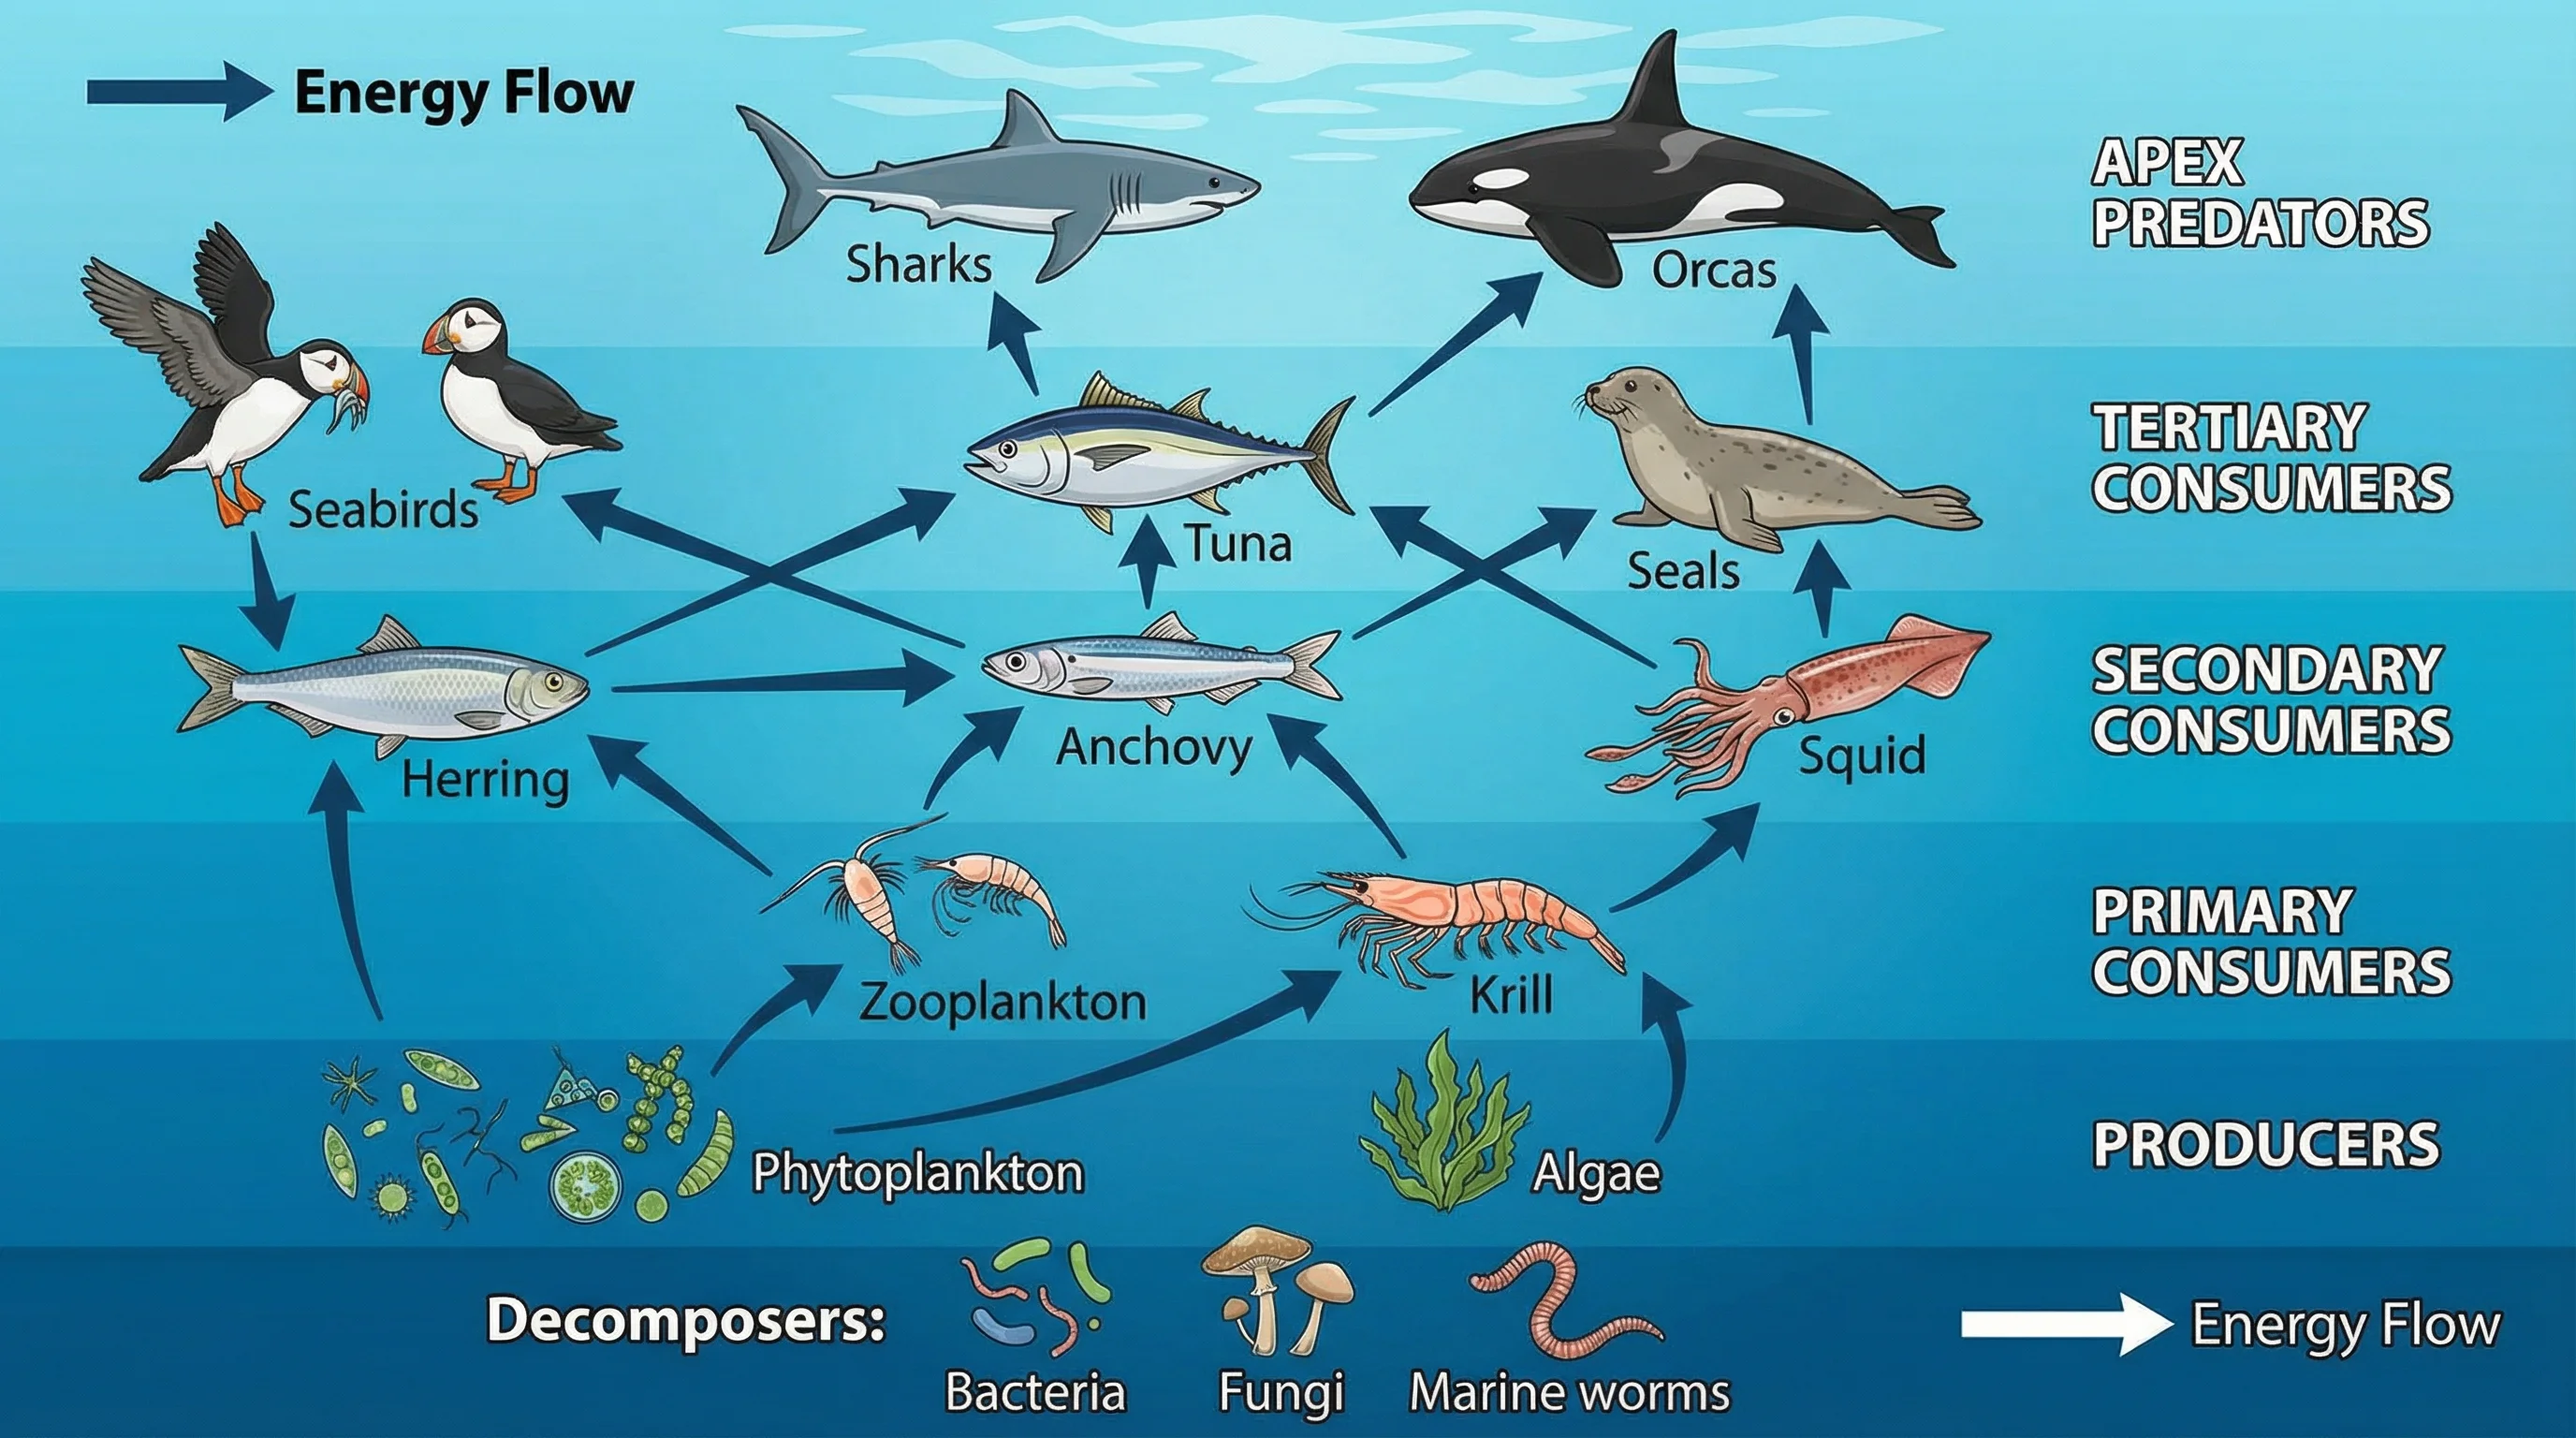 Food Web MakerCreate food web diagrams showing complex feeding relationships in ecosystems for ecology and biology class.
Study design and reporting
Flow diagrams and plots that reviewers expect.
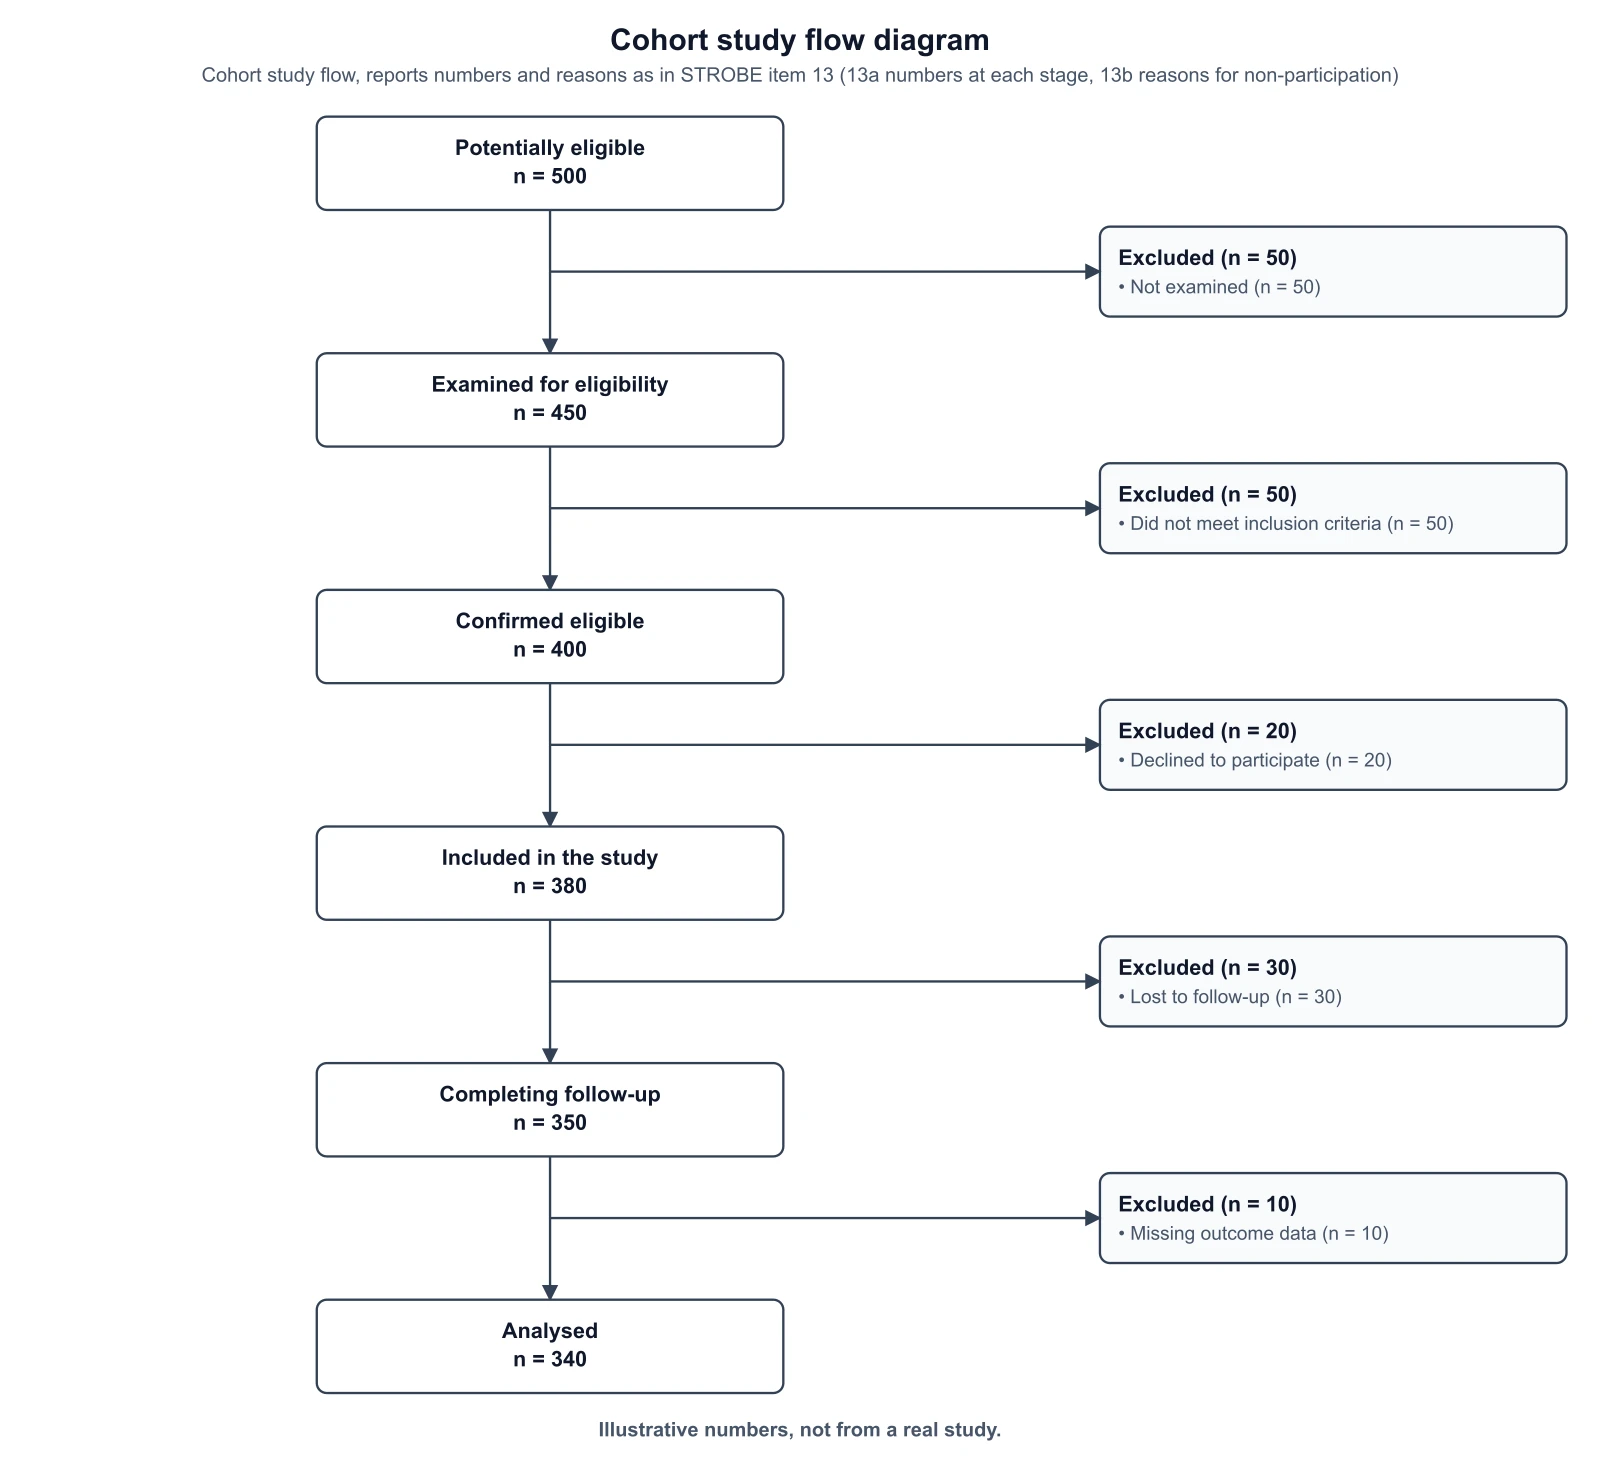 STROBE Flow Diagram GeneratorDraw a cohort study flow diagram that follows STROBE item 13: numbers at each stage, reasons for non-participation, and exposure groups.
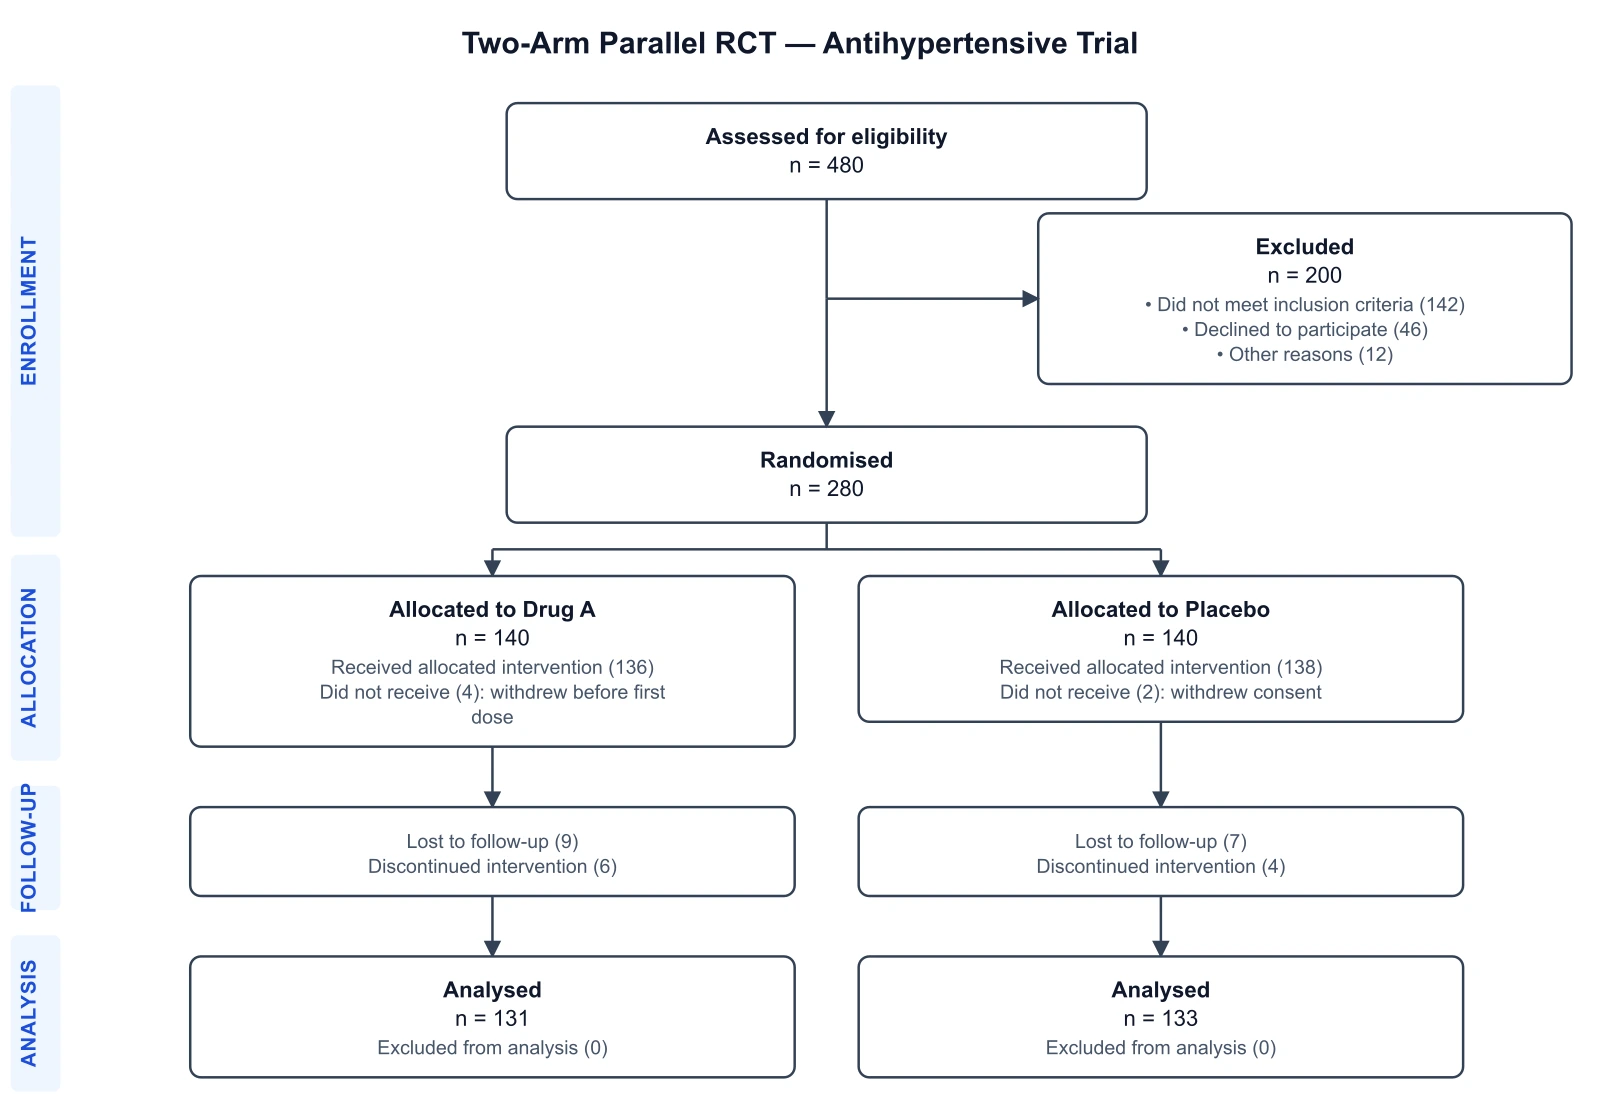 CONSORT Diagram GeneratorDraw a CONSORT 2010 participant flow diagram for a randomized controlled trial — enter your counts for enrollment, allocation, follow-up, and analysis, export SVG.
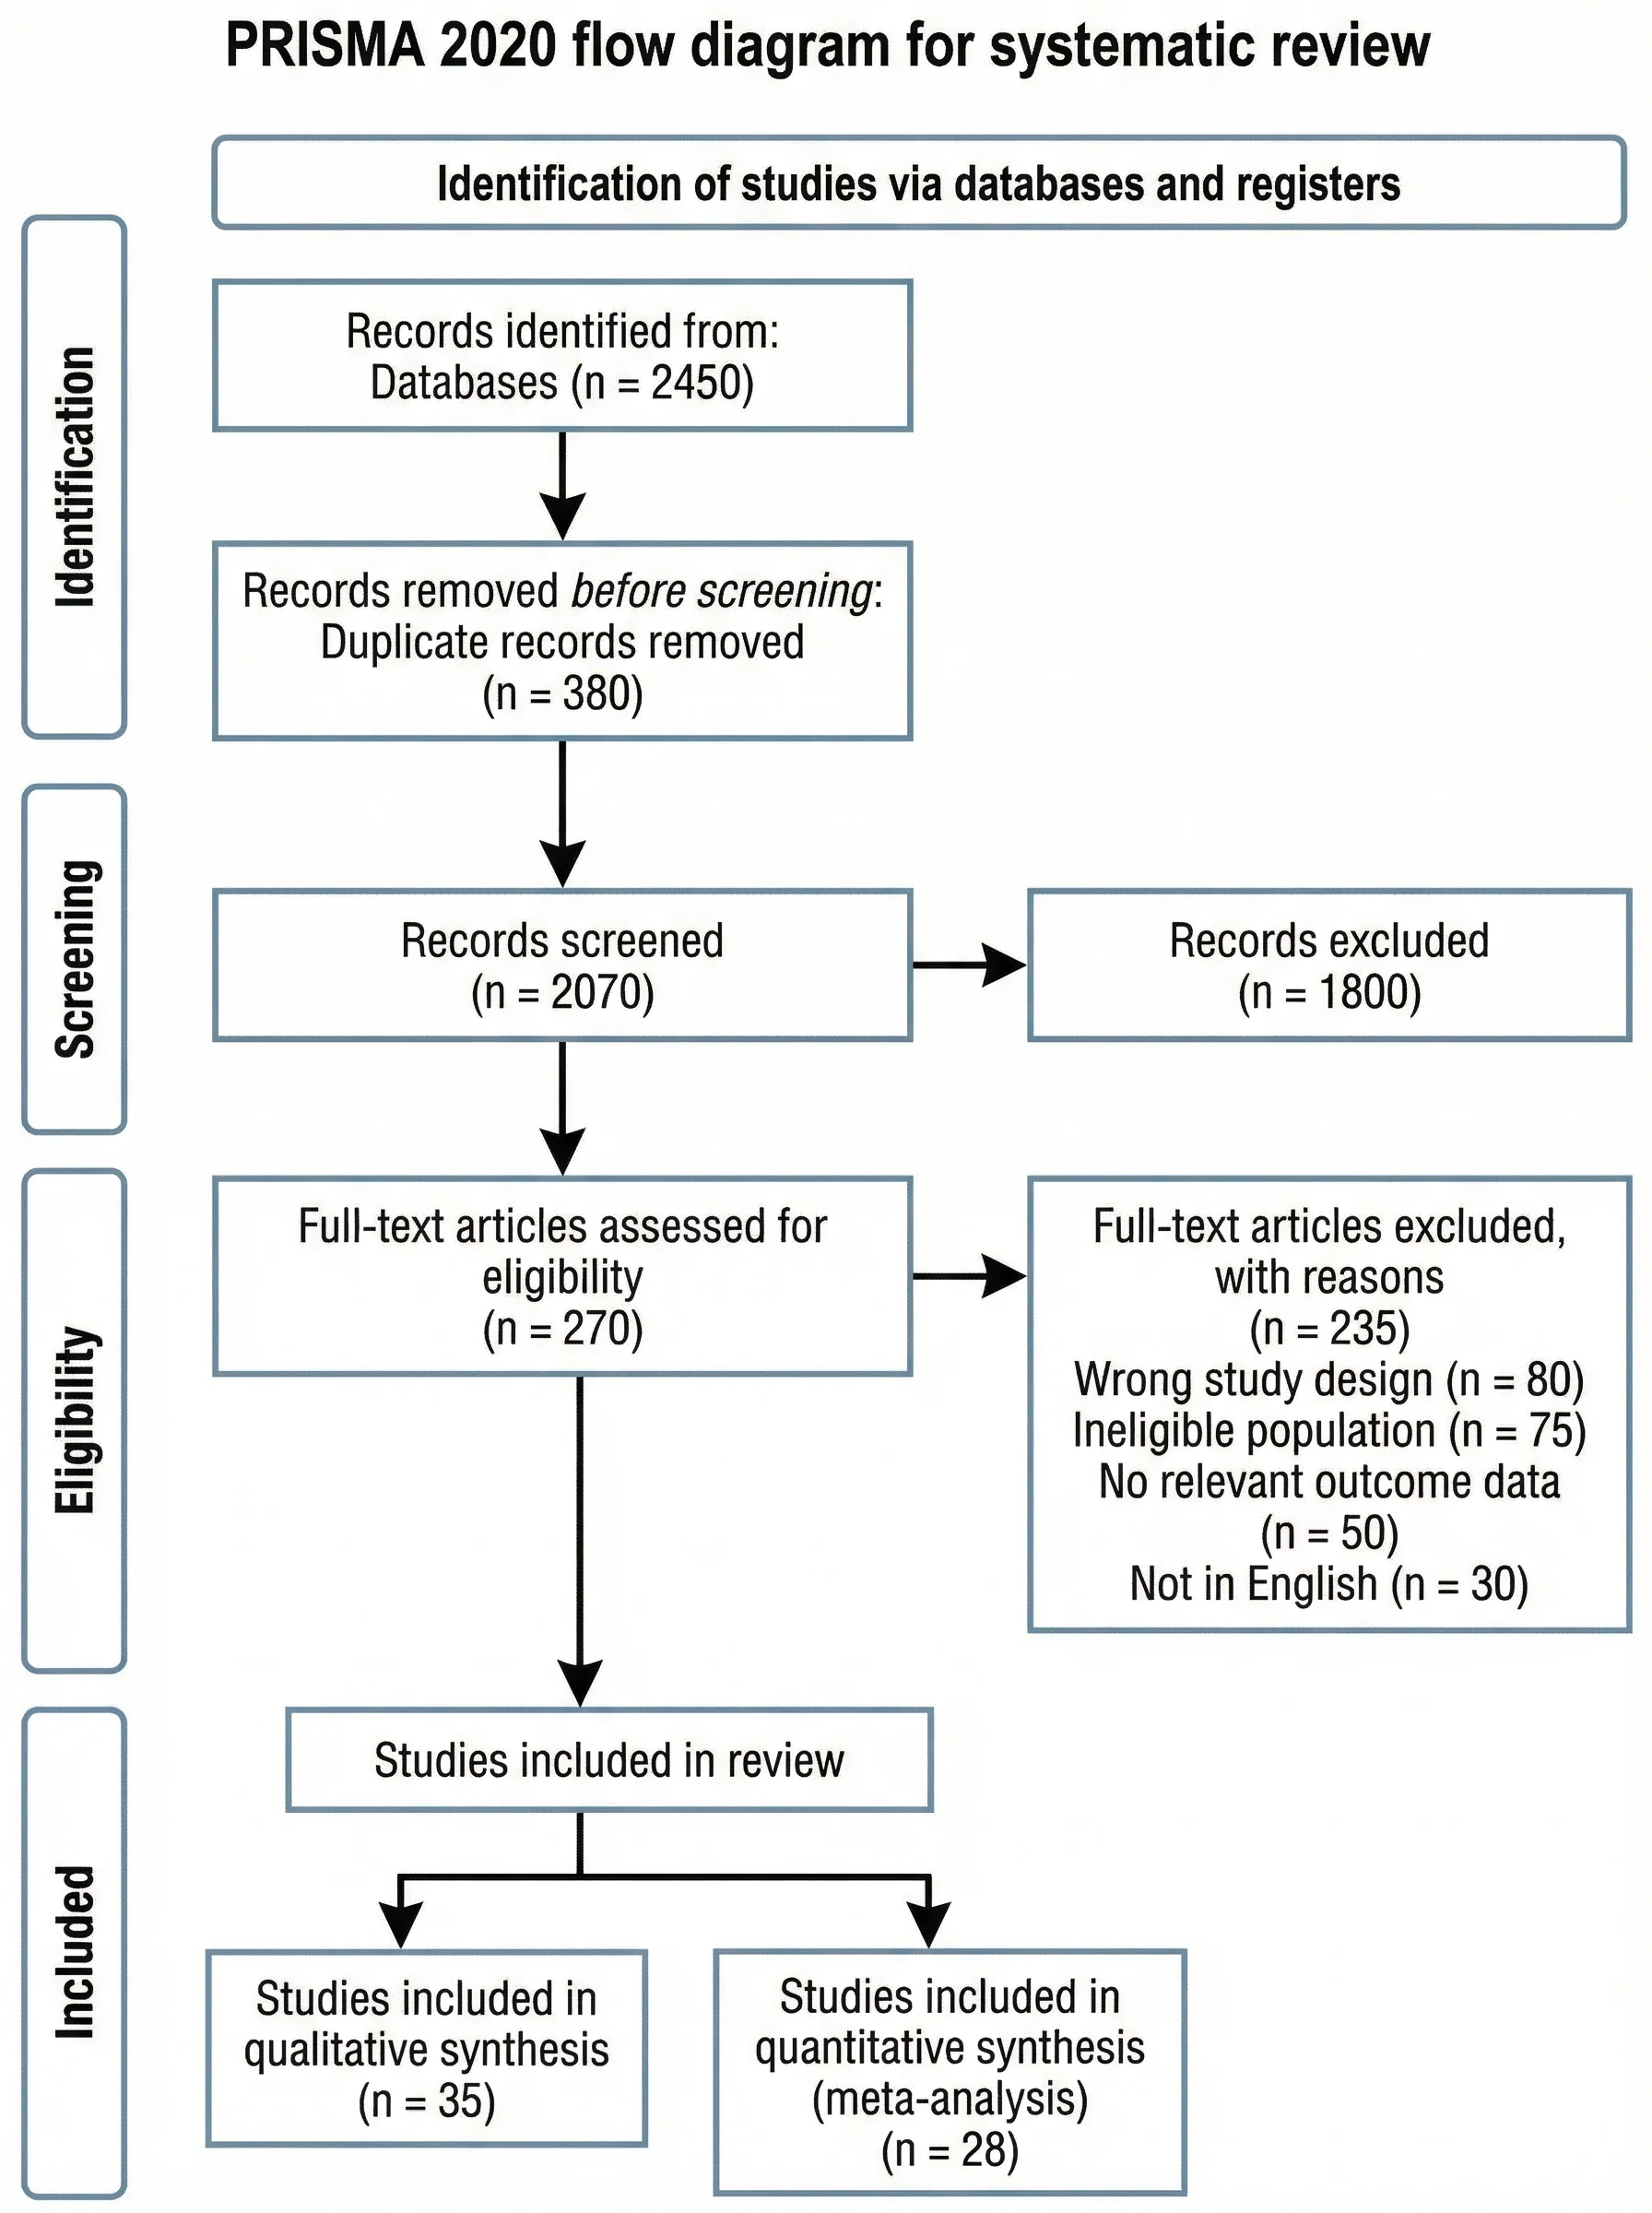 PRISMA Flow Diagram GeneratorCreate PRISMA 2020 flow diagrams for systematic reviews and meta-analyses.
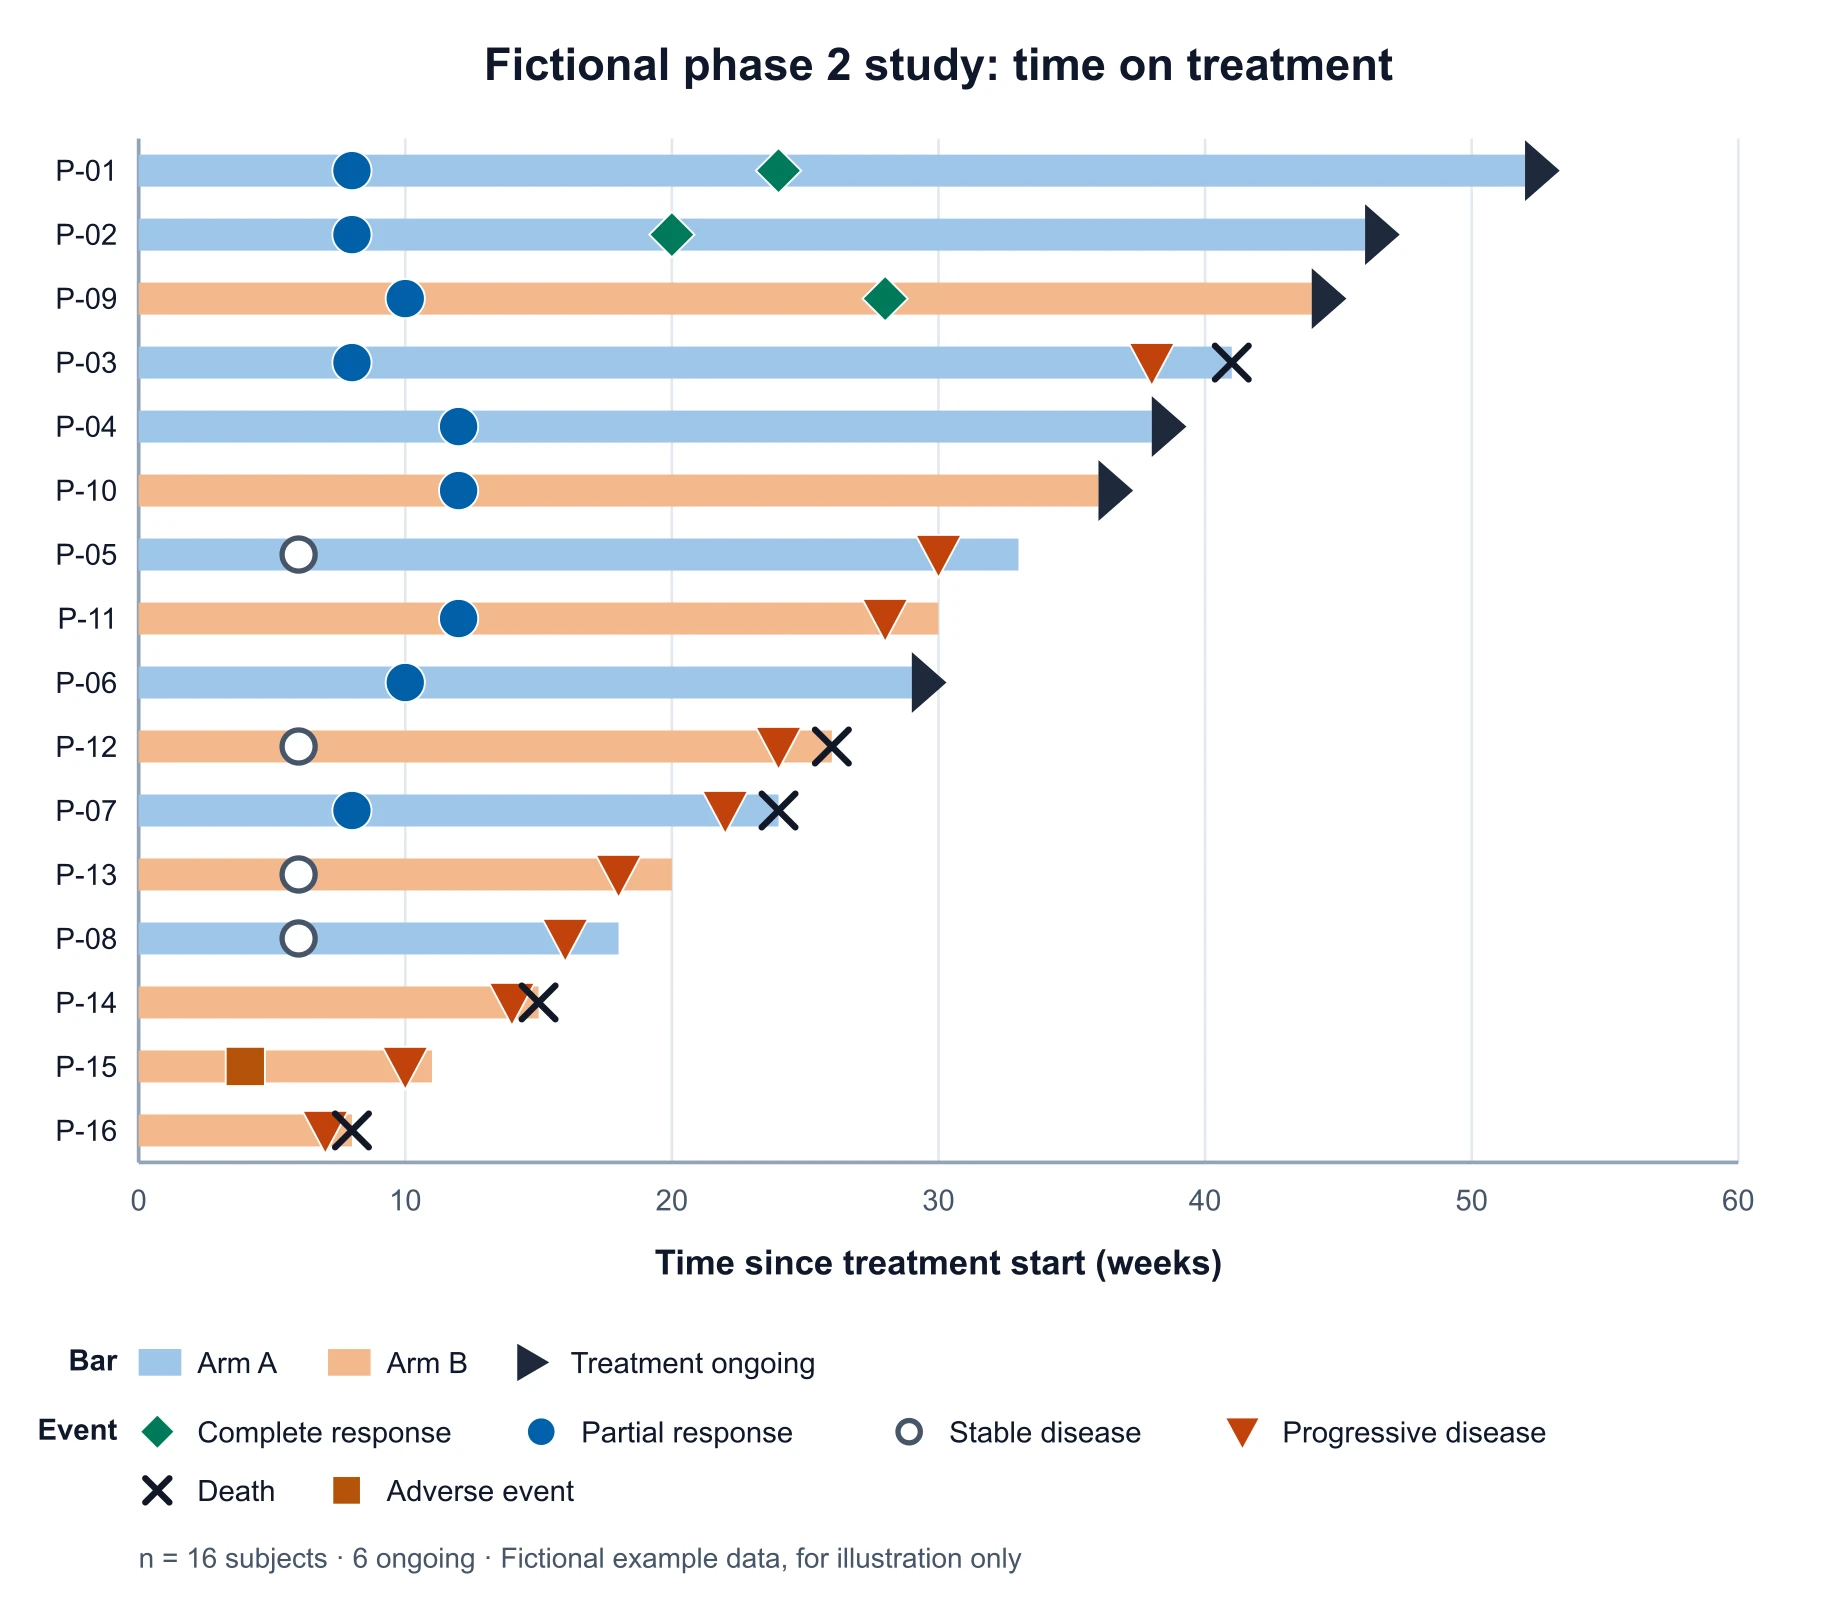 Swimmer Plot GeneratorMake a swimmer plot from a CSV of subjects: one bar per subject sorted by duration, response and progression markers, arrows for ongoing treatment, export SVG, PNG or CSV.
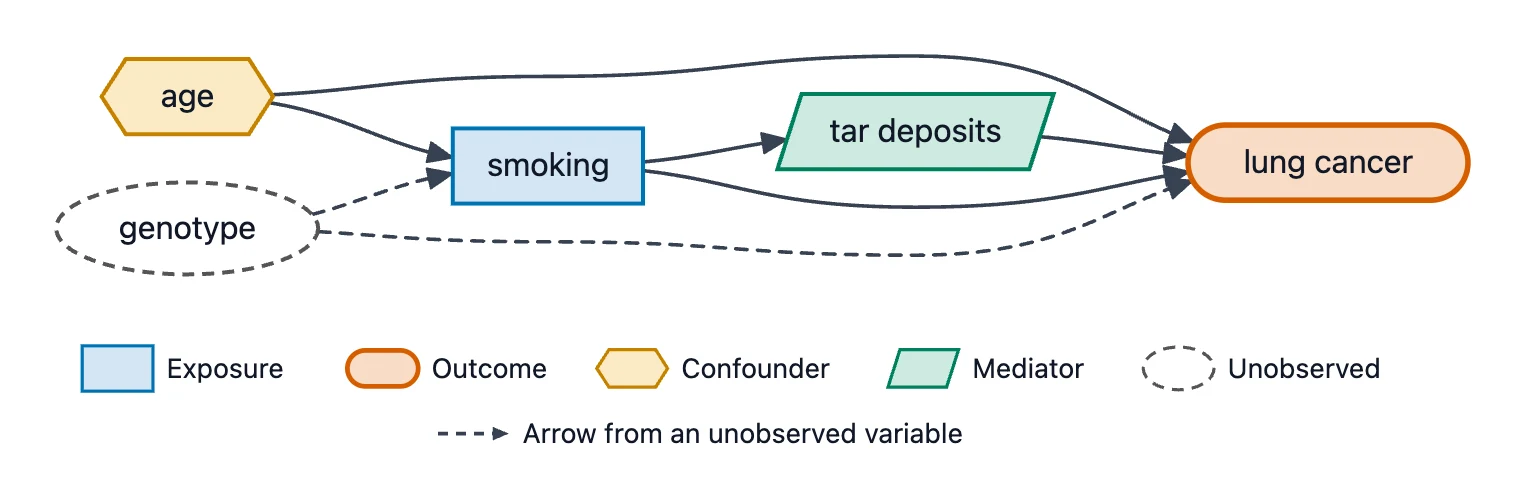 Causal Diagram (DAG) MakerType one arrow per line and get a clean causal DAG with exposure, outcome, confounder, mediator and collider styling.
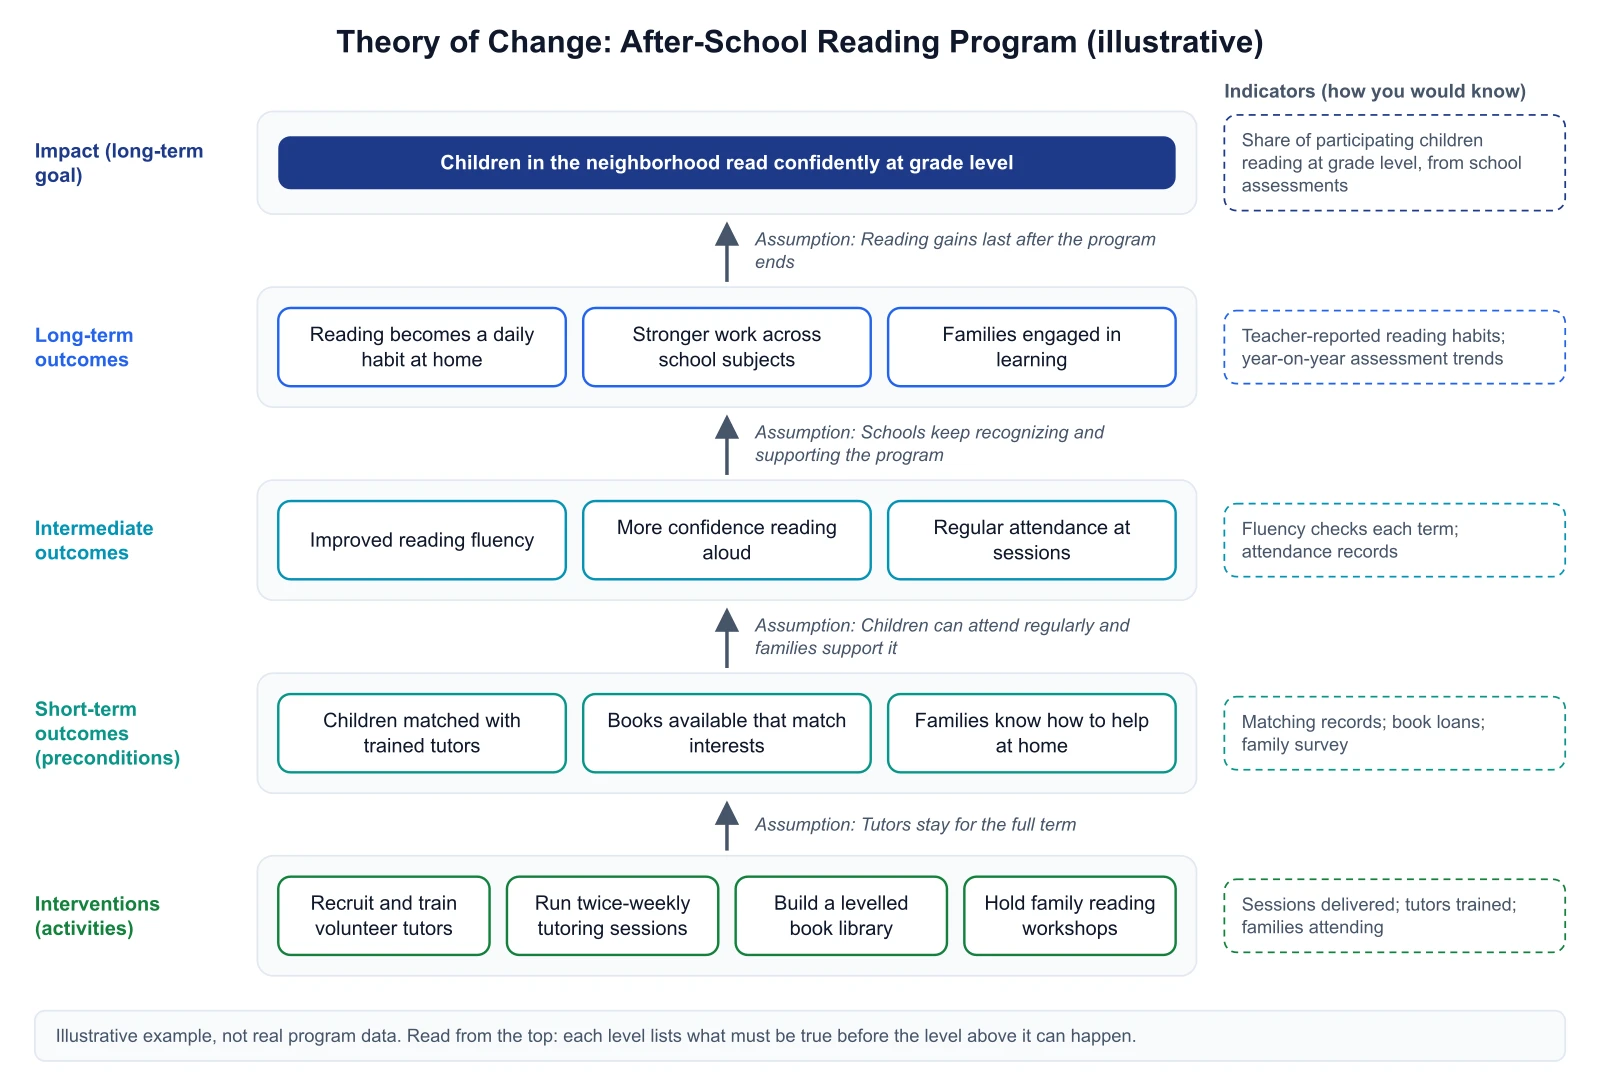 Theory of Change Diagram GeneratorMap a long-term goal back to its outcomes, interventions, assumptions and indicators in an editable theory of change diagram, export SVG or PNG.
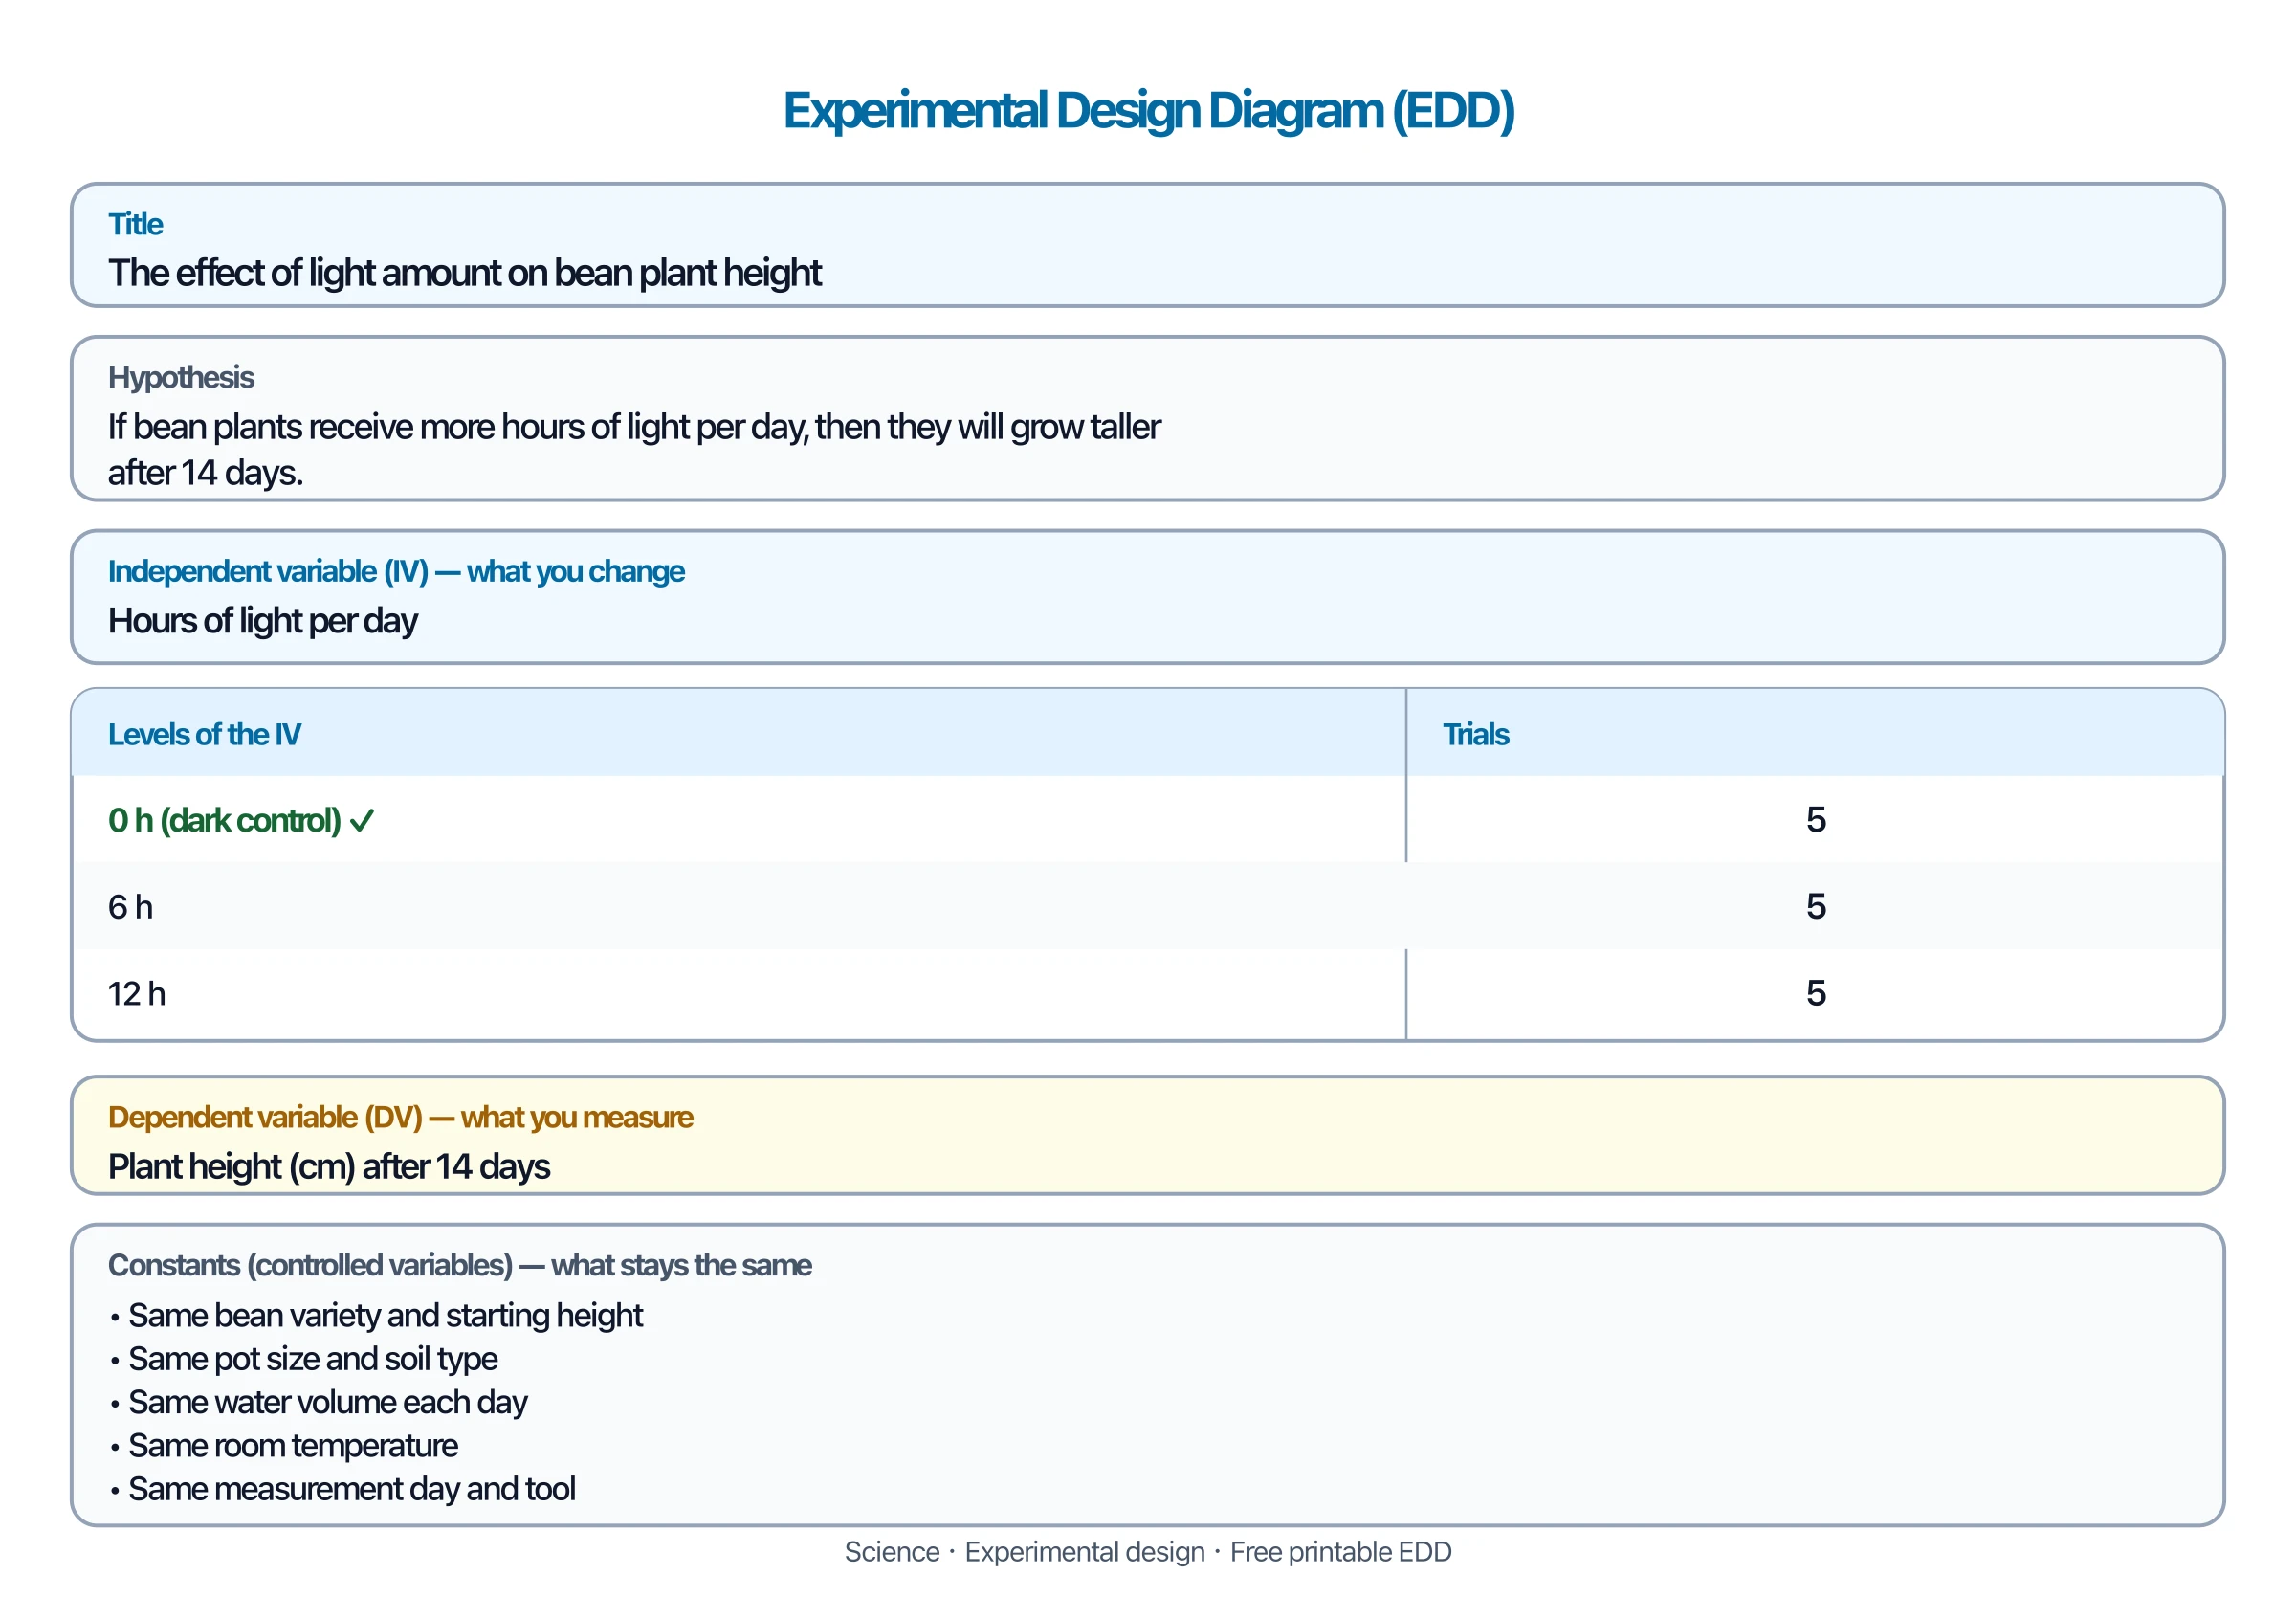 Experimental Design Diagram GeneratorBuild a science-fair Experimental Design Diagram (EDD) — IV levels, trials, DV, constants.
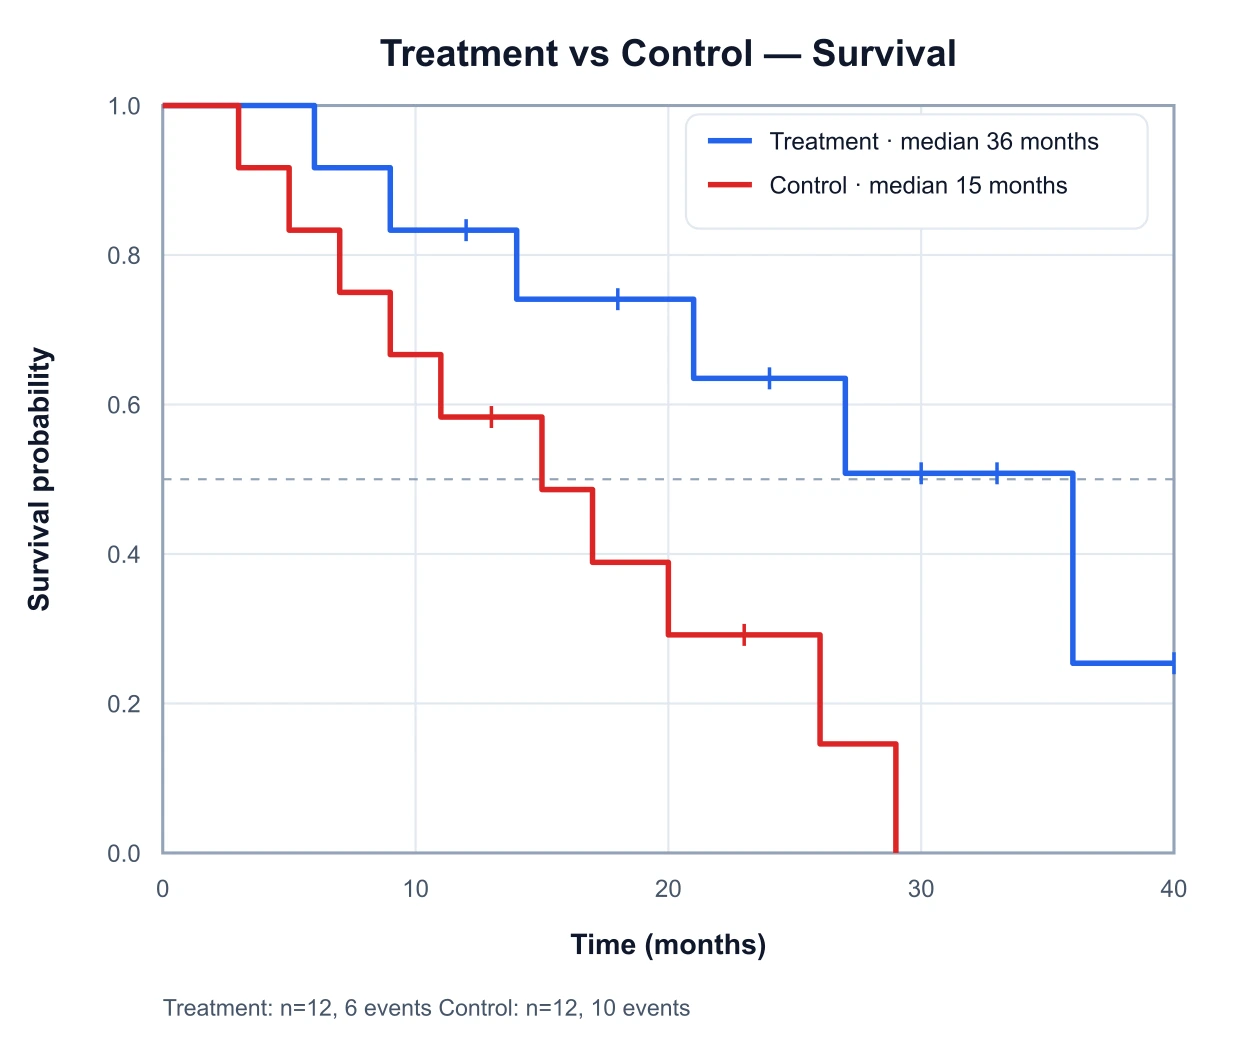 Kaplan–Meier GeneratorPlot a Kaplan–Meier survival curve from your event times — product-limit estimate with censoring marks, median survival, and group comparison, export SVG.
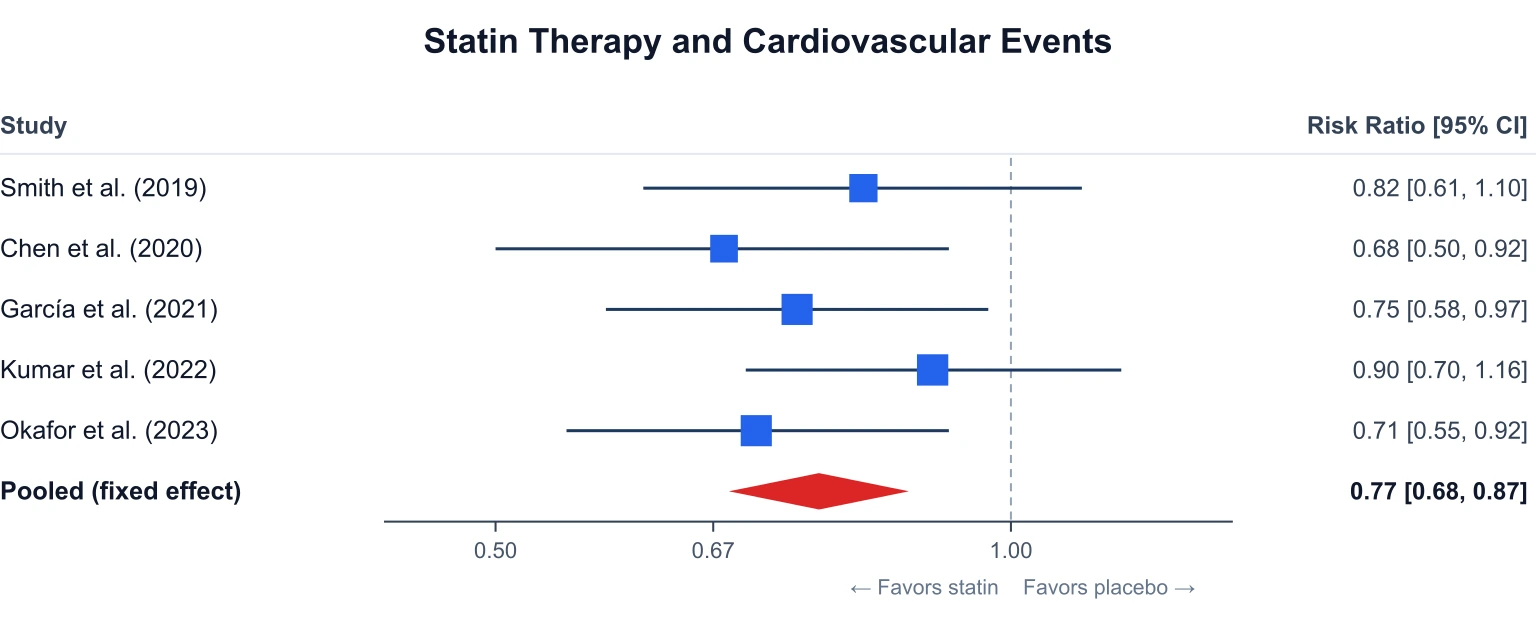 Forest Plot GeneratorCreate journal-style forest plots for meta-analysis — enter each study’s effect size and 95% CI, get weighted squares and a pooled diamond, export SVG.
Figure design and posters
Palettes and layouts that stay readable.
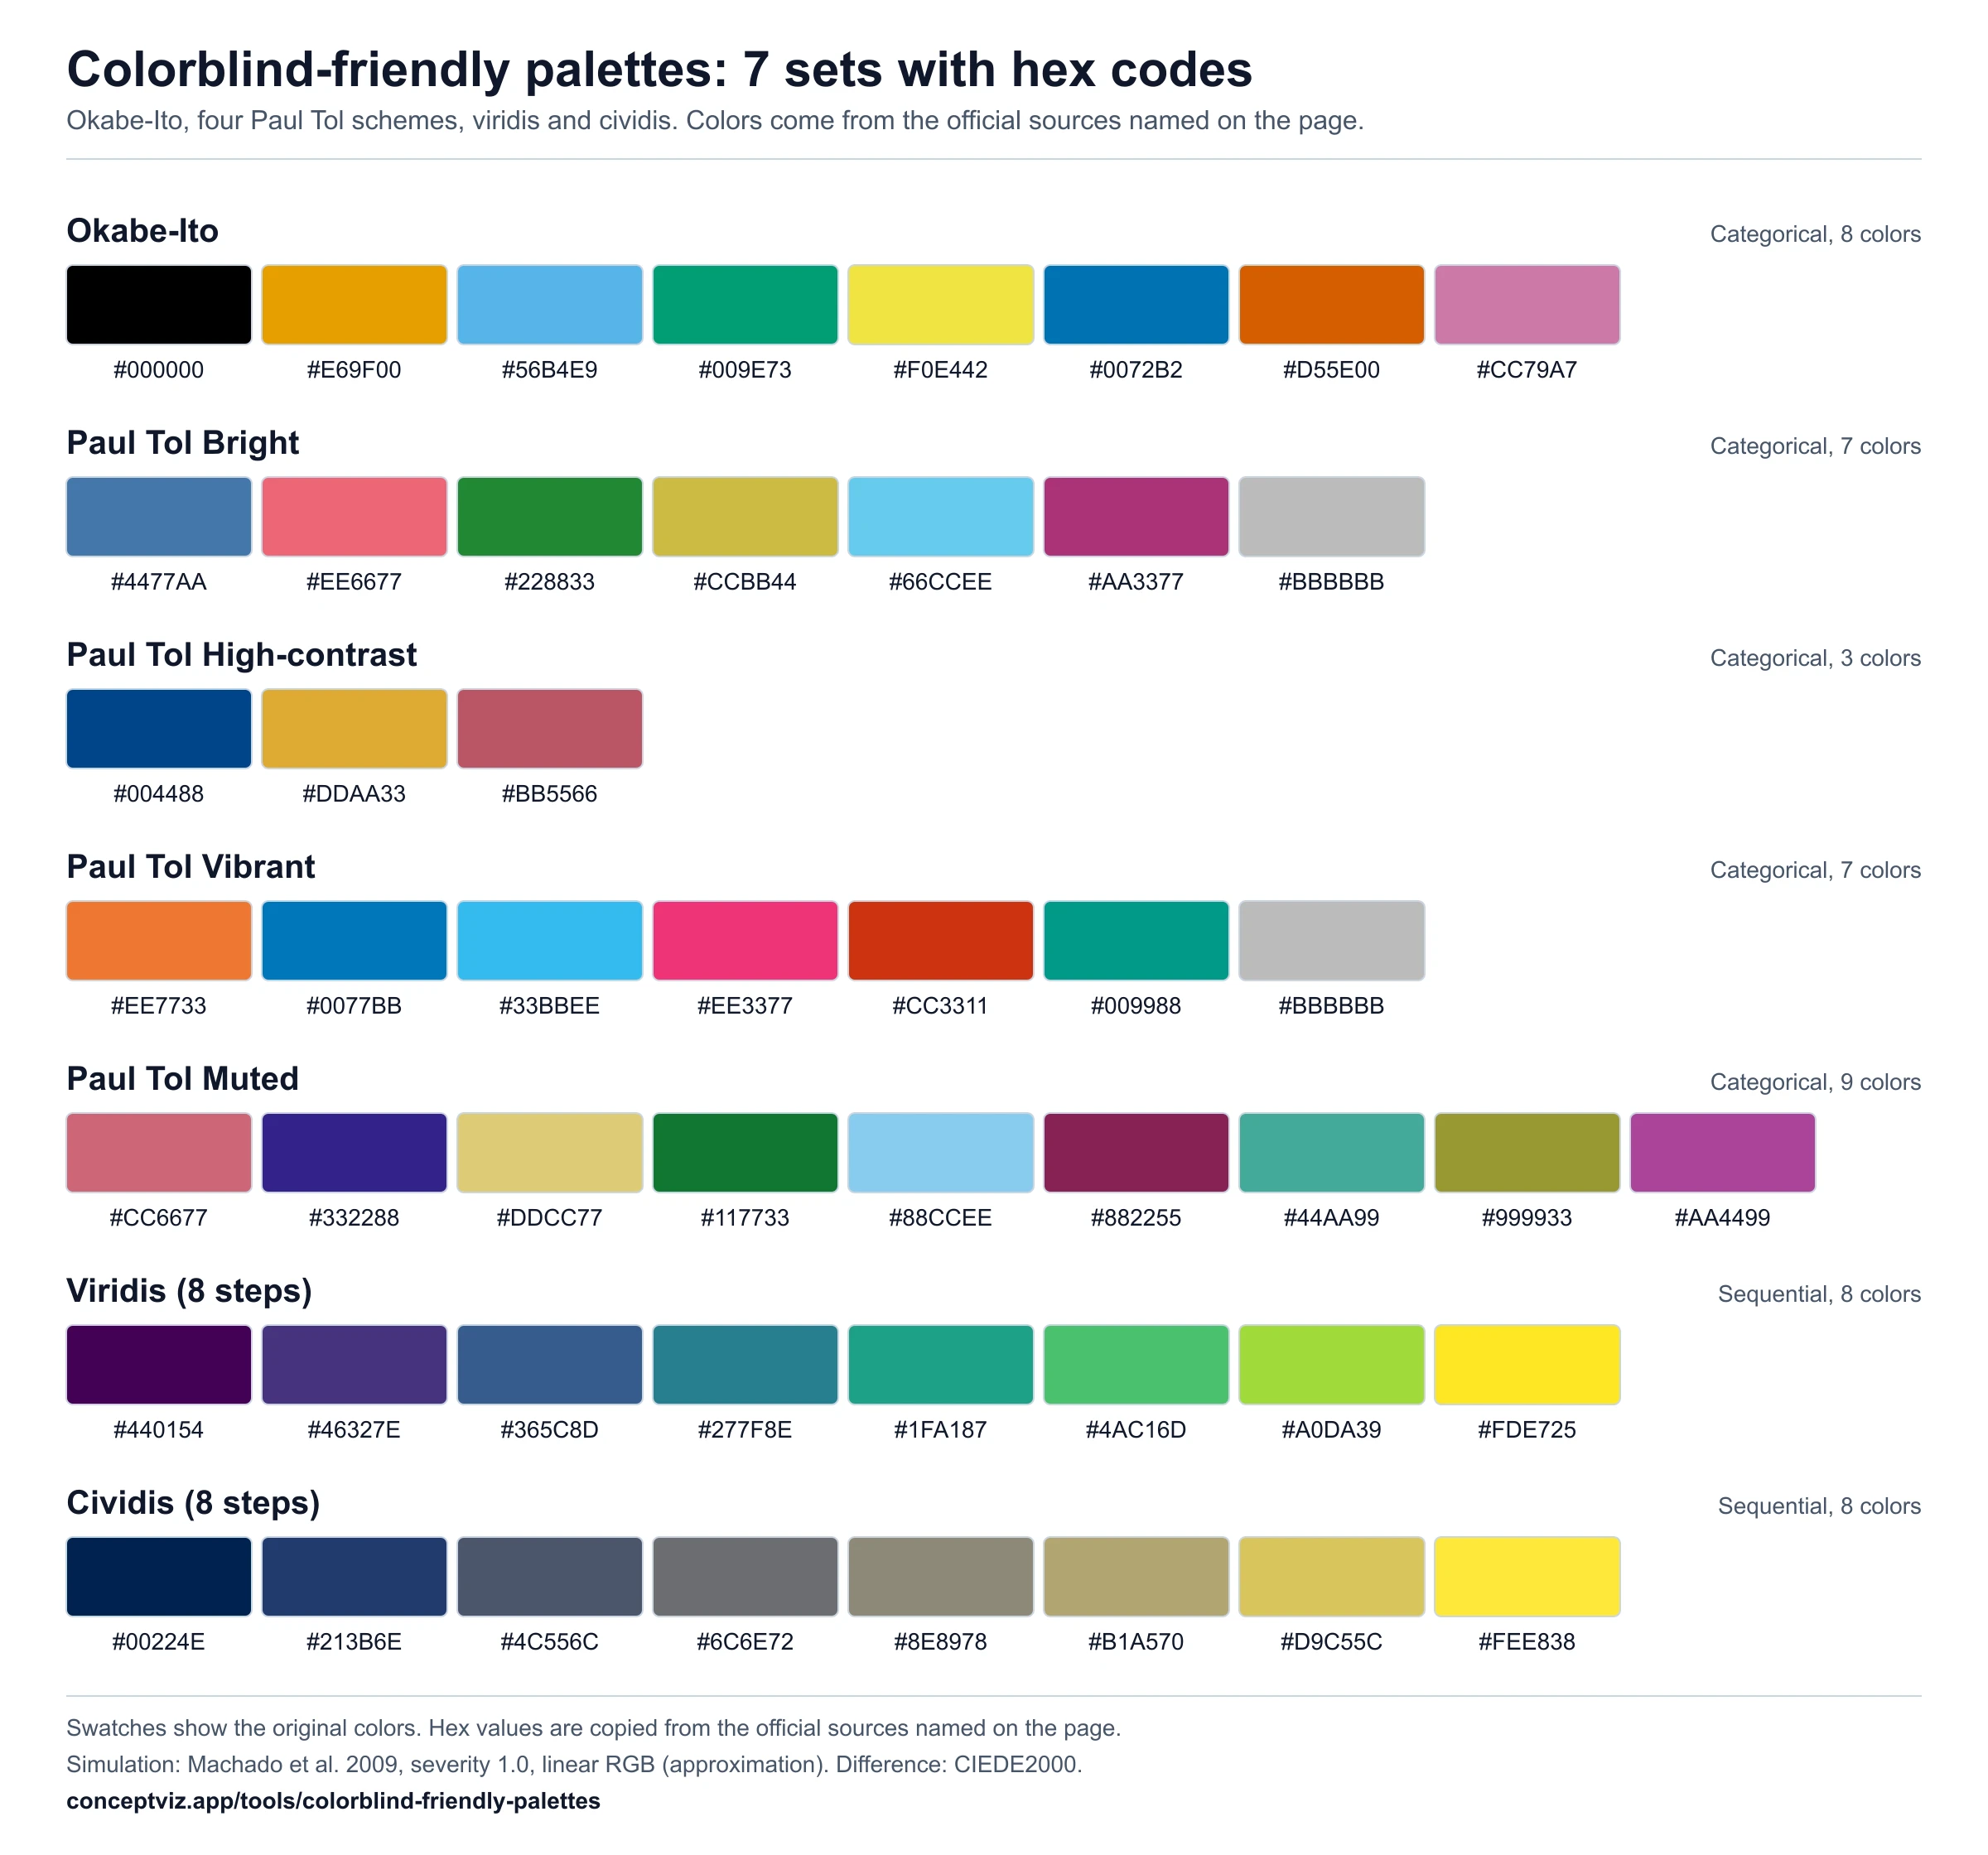 Colorblind Friendly PalettesColorblind friendly palettes with hex codes: Okabe-Ito, Paul Tol, viridis and cividis.
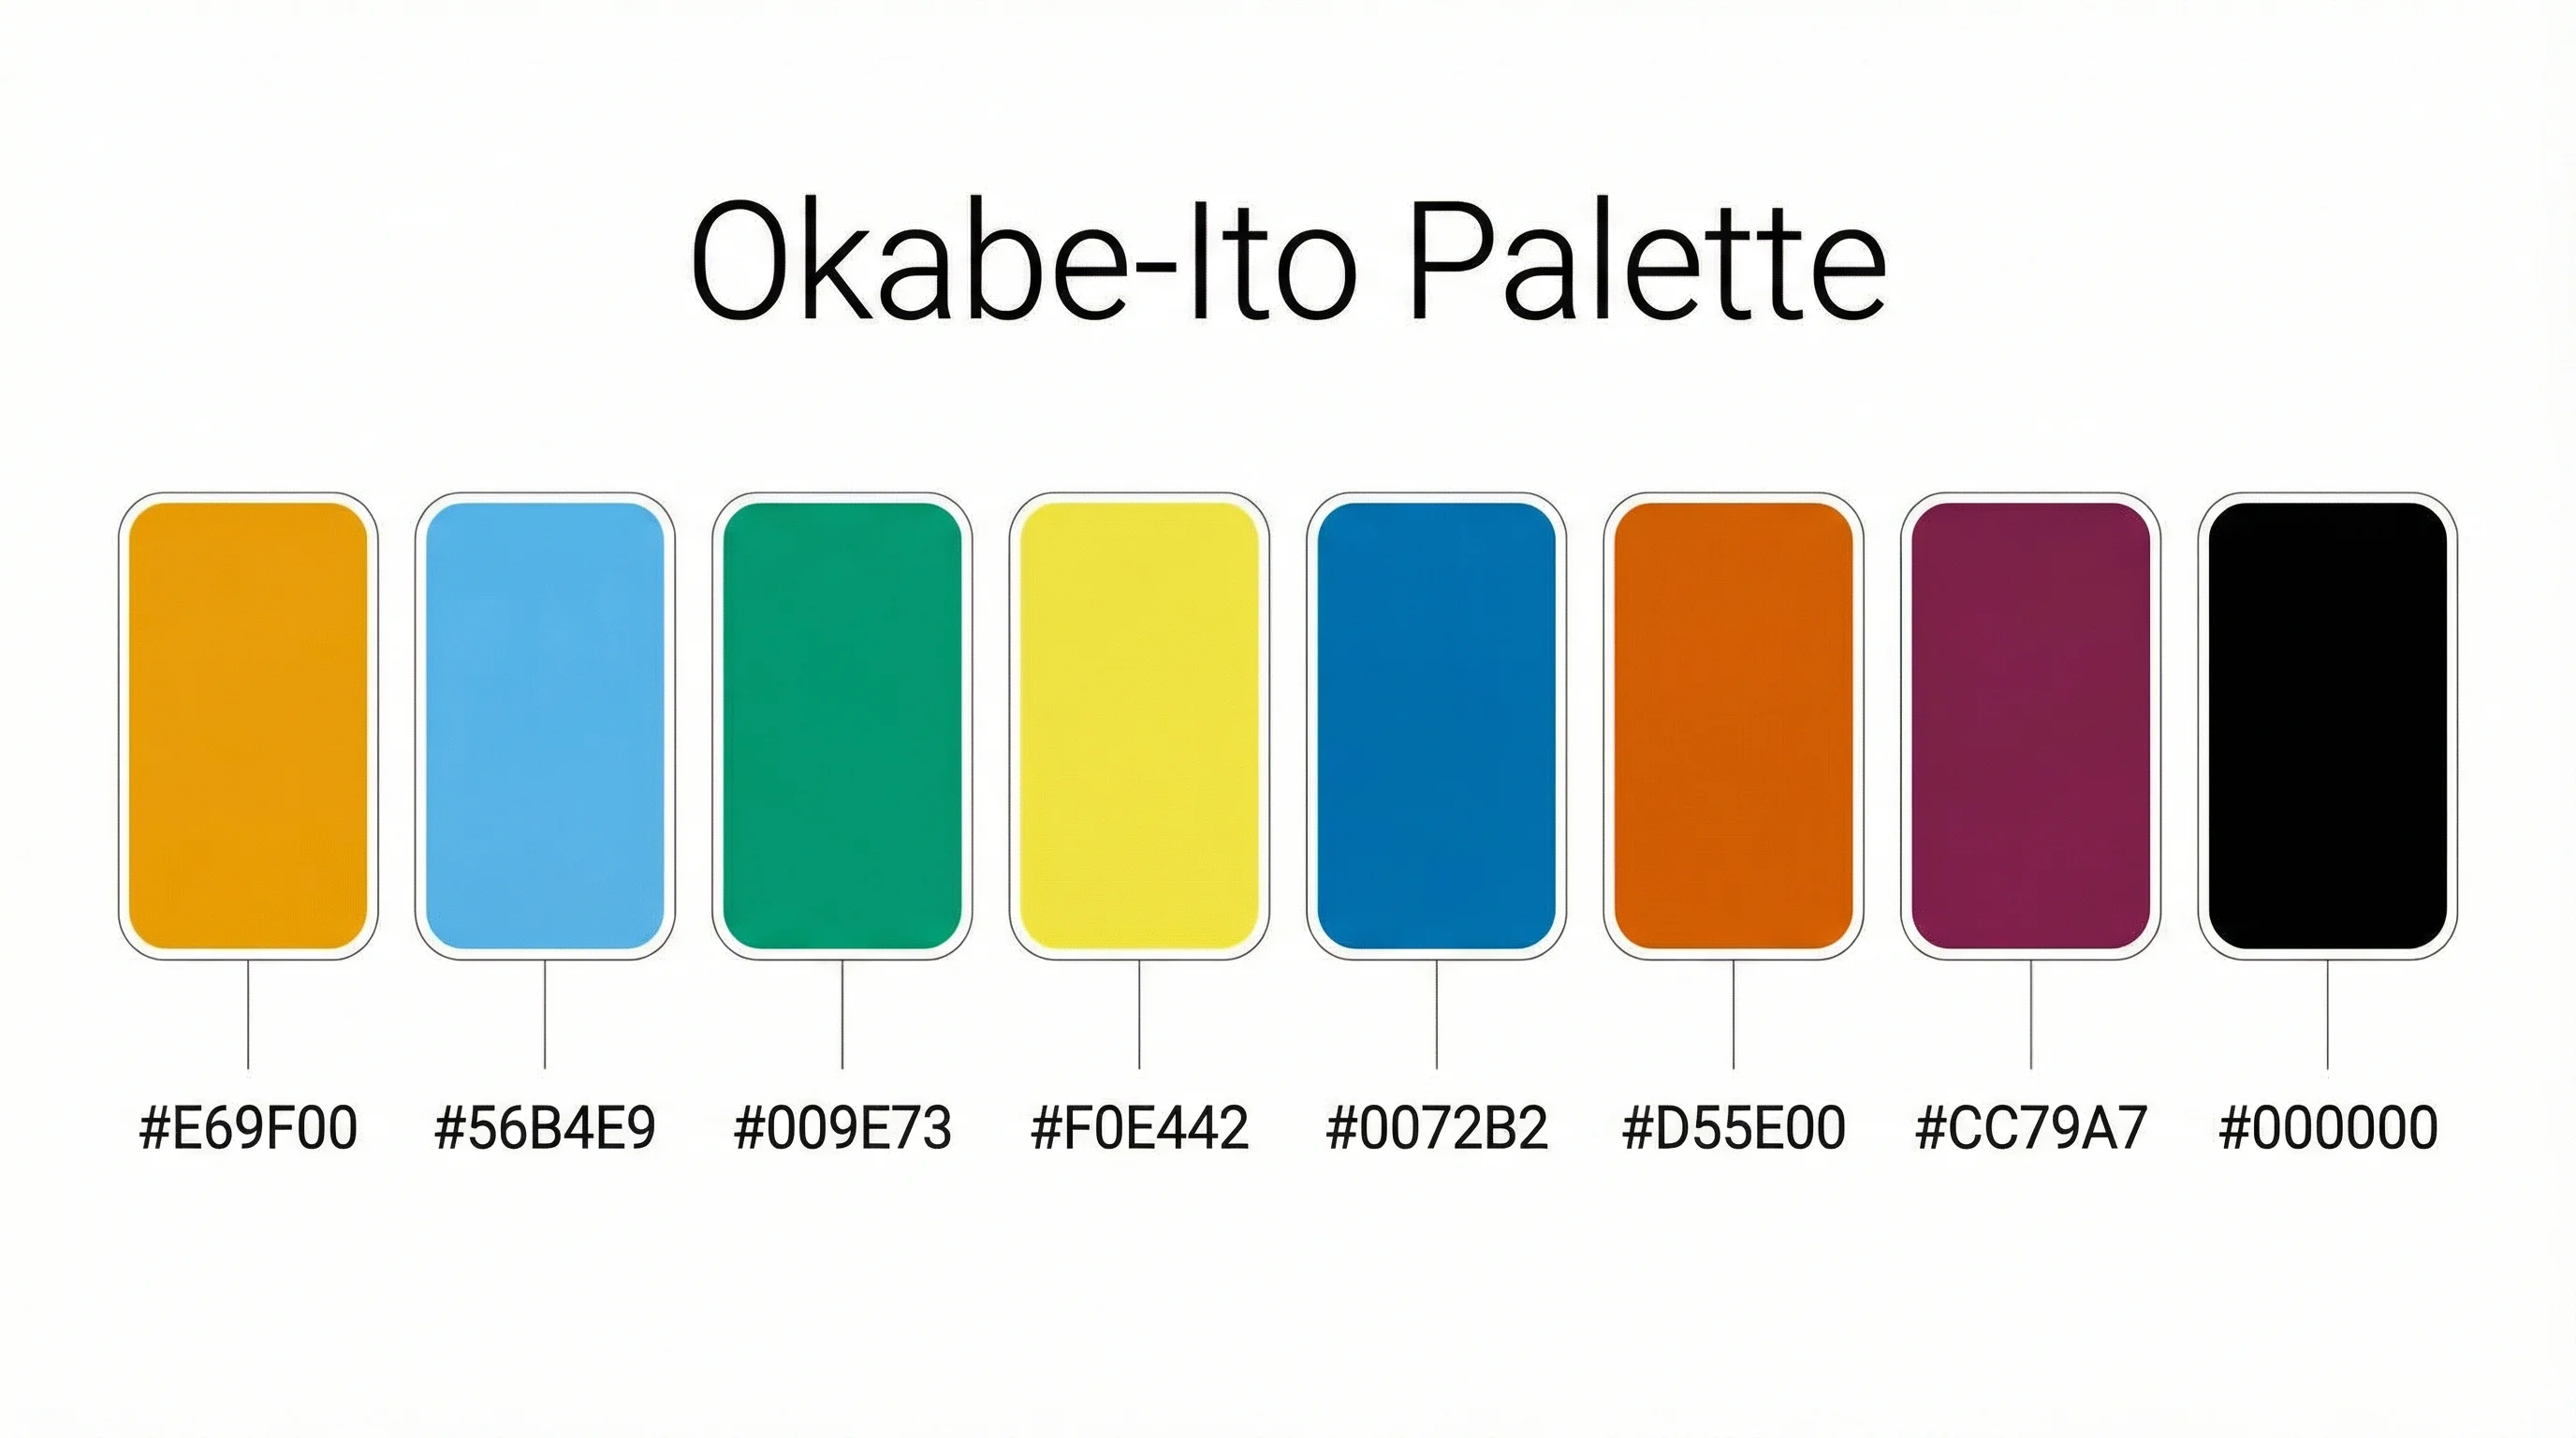 Scientific Color Palette GeneratorGenerate colorblind-friendly color palettes with hex codes.
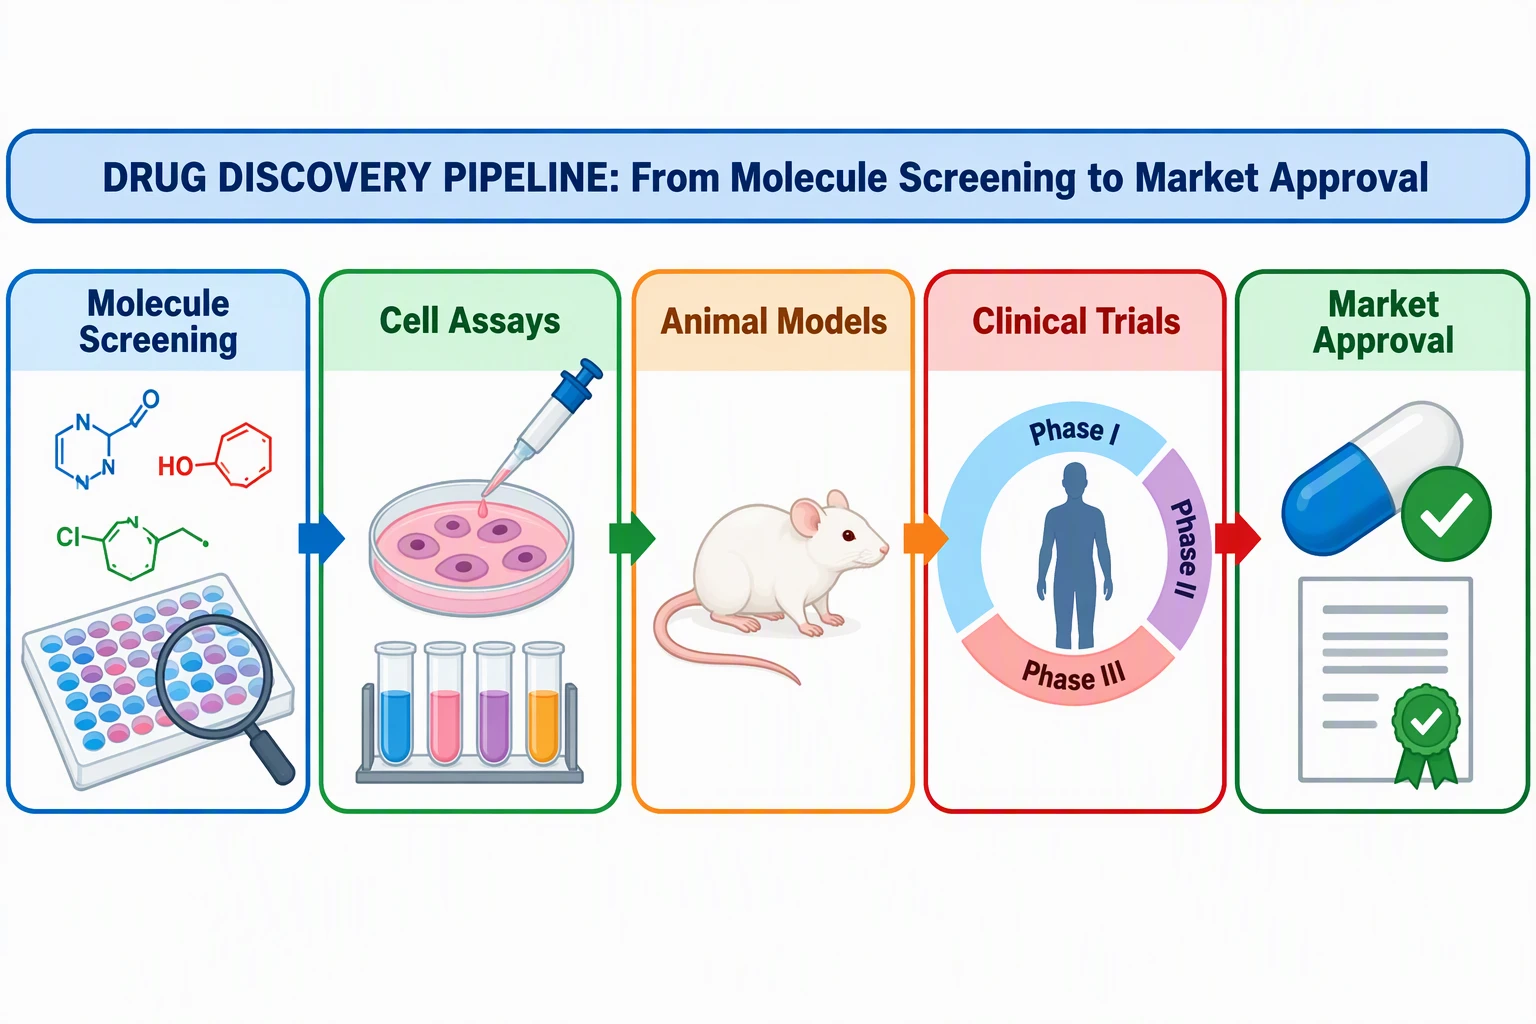 Graphical Abstract MakerDraft graphical abstract layouts from your study summary.
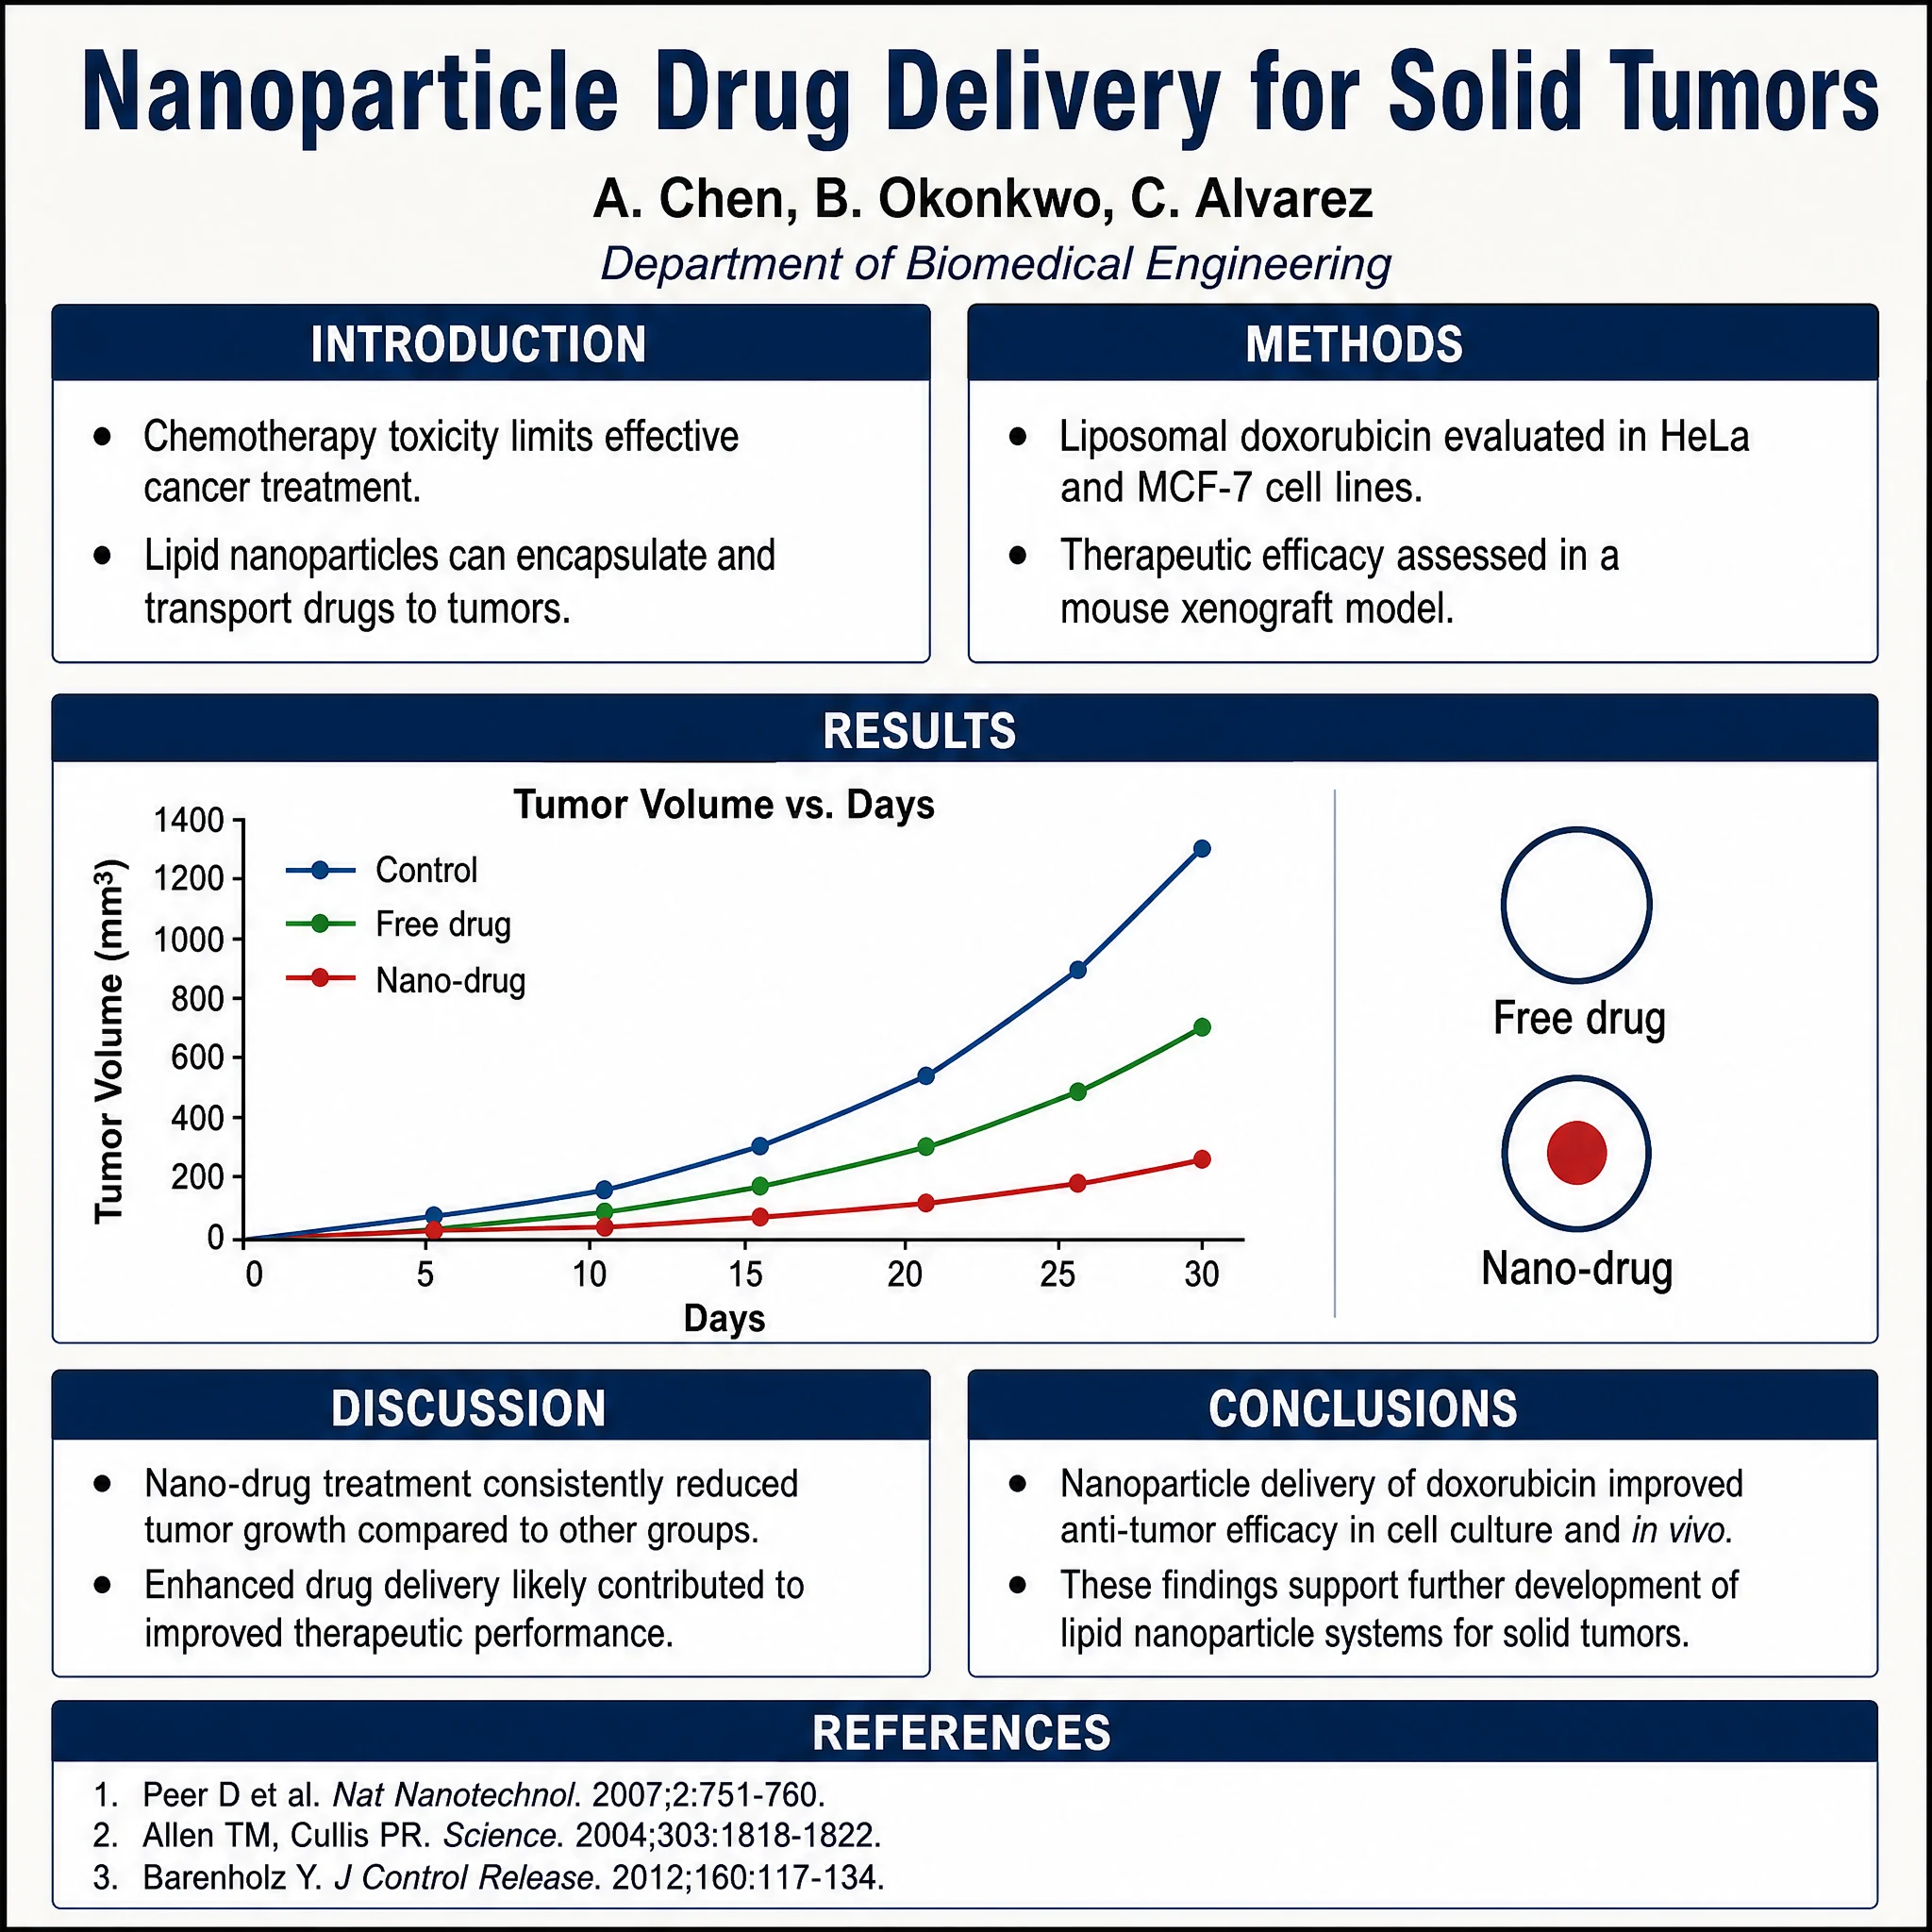 Scientific Poster GeneratorCreate professional scientific posters for conferences and symposiums.
Looking for something else? Browse all diagram and chart tools.