Theory of Change Diagram Generator
Free theory of change template and diagram generator: map your goal, outcomes, interventions, assumptions and indicators, then export SVG or PNG.
Examples are illustrative. Every item stays editable.
Theory of Change Diagram Examples
Exact engine renders of the example templates
Education Program Theory of Change
Exact engine render of the Education template. Illustrative example content, not real program data.
Public Health Theory of Change
Exact engine render of the Public health template. Illustrative example content, not real program data.
Community Development Theory of Change
Exact engine render of the Community development template. Illustrative example content, not real program data.
Research Project Theory of Change
Exact engine render of the Research funding template. Illustrative example content, not real project data.
Environmental Program Theory of Change
Exact engine render of the Environmental template. Illustrative example content, not real program data.
Theory of change examples
Five short examples, one per program type. Each matches a template button in the generator above, so you can load it, edit the items, and export it. The programs and pathways are illustrative, not real program data.
After-School Reading Program
Template button: Education program
- Impact (long-term goal)
- Children in the neighborhood read confidently at grade level
- Long-term outcomes
- Reading becomes a daily habit at home; Stronger work across school subjects; Families engaged in learning
- Intermediate outcomes
- Improved reading fluency; More confidence reading aloud; Regular attendance at sessions
- Short-term outcomes (preconditions)
- Children matched with trained tutors; Books available that match interests; Families know how to help at home
- Interventions (activities)
- Recruit and train volunteer tutors; Run twice-weekly tutoring sessions; Build a levelled book library; Hold family reading workshops
Community Heart-Health Program
Template button: Public health
- Impact (long-term goal)
- Fewer adults in the community develop preventable heart disease
- Long-term outcomes
- Healthy eating and activity as routine habits; Blood pressure managed in more adults
- Intermediate outcomes
- Residents set personal health goals; Adults get regular blood pressure checks; Local shops stock healthier options
- Short-term outcomes (preconditions)
- Residents know the main risk factors; Residents know where to get a free check; Partner clinics and shops agree to take part
- Interventions (activities)
- Train community health workers; Hold neighborhood check-up days; Run cooking and activity groups; Work with local shops on healthy stock
Neighborhood Economic Opportunity
Template button: Community development
- Impact (long-term goal)
- Residents have stable work and a stronger local economy
- Long-term outcomes
- Residents hold stable jobs or run small businesses; Local groups lead their own projects
- Intermediate outcomes
- Residents complete job training; New small businesses launch; Residents join local decision making
- Short-term outcomes (preconditions)
- Residents know about training and loan options; Trainers and mentors recruited; Employers agree to interview graduates
- Interventions (activities)
- Offer job-skills courses; Provide small business coaching; Host monthly community meetings; Connect residents with employers
Research Project for a Funder
Template button: Research funding
- Impact (long-term goal)
- Research findings change practice in the field
- Long-term outcomes
- Practitioners adopt the new approach; Follow-up studies build on the results
- Intermediate outcomes
- Results published and shared with practitioners; Partners help interpret the findings; Early-career researchers trained
- Short-term outcomes (preconditions)
- Study protocol approved; Participants recruited; Data collected and analyzed
- Interventions (activities)
- Secure funding and ethics approval; Run the study; Co-design sharing plans with partners; Train research assistants
Watershed Restoration
Template button: Environmental program
- Impact (long-term goal)
- A healthy river that supports wildlife and the community
- Long-term outcomes
- Water quality meets local targets; Native habitat recovers along the banks
- Intermediate outcomes
- Less runoff reaches the river; Buffer plantings establish; Landowners manage land differently
- Short-term outcomes (preconditions)
- Landowners understand the benefits; Volunteers trained to plant and monitor; Planting sites agreed and permitted
- Interventions (activities)
- Meet landowners one to one; Plant native buffer strips; Train volunteer monitors; Share monitoring results publicly
Theory of change template (Word, PowerPoint, Google Slides)
Most theory of change templates are blank Word, PowerPoint, or slide files that you fill in box by box. This page works the other way: choose Blank template or one of the five examples, type your own items, and the diagram redraws as you go. When it is done, click Download SVG or Download PNG and insert the picture into your document or slides. On a phone or tablet, the View image button also saves a PNG. The tool does not produce .docx or .pptx files; if your funder gives you its own template file, copy your items into that.
Level names differ between organizations. The templates use Impact, Long-term outcomes, Intermediate outcomes, Short-term outcomes, and Interventions. Rename any of them to match what your funder or team uses, and follow your funder's instructions if they describe a required layout.
Theory of change vs logic model
A theory of change starts from the goal and works backwards, with the assumptions written out. A logic model runs left to right from inputs to impact and describes how one program operates. If a funder asks for a logic model, use the logic model generator; for the variables behind a research study, use the conceptual framework generator.
What is a theory of change?
A theory of change explains how and why a change is expected to happen. You start from the long-term goal, then work backwards: which outcomes must exist just before it, what must be true before those, and which interventions can start the chain. Each step up rests on assumptions, and a good diagram also names the indicators you would check along the way. Teams use theory of change diagrams in funding applications, program design, and evaluation because the whole argument fits on one page, where a reader can question each link. This page draws the diagram for you: edit the levels on the left and the SVG redraws on the right. It lays out the pathway you write. It cannot tell you whether the pathway is true.
Components of a theory of change diagram
- Impact (long-term goal): the lasting change you are working toward, and for whom.
- Long-term outcomes: the changes that must be in place for the goal to become possible.
- Intermediate outcomes: changes in behavior, practice, or conditions that come before those.
- Short-term outcomes (preconditions): changes in knowledge, access, or readiness that must exist first.
- Interventions: the activities and services that start the chain.
- Assumptions: what must hold for each step up, written beside the arrow.
- Indicators: the evidence you would look for at each level.
- Rationale: why you believe the pathway works, from experience, evidence, or research.
How to build a theory of change by backwards mapping
- Write the impact as one sentence that names the change and who it is for.
- Ask what must be true just before the goal, and list those long-term outcomes in the tier below it.
- Repeat the question for each tier until you reach changes your program can influence directly.
- Add the interventions that produce those earliest outcomes.
- Write the assumption behind each step up. These are the links a reviewer is most likely to question.
- Add an indicator for each level, then note your rationale and download the diagram.
Frequently Asked Questions
Related Research Tools
 Research
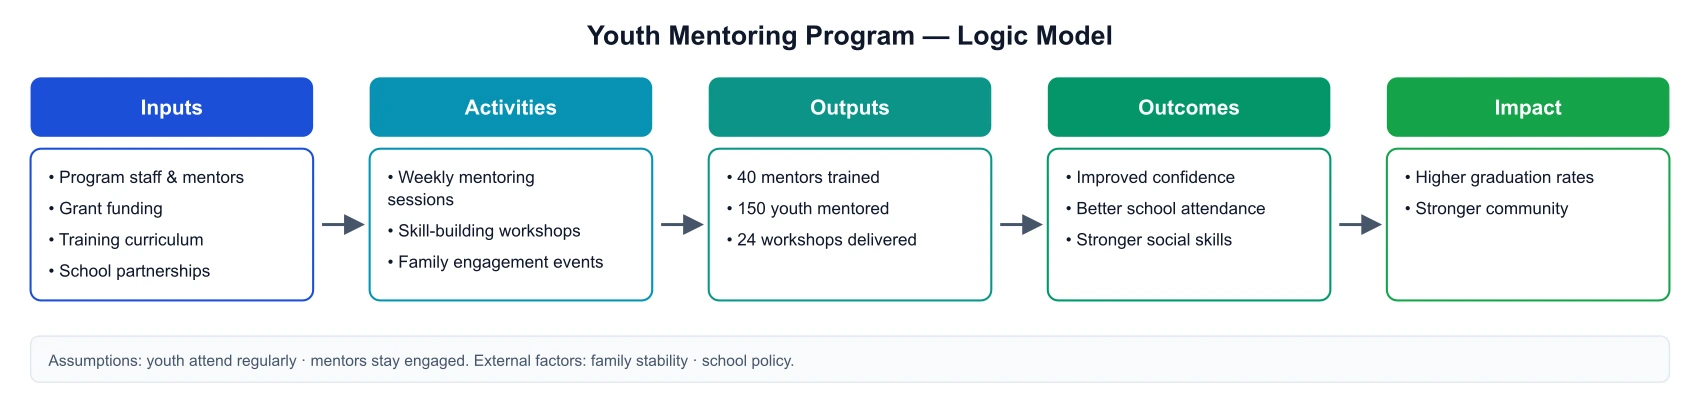
Logic Model Generator
Map inputs, activities, outputs, outcomes and impact into an editable logic model.
 Research
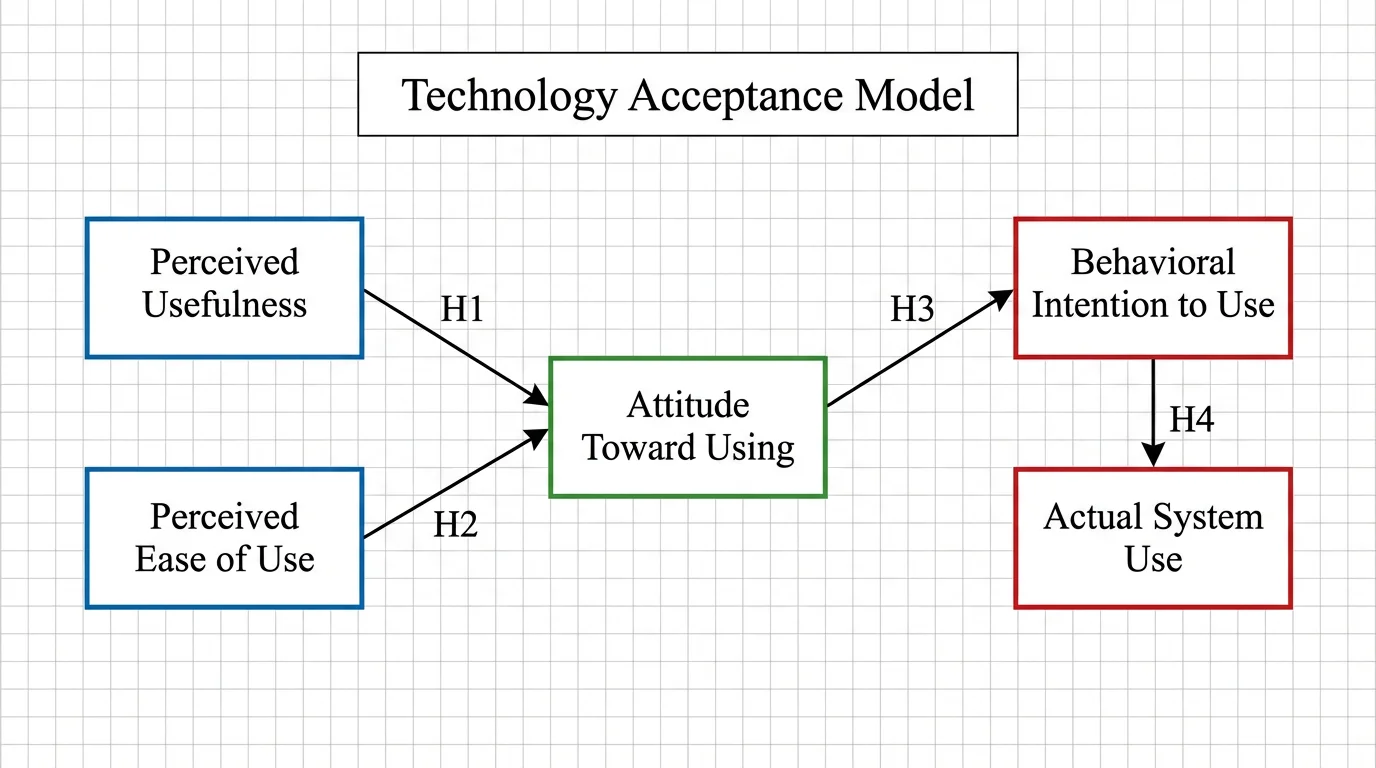
Conceptual Framework Generator
Diagram the variables and relationships behind your study or thesis.
 Research
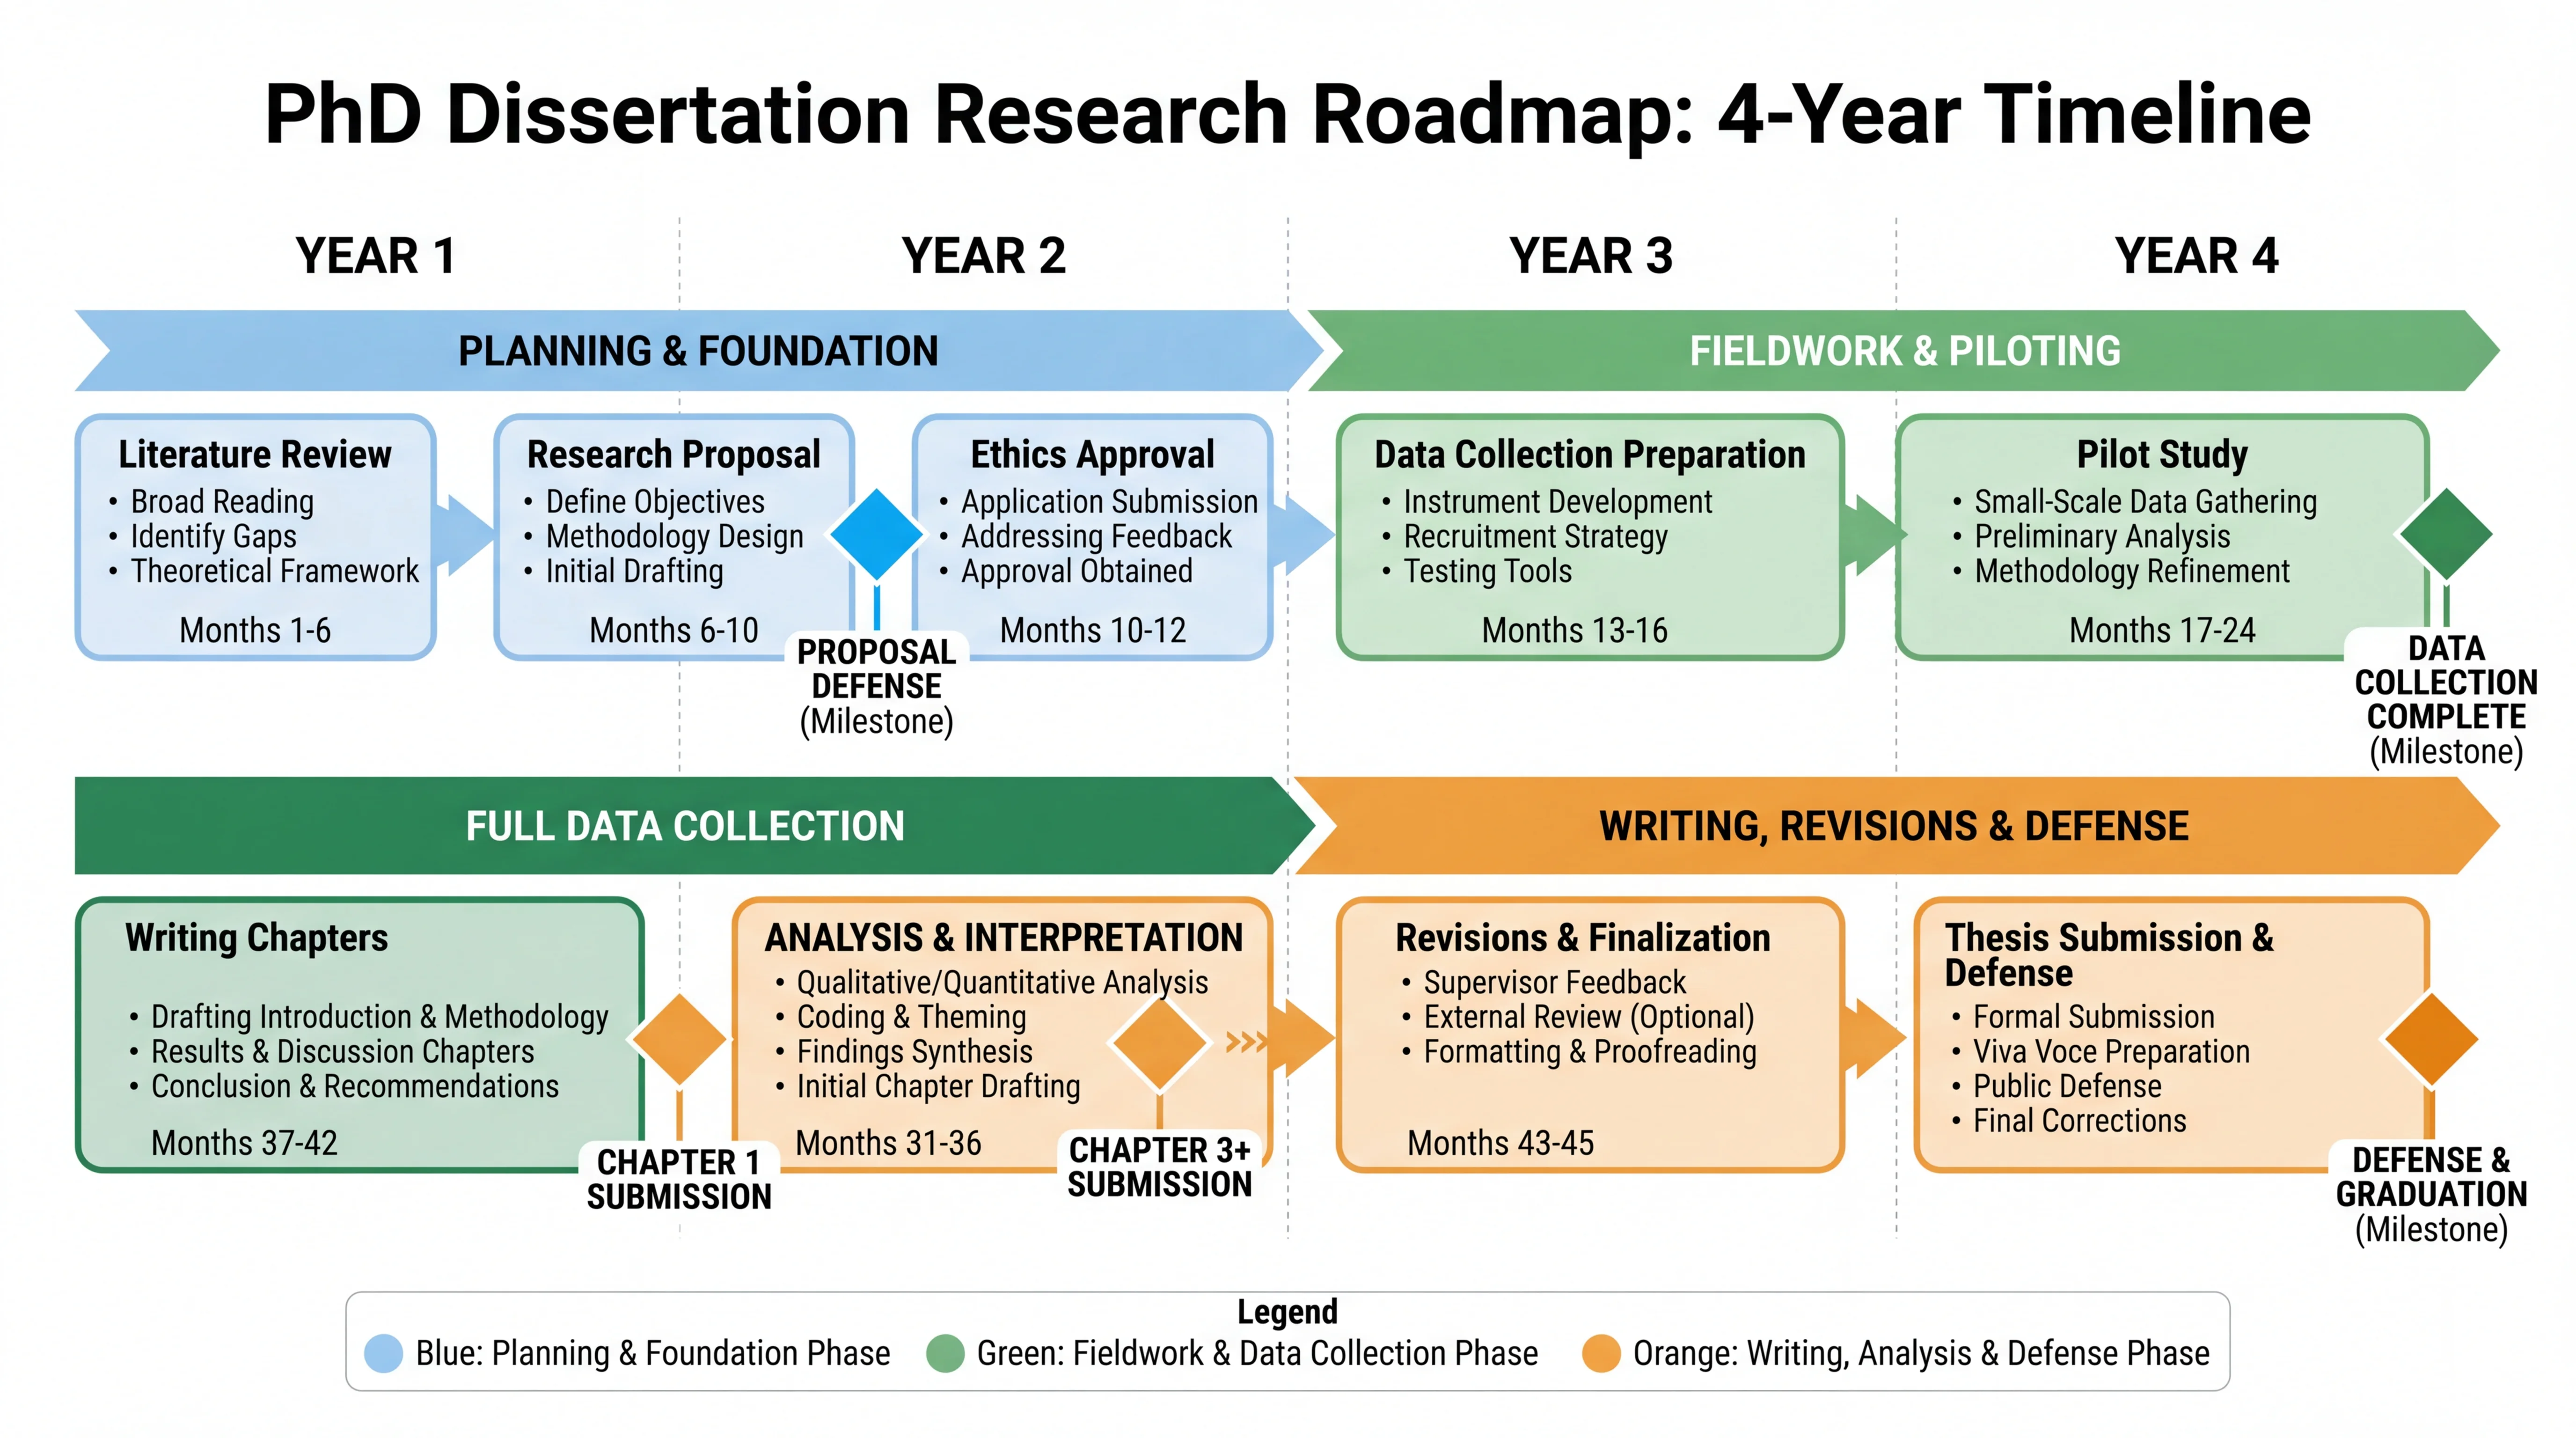
 Roadmap Maker
Lay out the phases, milestones, and timeline of a research project.
 Research
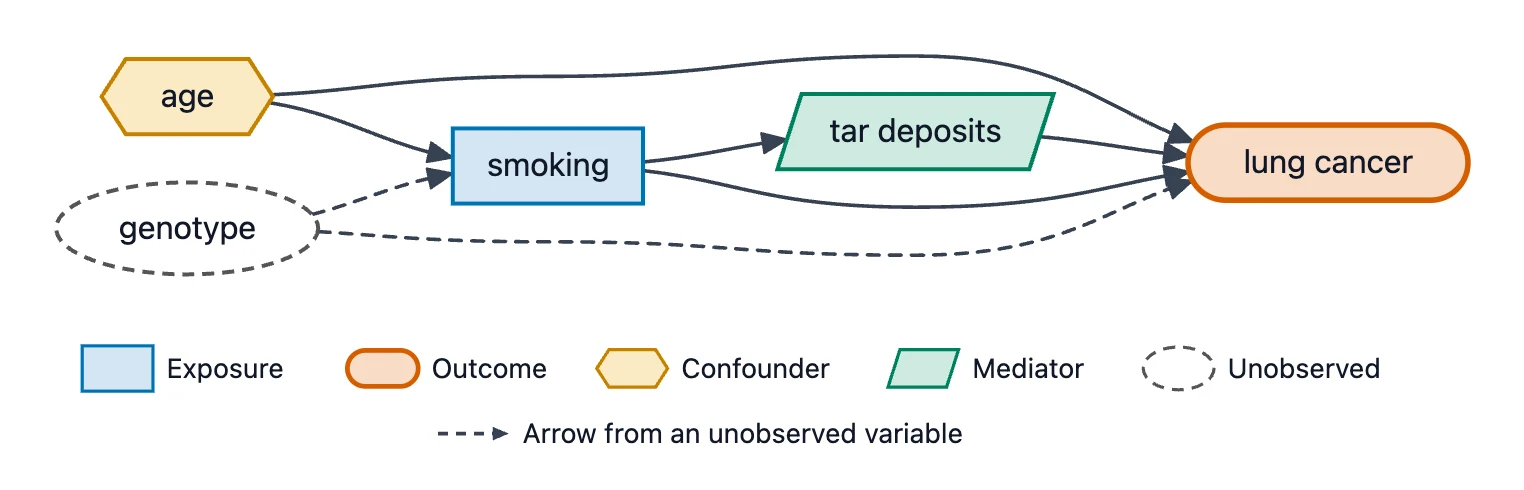
Causal Diagram (DAG) Maker
Draw a causal diagram with confounders, mediators and colliders.
 Research
Graphical Abstract Maker
Summarize your paper or project in one clear figure.
 Research
Scientific Poster Generator
Lay out a conference research poster with your figures and sections.