Gel Electrophoresis Diagram Generator for DNA and SDS-PAGE
Free gel electrophoresis diagram generator. Paste DNA or protein fragment sizes to draw an exact gel and download SVG.
Paste lanes and fragment sizes — renders an exact gel as SVG, free
Lane table
lane, sample name, fragment sizes in bp. Separate sizes with | or spaces.
5 lanes · 14 bands
Gel Electrophoresis Diagram Generator
Free to try ·
Your AI gel electrophoresis illustration will appear here
For a data-accurate gel from fragment sizes, use the Precise Gel tab instead
Gel Electrophoresis Examples
The first four are exact engine renders from lane tables. The last two are AI illustrations of Illustration mode.
Plasmid digest
Exact engine render — smaller fragments sit farther from the wells, toward the anode.
PCR product
Exact engine render — 850 bp lands between the 1 kb and 500 bp markers.
SDS-PAGE
Exact engine render — same log-size layout, units switched to kDa.
Light teaching gel
Exact engine render — inverted style for worksheets that print in black and white.
AI illustration — apparatus
AI illustration of Illustration mode — apparatus schematic, not plotted from sizes.
AI illustration — stained gel
AI illustration of Illustration mode — visual mockup, not a data-accurate gel.
What is a gel electrophoresis diagram?
Gel electrophoresis separates DNA, RNA, or proteins by size in an electric field. Samples are loaded into wells at the cathode (negative, black). Nucleic acids and SDS-coated proteins are negatively charged, so they run toward the anode (positive, red). Smaller fragments travel farther through the gel matrix. This generator draws that result as an exact SVG from a lane table — not a photo of a real gel, and not a street map. For a labeled drawing of the gel box, power supply, and buffer tank, use Illustration mode or the schematic diagram maker.
What table to paste
- Each row is a lane. You need a size column (bp, kDa, or a list of fragment sizes). A lane number and sample name are optional.
- Put several sizes in one cell with | or spaces (850|5400), or use one row per band with the same lane number.
- A lane named ladder or marker is treated as a size standard and labeled on the left.
- Switch units to kDa for SDS-PAGE. The plot uses a log-size scale — the usual teaching and figure approximation — and does not simulate a specific agarose percentage.
How to read the gel
- Wells sit at the top (cathode). DNA and SDS-PAGE proteins run down toward the anode.
- Compare a sample band to the ladder: a PCR product between the 1000 bp and 500 bp marks is about 850 bp in the sample table.
- An empty lane is a negative control. A single high band in an “uncut plasmid” lane is typical of supercoiled or circular DNA drawn at the size you typed — this tool does not model topology.
- The red + and black − labels are teaching marks. Real boxes use red for the anode and black for the cathode.
Agarose gels and SDS-PAGE
Agarose gels are the standard DNA/RNA figure. SDS-PAGE is the protein version: SDS gives polypeptides a similar charge-to-mass ratio, so they also separate by size, usually reported in kDa. Both belong on this page. A western blot is a later transfer-and-antibody step, not the gel itself. Pair a result gel with a PCR or cloning schematic and a DNA structure diagram if you are writing a methods figure.
Export
Download a scalable SVG with no watermark and no account required for the precise gel. Open it in Illustrator, Inkscape, PowerPoint, or a lab report. The AI Illustration tab is only for apparatus drawings and stained-gel mockups when you do not have fragment sizes yet.
Frequently Asked Questions
Related Research Tools
 Biology
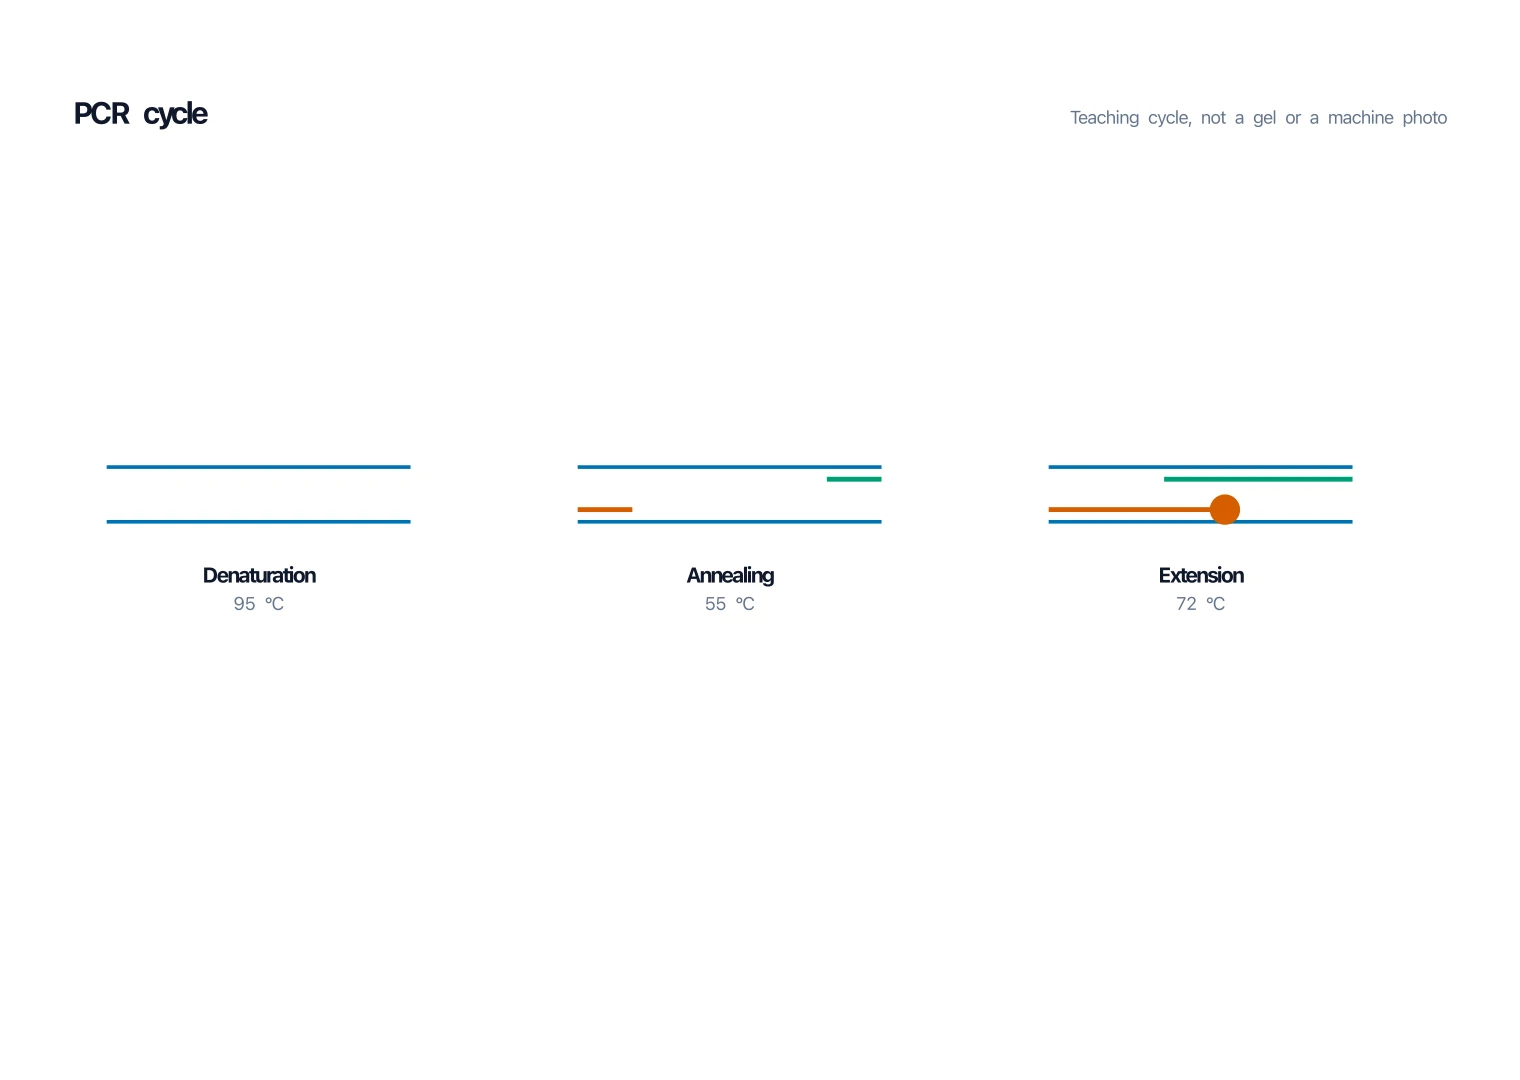
PCR Diagram Generator
The cycle that made the band — denature, anneal, extend, not the gel.
 Biology
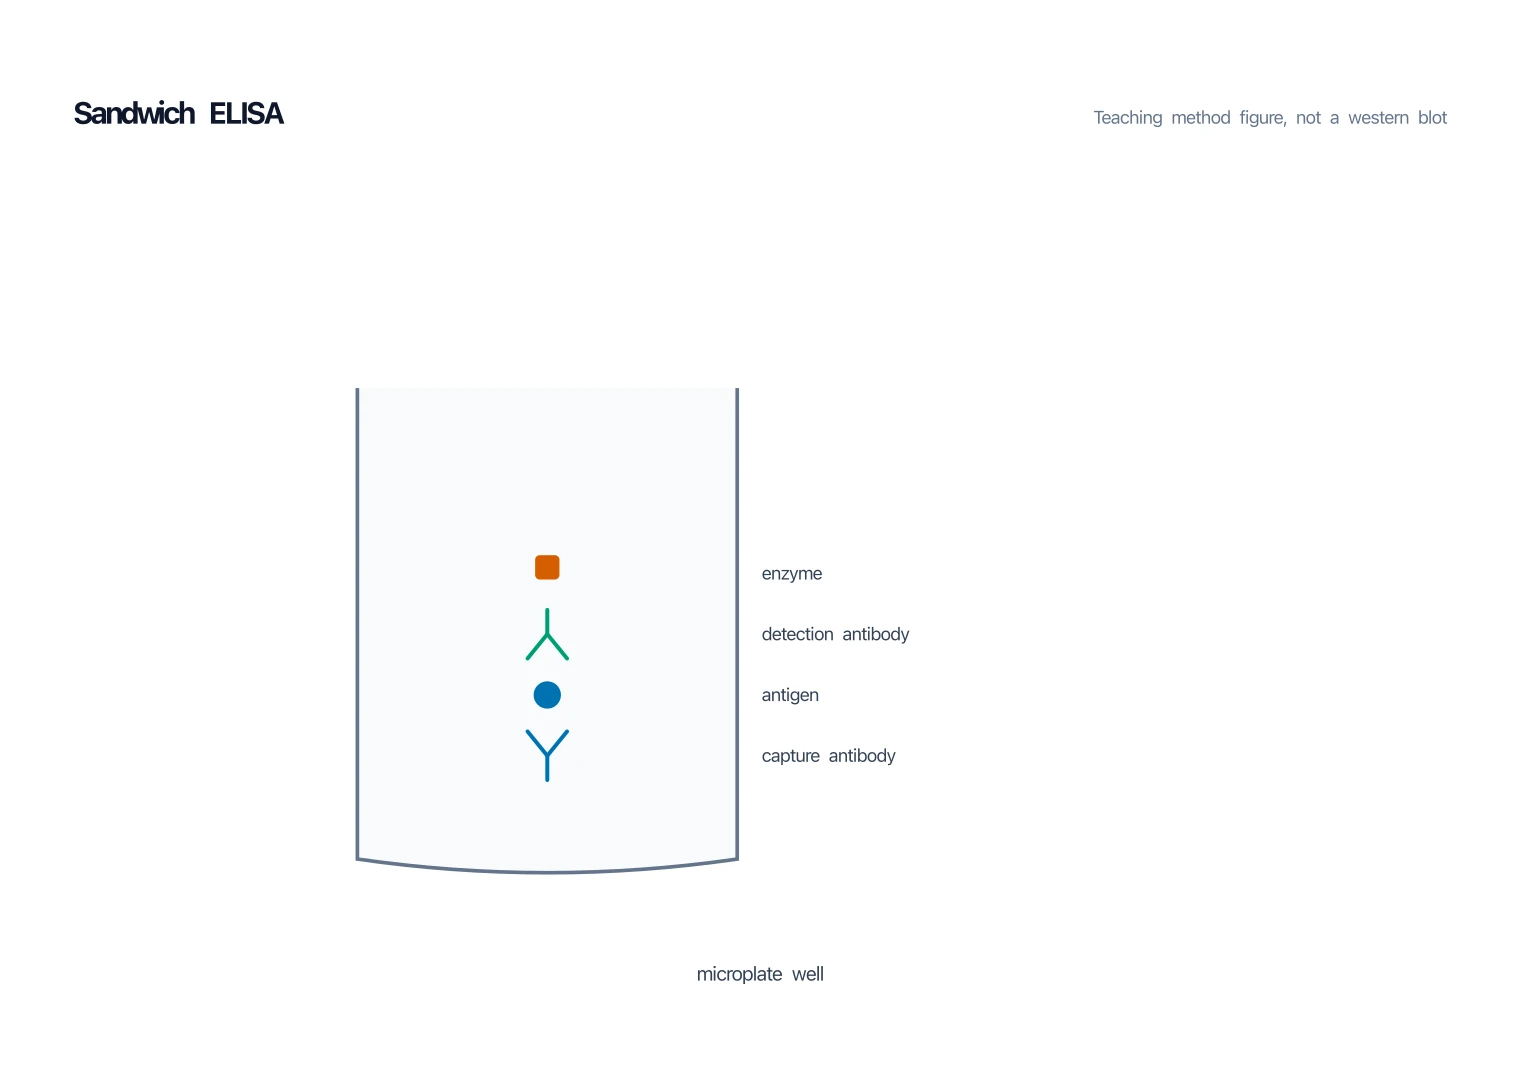
ELISA Diagram Generator
Well and antibody stack — the immunoassay cartoon, not a gel.
 Science
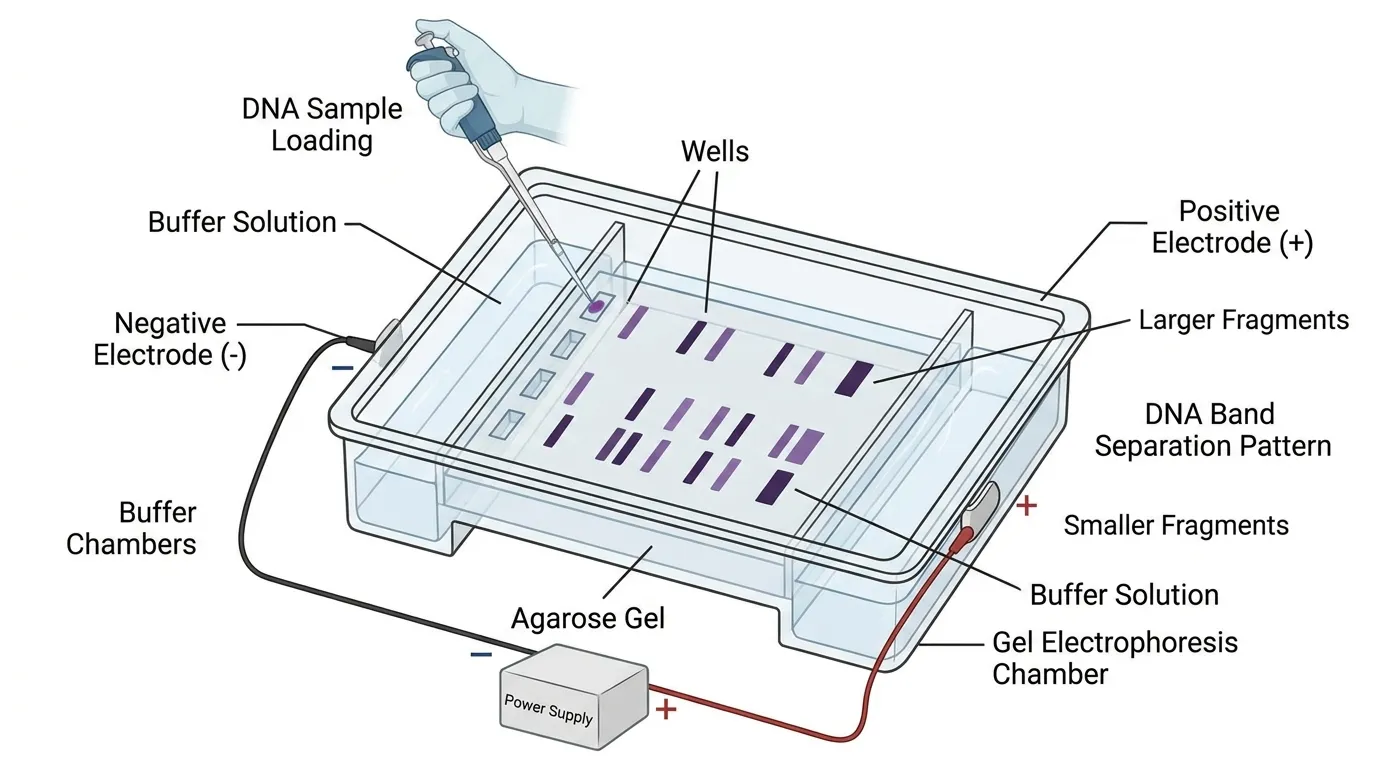
Schematic Diagram Maker
Draw the gel box, power supply, and buffer tank as a labeled lab schematic.
 Biology
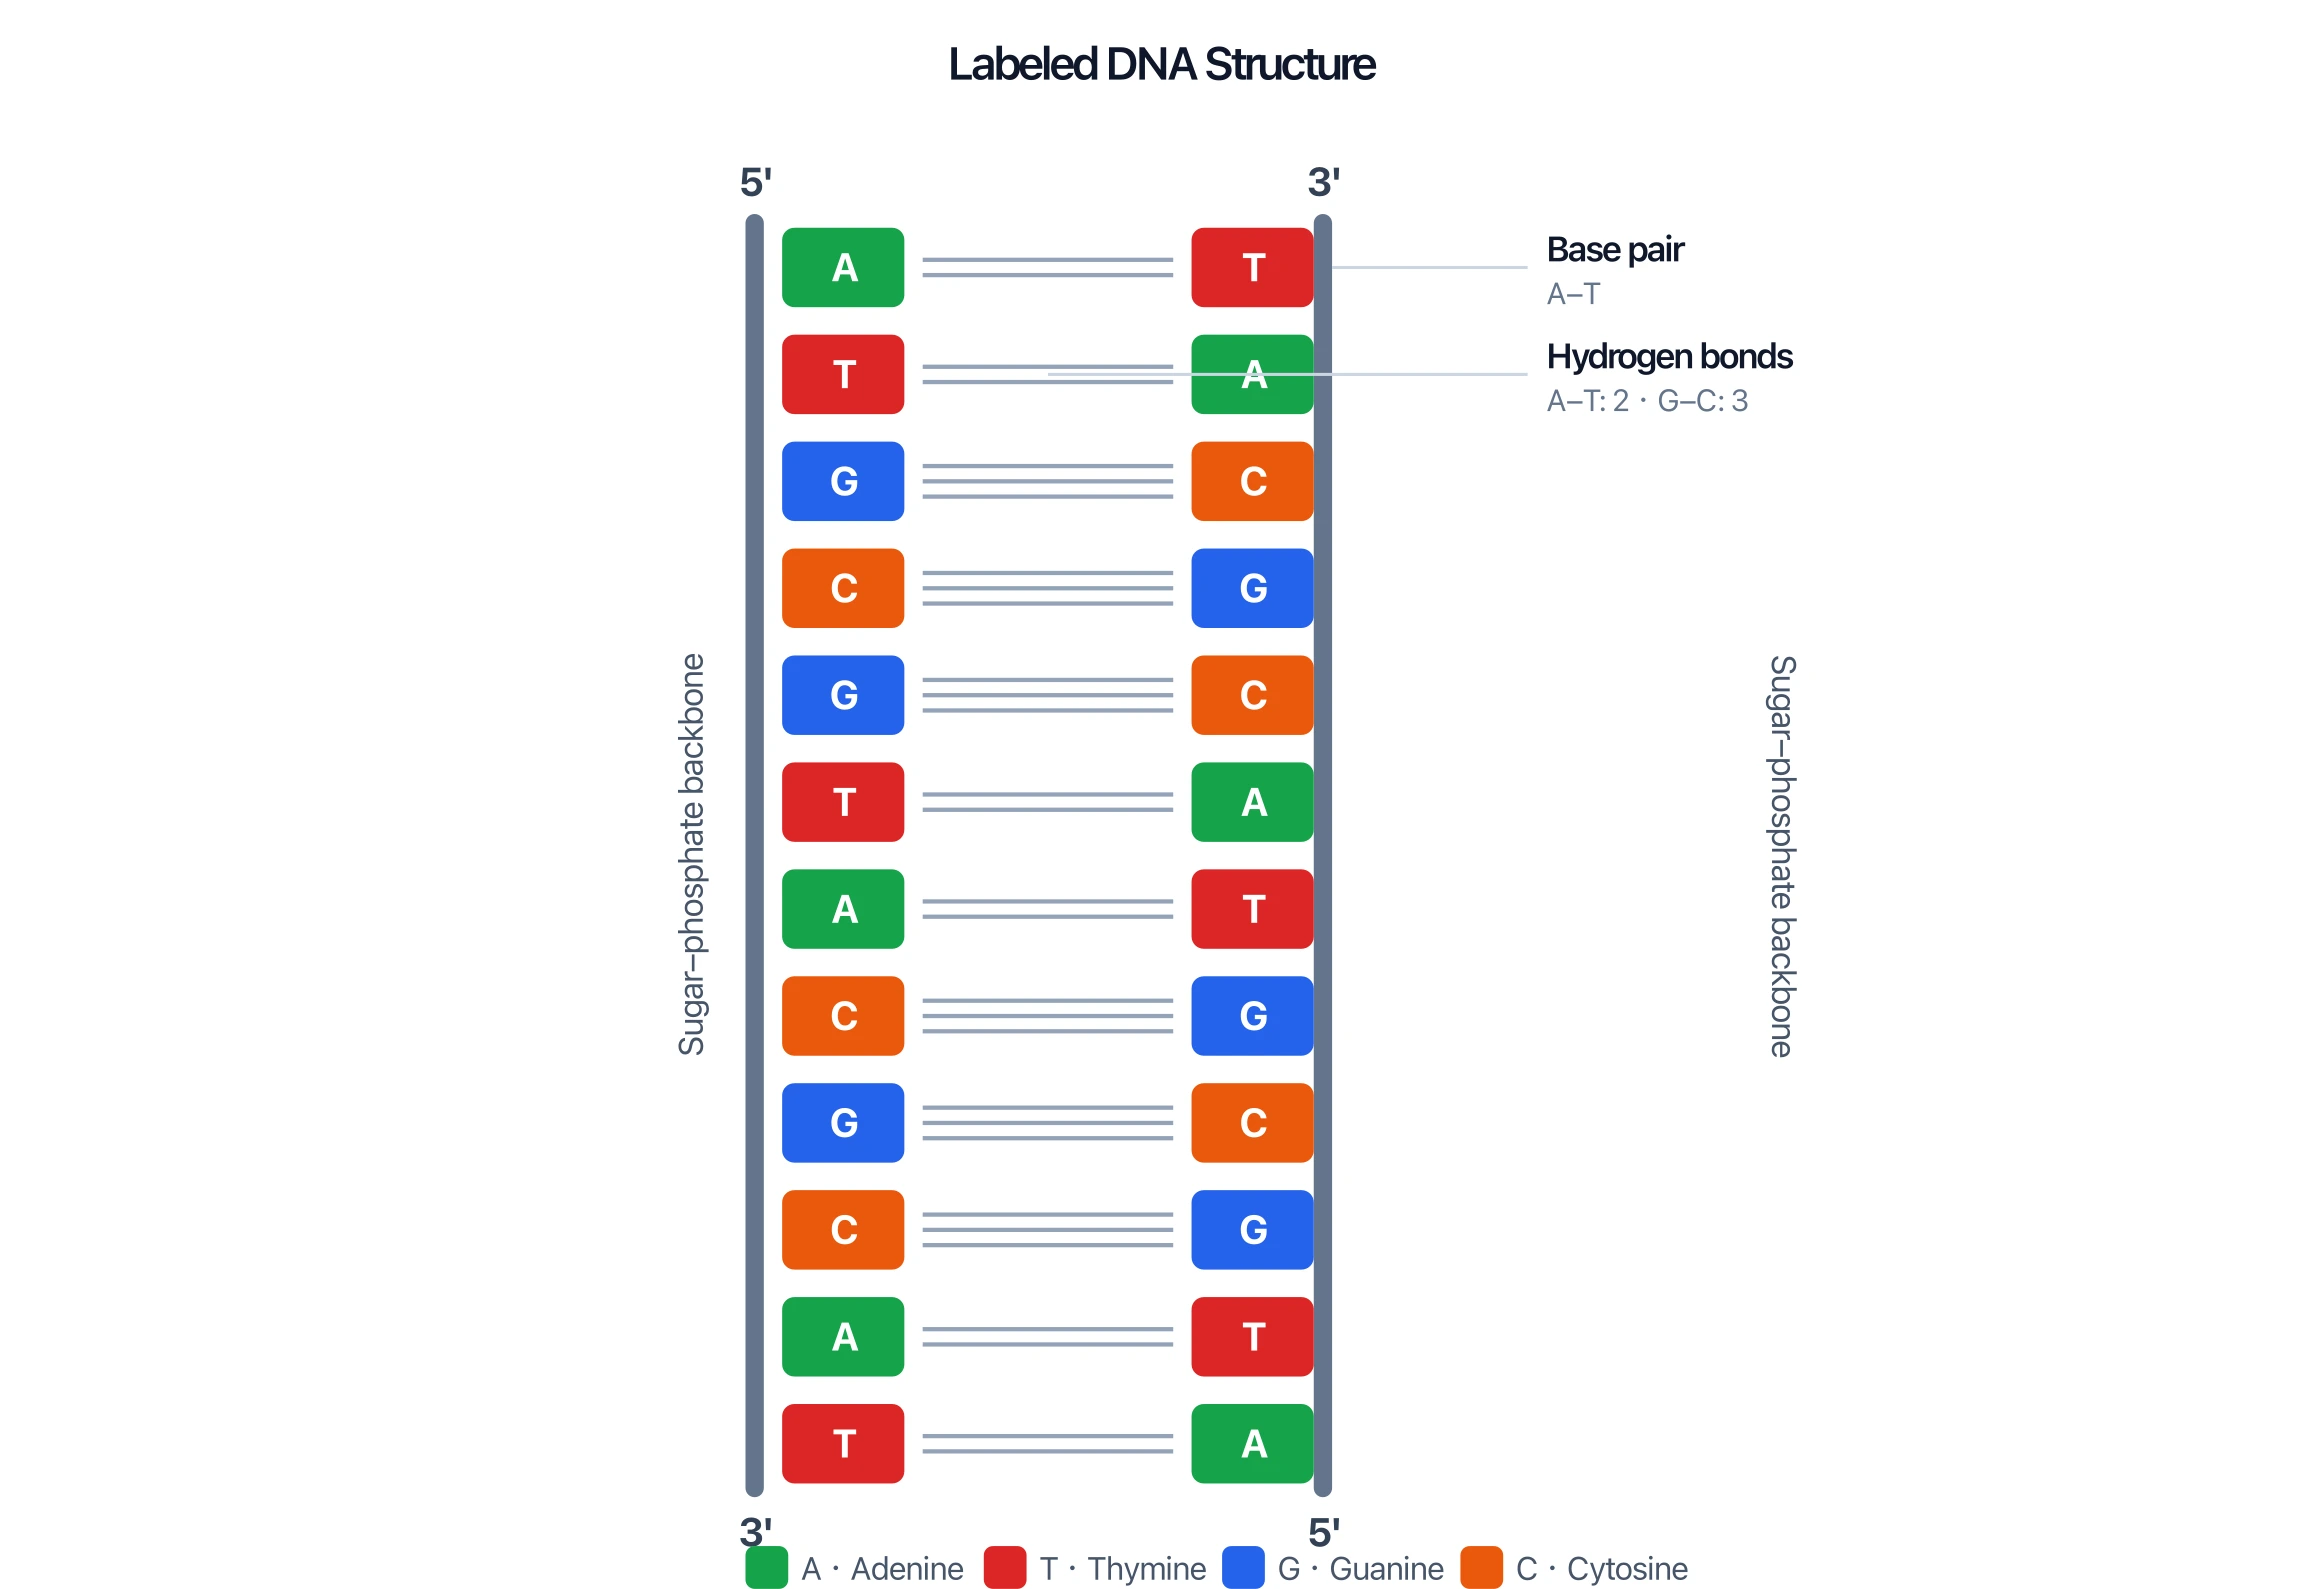
DNA Structure Diagram Generator
Label the double helix, bases, and backbone for the same cloning figure.
 Research
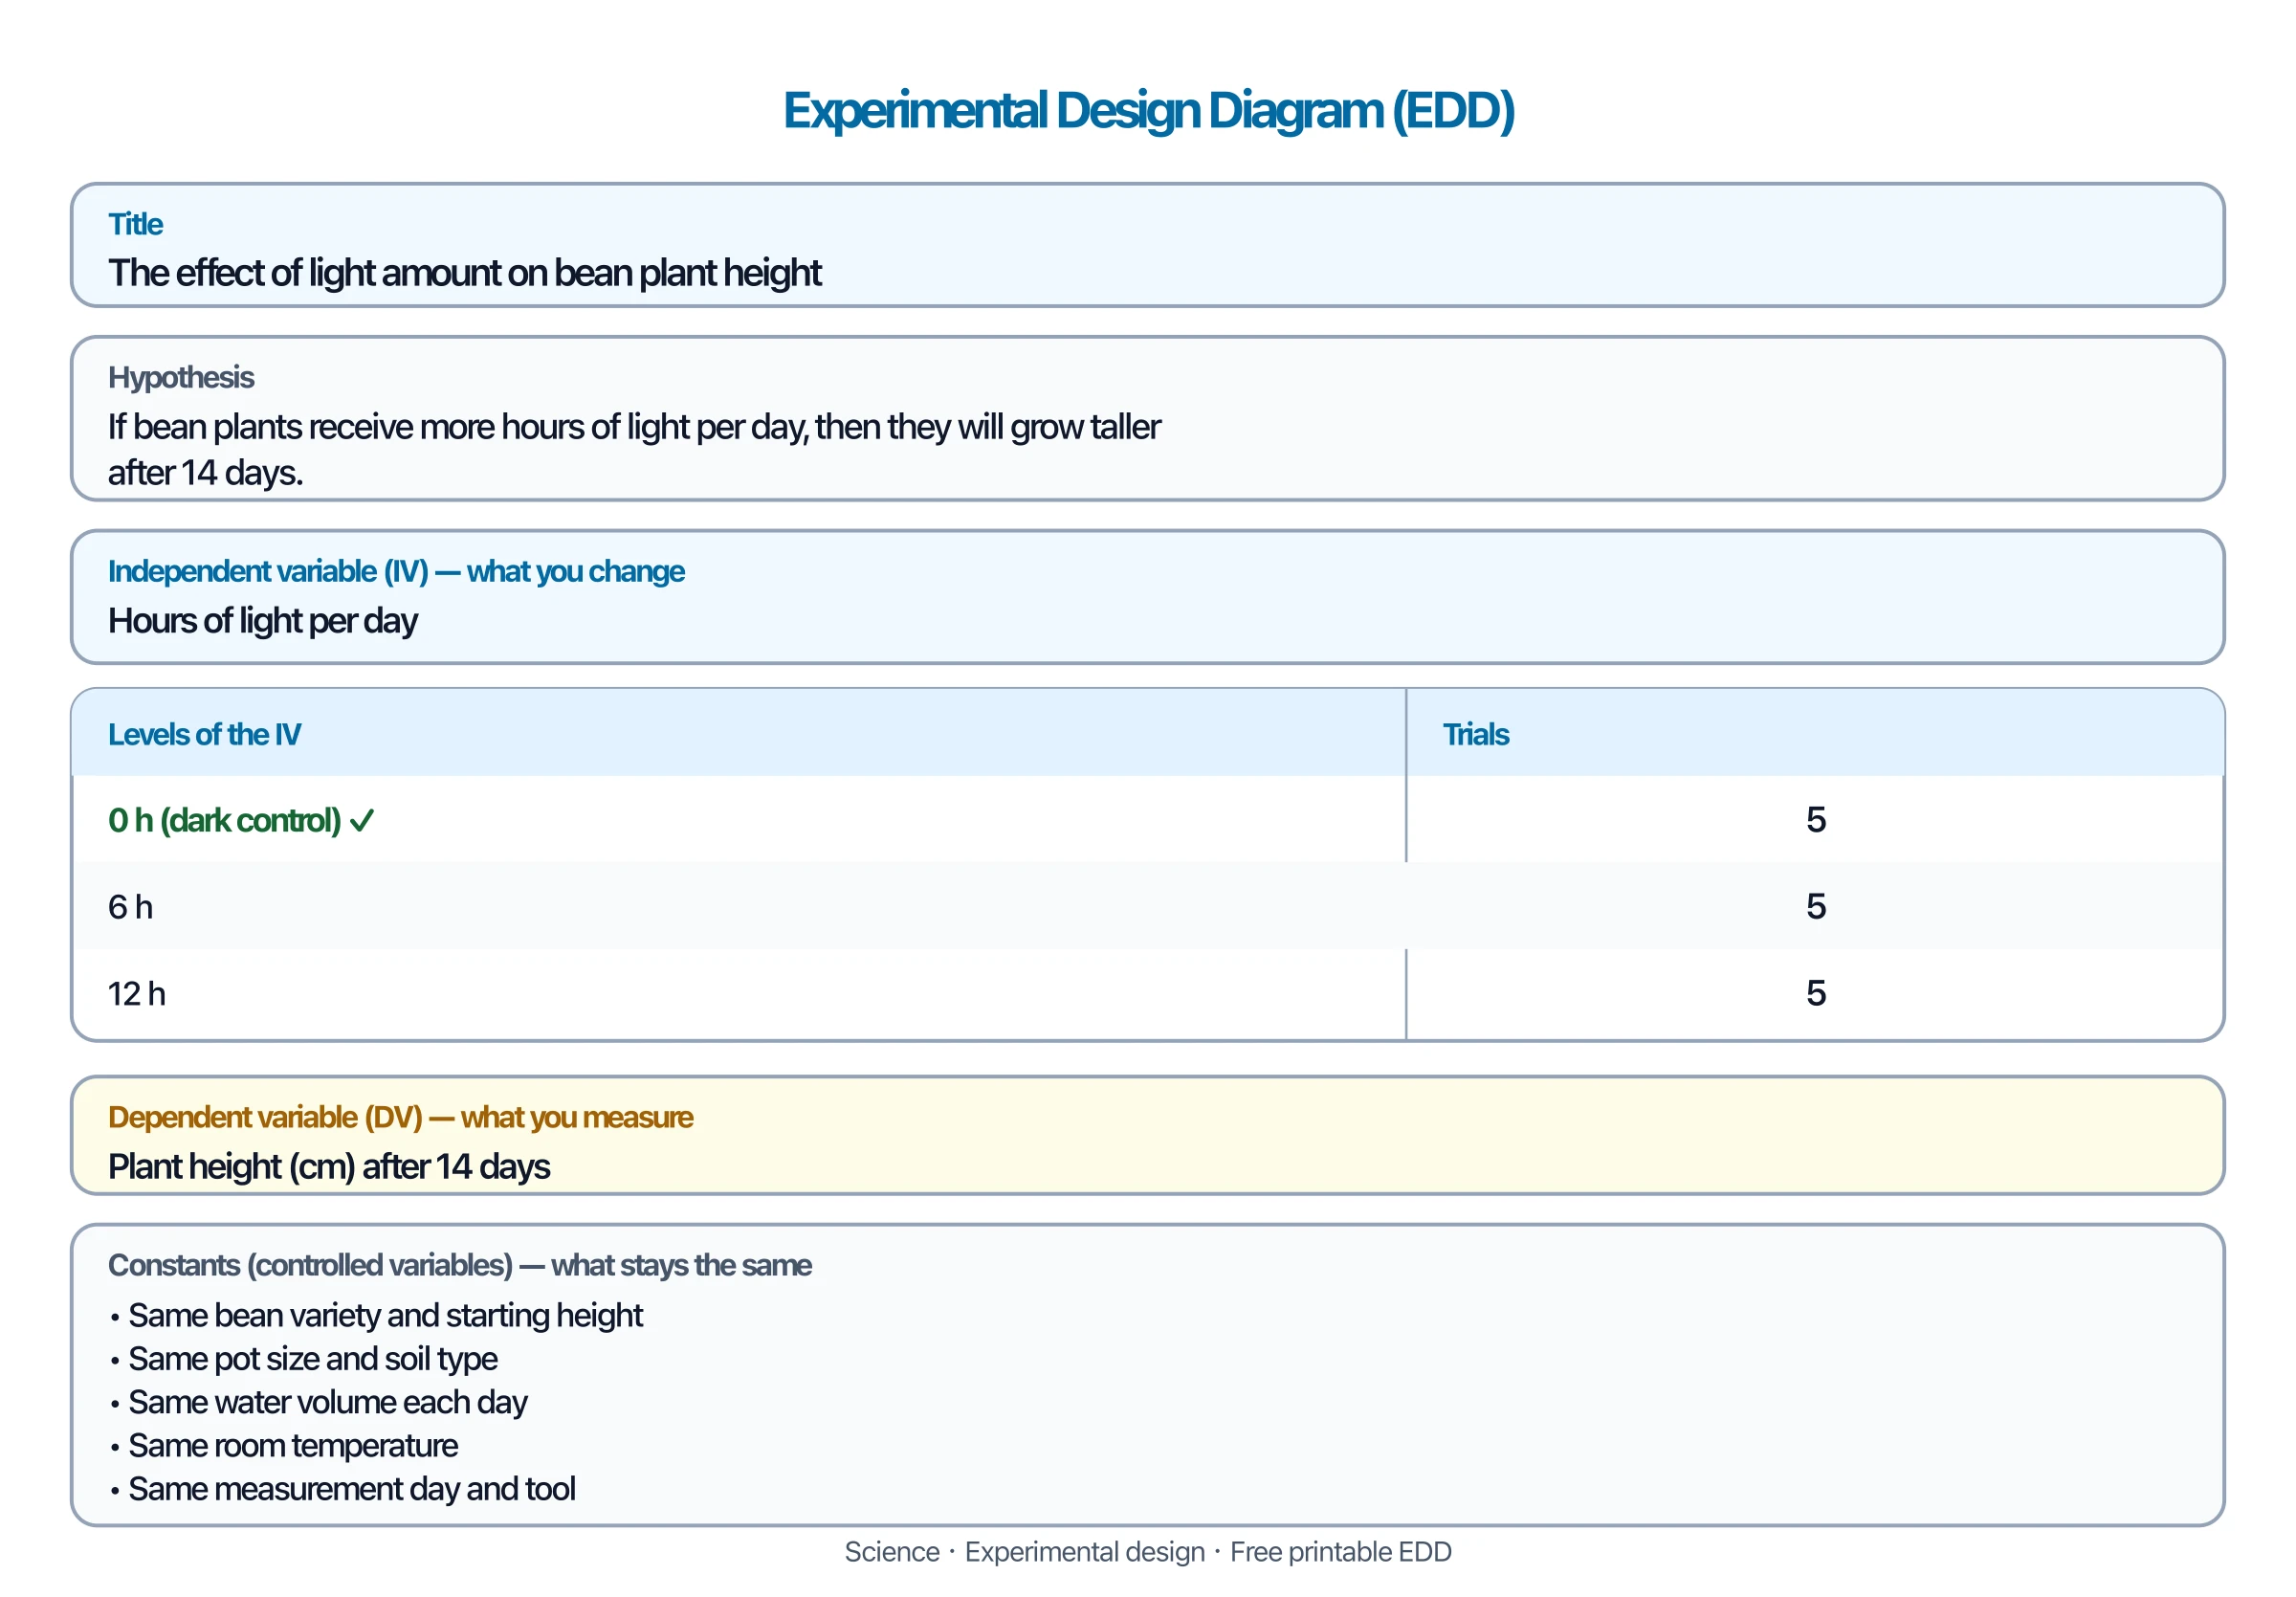
Experimental Design Diagram Generator
Map the PCR, digest, and gel steps as a methods flowchart.
 Research
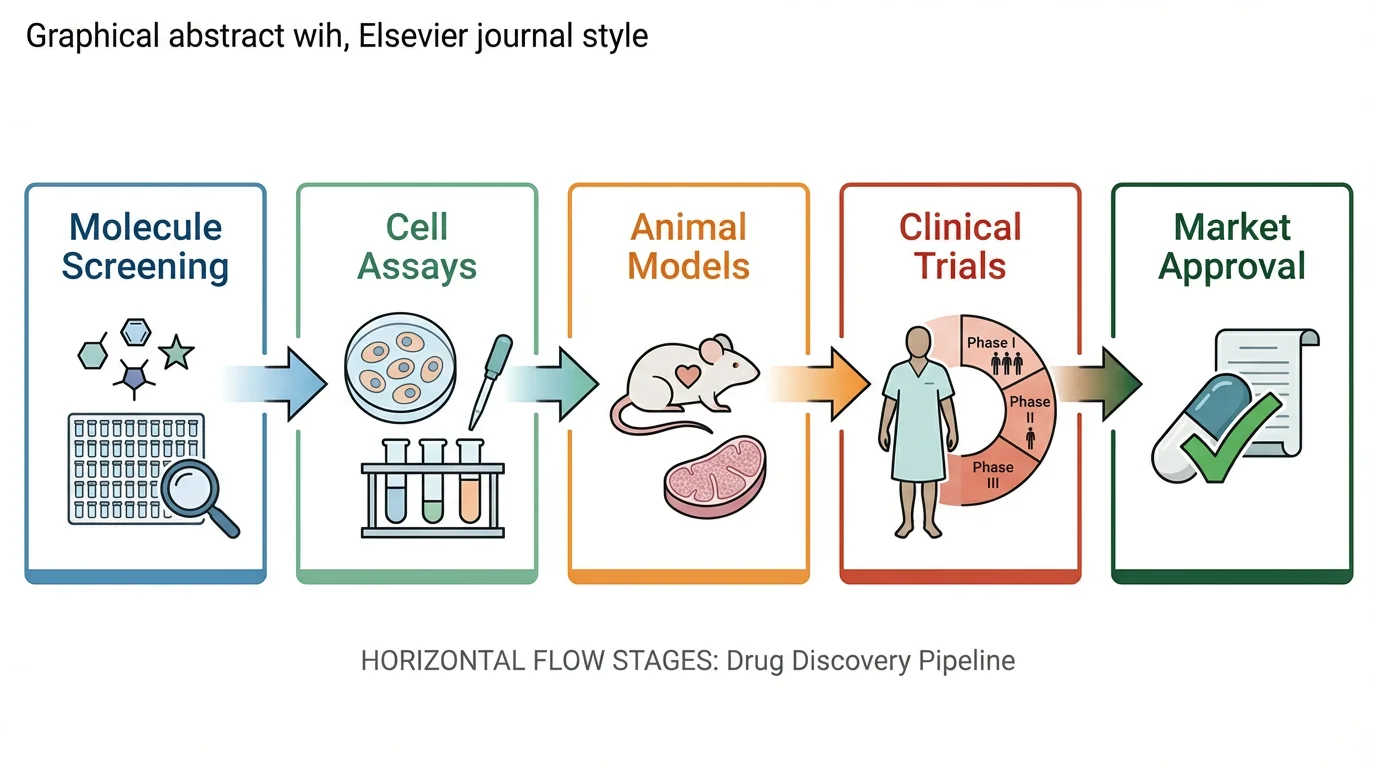
Graphical Abstract Maker
Turn the same cloning or protein-prep story into a journal graphical abstract.