Dose-Response Curve Generator dose-response
Free dose-response curve generator. Plot a sigmoid log-dose curve, mark EC50 or IC50 and Hill slope, and download labeled or blank SVG.
Sigmoid log-dose curve as SVG: EC50 or IC50, Hill slope, potency overlay — free, no account
Curve options
The curve is a four-parameter logistic / Hill teaching equation. Shifting EC50 or Hill n only changes potency or steepness. This is not pasted experimental points.
Dose-Response Curve Generator
Preview is free on this page ·
Your AI dose-response illustration will appear here
For a locked EC50 and Hill slope, use the Precise Diagram tab instead
Dose-Response Curve Examples
All six images are exact engine renders of the Precise Diagram tab.
Labeled EC50 curve
Exact engine render — four-parameter / Hill teaching curve, not a fitted experiment.
Blank worksheet
Exact engine render — same sigmoid, labels removed for revision.
IC50 inhibition
Exact engine render — decreasing sigmoid, midpoint still 50%.
Hill slope overlay
Exact engine render — larger Hill n is steeper around the same EC50.
Potency overlay
Exact engine render — larger EC50 is less potent at the same concentration.
Hill plot
Exact engine render — linearization of the same Hill equation, not a Scatchard plot.
What a dose-response curve is
A dose-response curve (also called a dose-response graph or concentration-response curve) plots effect against log10 dose. The teaching shape is sigmoid: a lag at low concentration, a steep rise through the midpoint, and an Emax plateau. This page draws that lecture figure as an exact SVG. It is not a Lineweaver–Burk 1/v plot and it is not a Scatchard B/F binding plot. Use the Lineweaver–Burk generator for enzyme double-reciprocal axes.
What the traces lock
- The curve is a four-parameter logistic / Hill equation. At EC50 or IC50 the response is exactly halfway between the bottom and the top (50% when those are 0 and 100).
- An increasing agonist curve uses EC50. An inhibitory curve uses IC50 and falls as concentration rises. Both midpoints stay at 50%.
- A larger Hill coefficient is steeper around the same midpoint. A larger EC50 is a right shift: less potent at the same concentration, same Emax.
- The Hill-plot variant is the linearization log10(Y/(1−Y)) versus log10 concentration. It crosses zero at EC50 and its slope is n. That is not a Scatchard plot.
Labeled, blank, IC50, Hill, and potency
Start with the labeled EC50 figure so the room can see the half-effect and the plateau. Use the blank copy of the same log axis for a self-test. IC50 mode flips the sigmoid down. The Hill overlay keeps EC50 fixed and changes steepness. The potency overlay keeps Emax fixed and moves EC50. Those are the lecture-pack variants people search as “IC50 curve,” “EC50 curve,” “Hill plot,” and “dose response graph.”
Precise SVG vs AI illustration
The Precise Diagram tab is the version for class and papers: midpoint, slope, and potency direction are fixed in code. The AI Illustration tab is only for slide mockups. Check every EC50/IC50 mark against the precise traces before you project the file or put it in a paper. Do not ask the AI tab for a 1/v Lineweaver–Burk plot or a default Scatchard plot.
Frequently Asked Questions
Related Medical Tools
 Medical
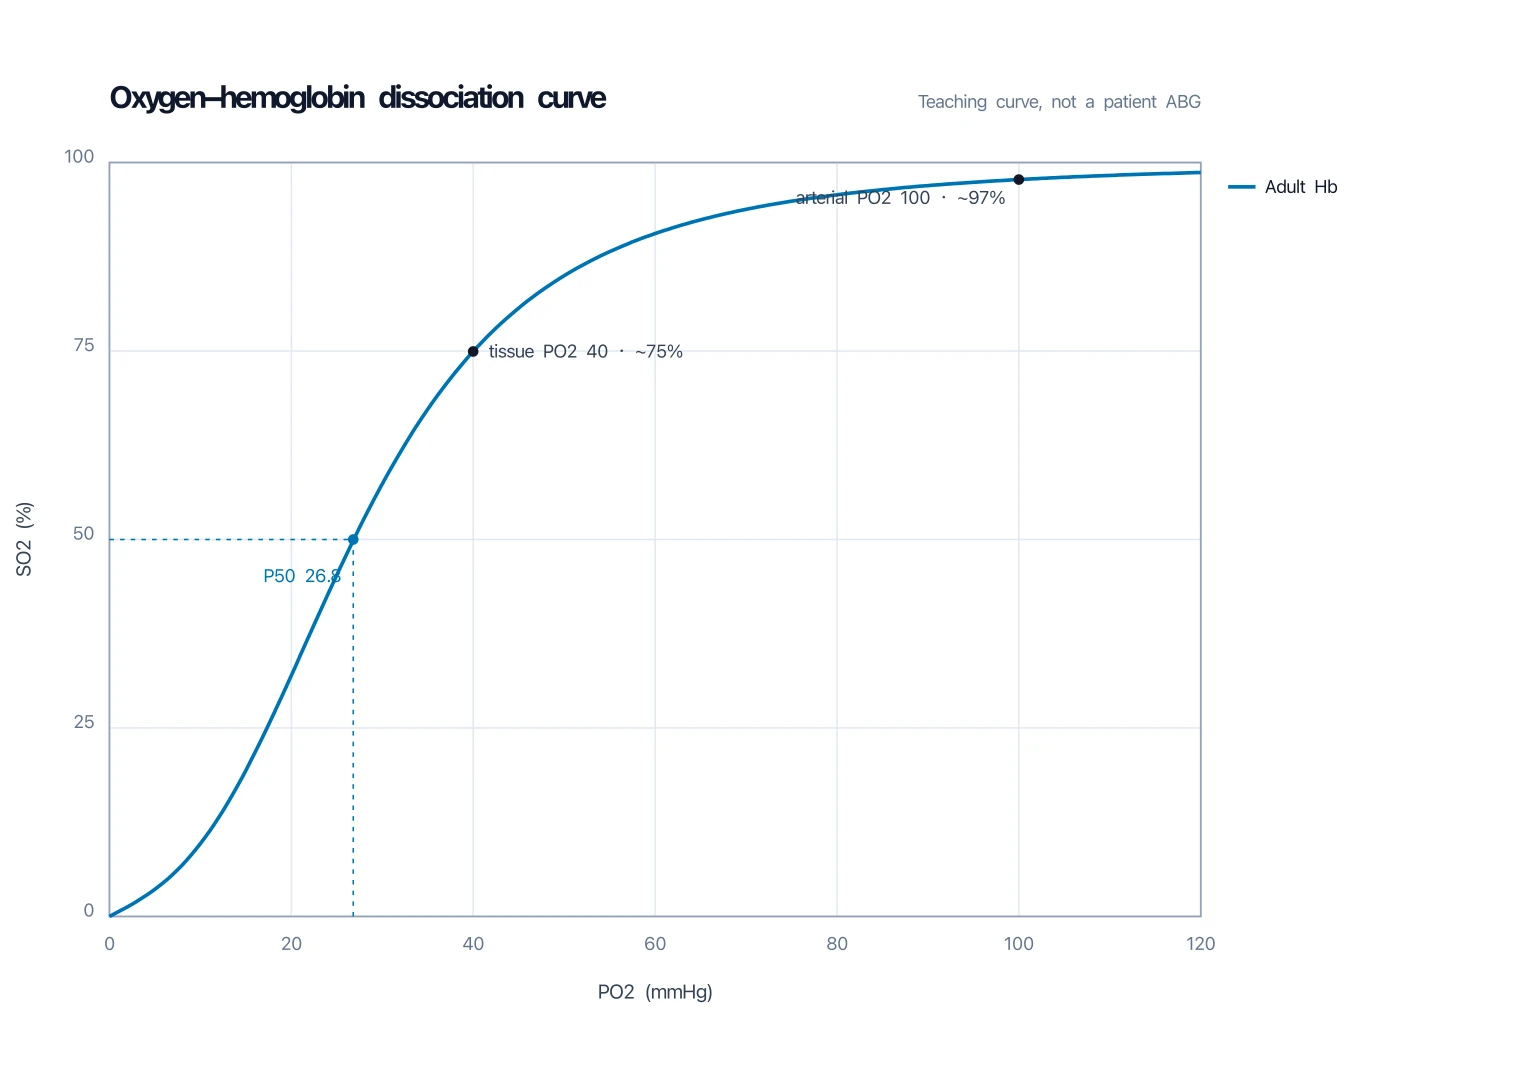
Oxygen-Hemoglobin Dissociation Curve Generator
Another sigmoid teaching plot — SO2 versus PO2 with P50, not log-dose versus effect.
 Research
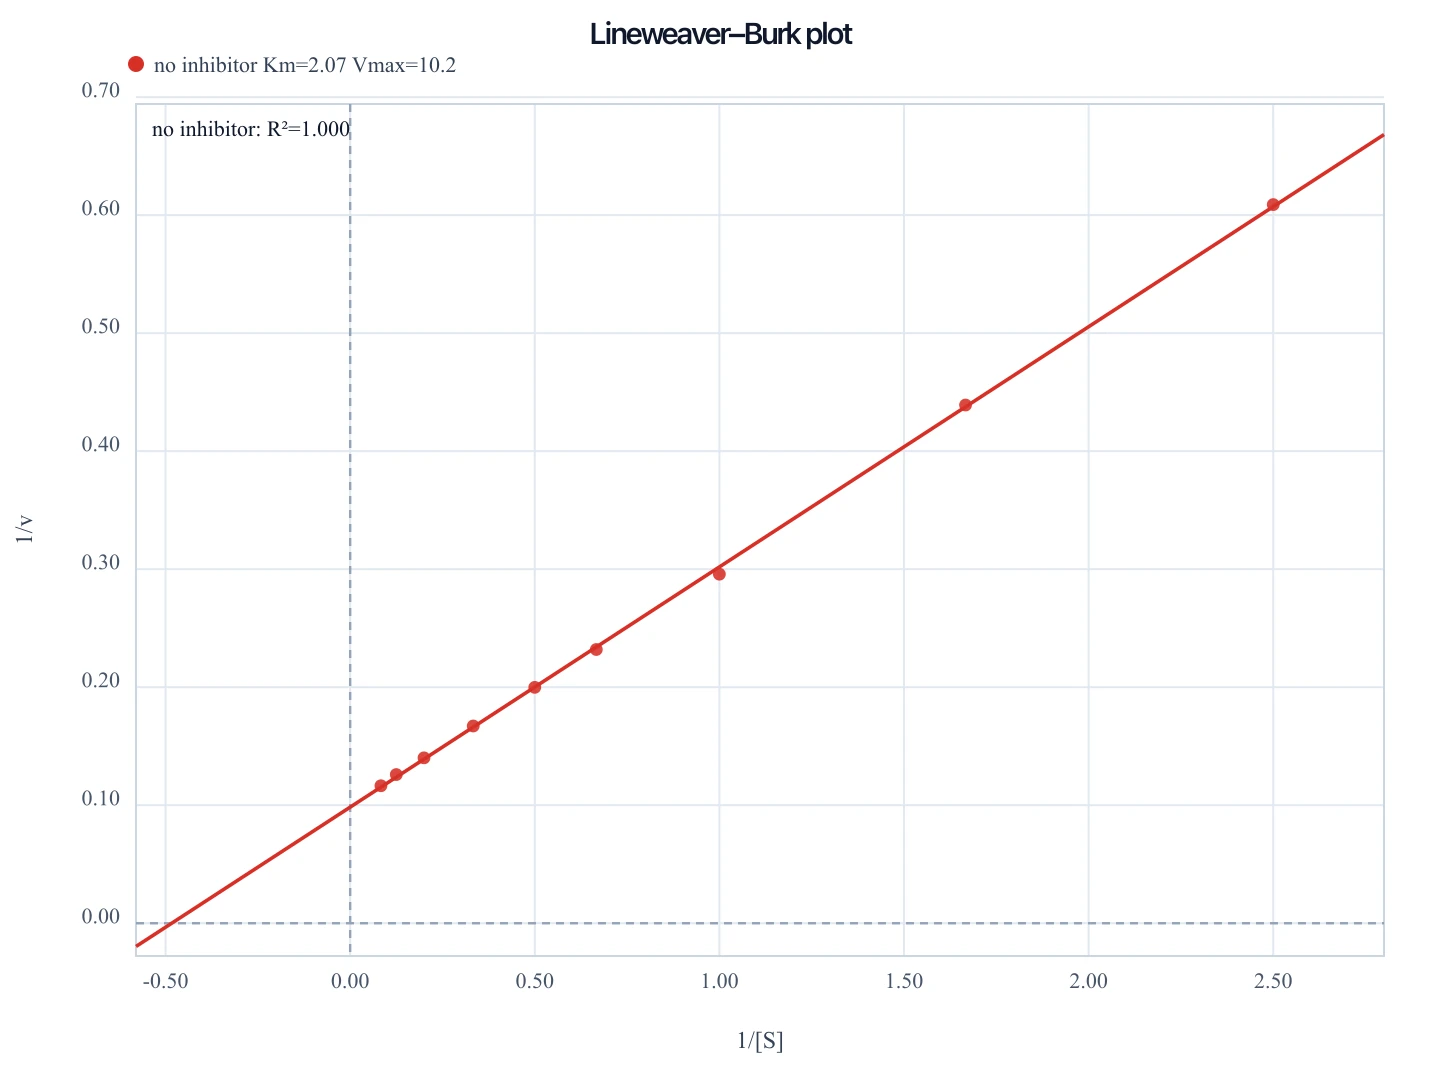
Lineweaver-Burk Plot Generator
Enzyme 1/v versus 1/[S] — kinetics axes, not an IC50 dose-response curve.
 Medical
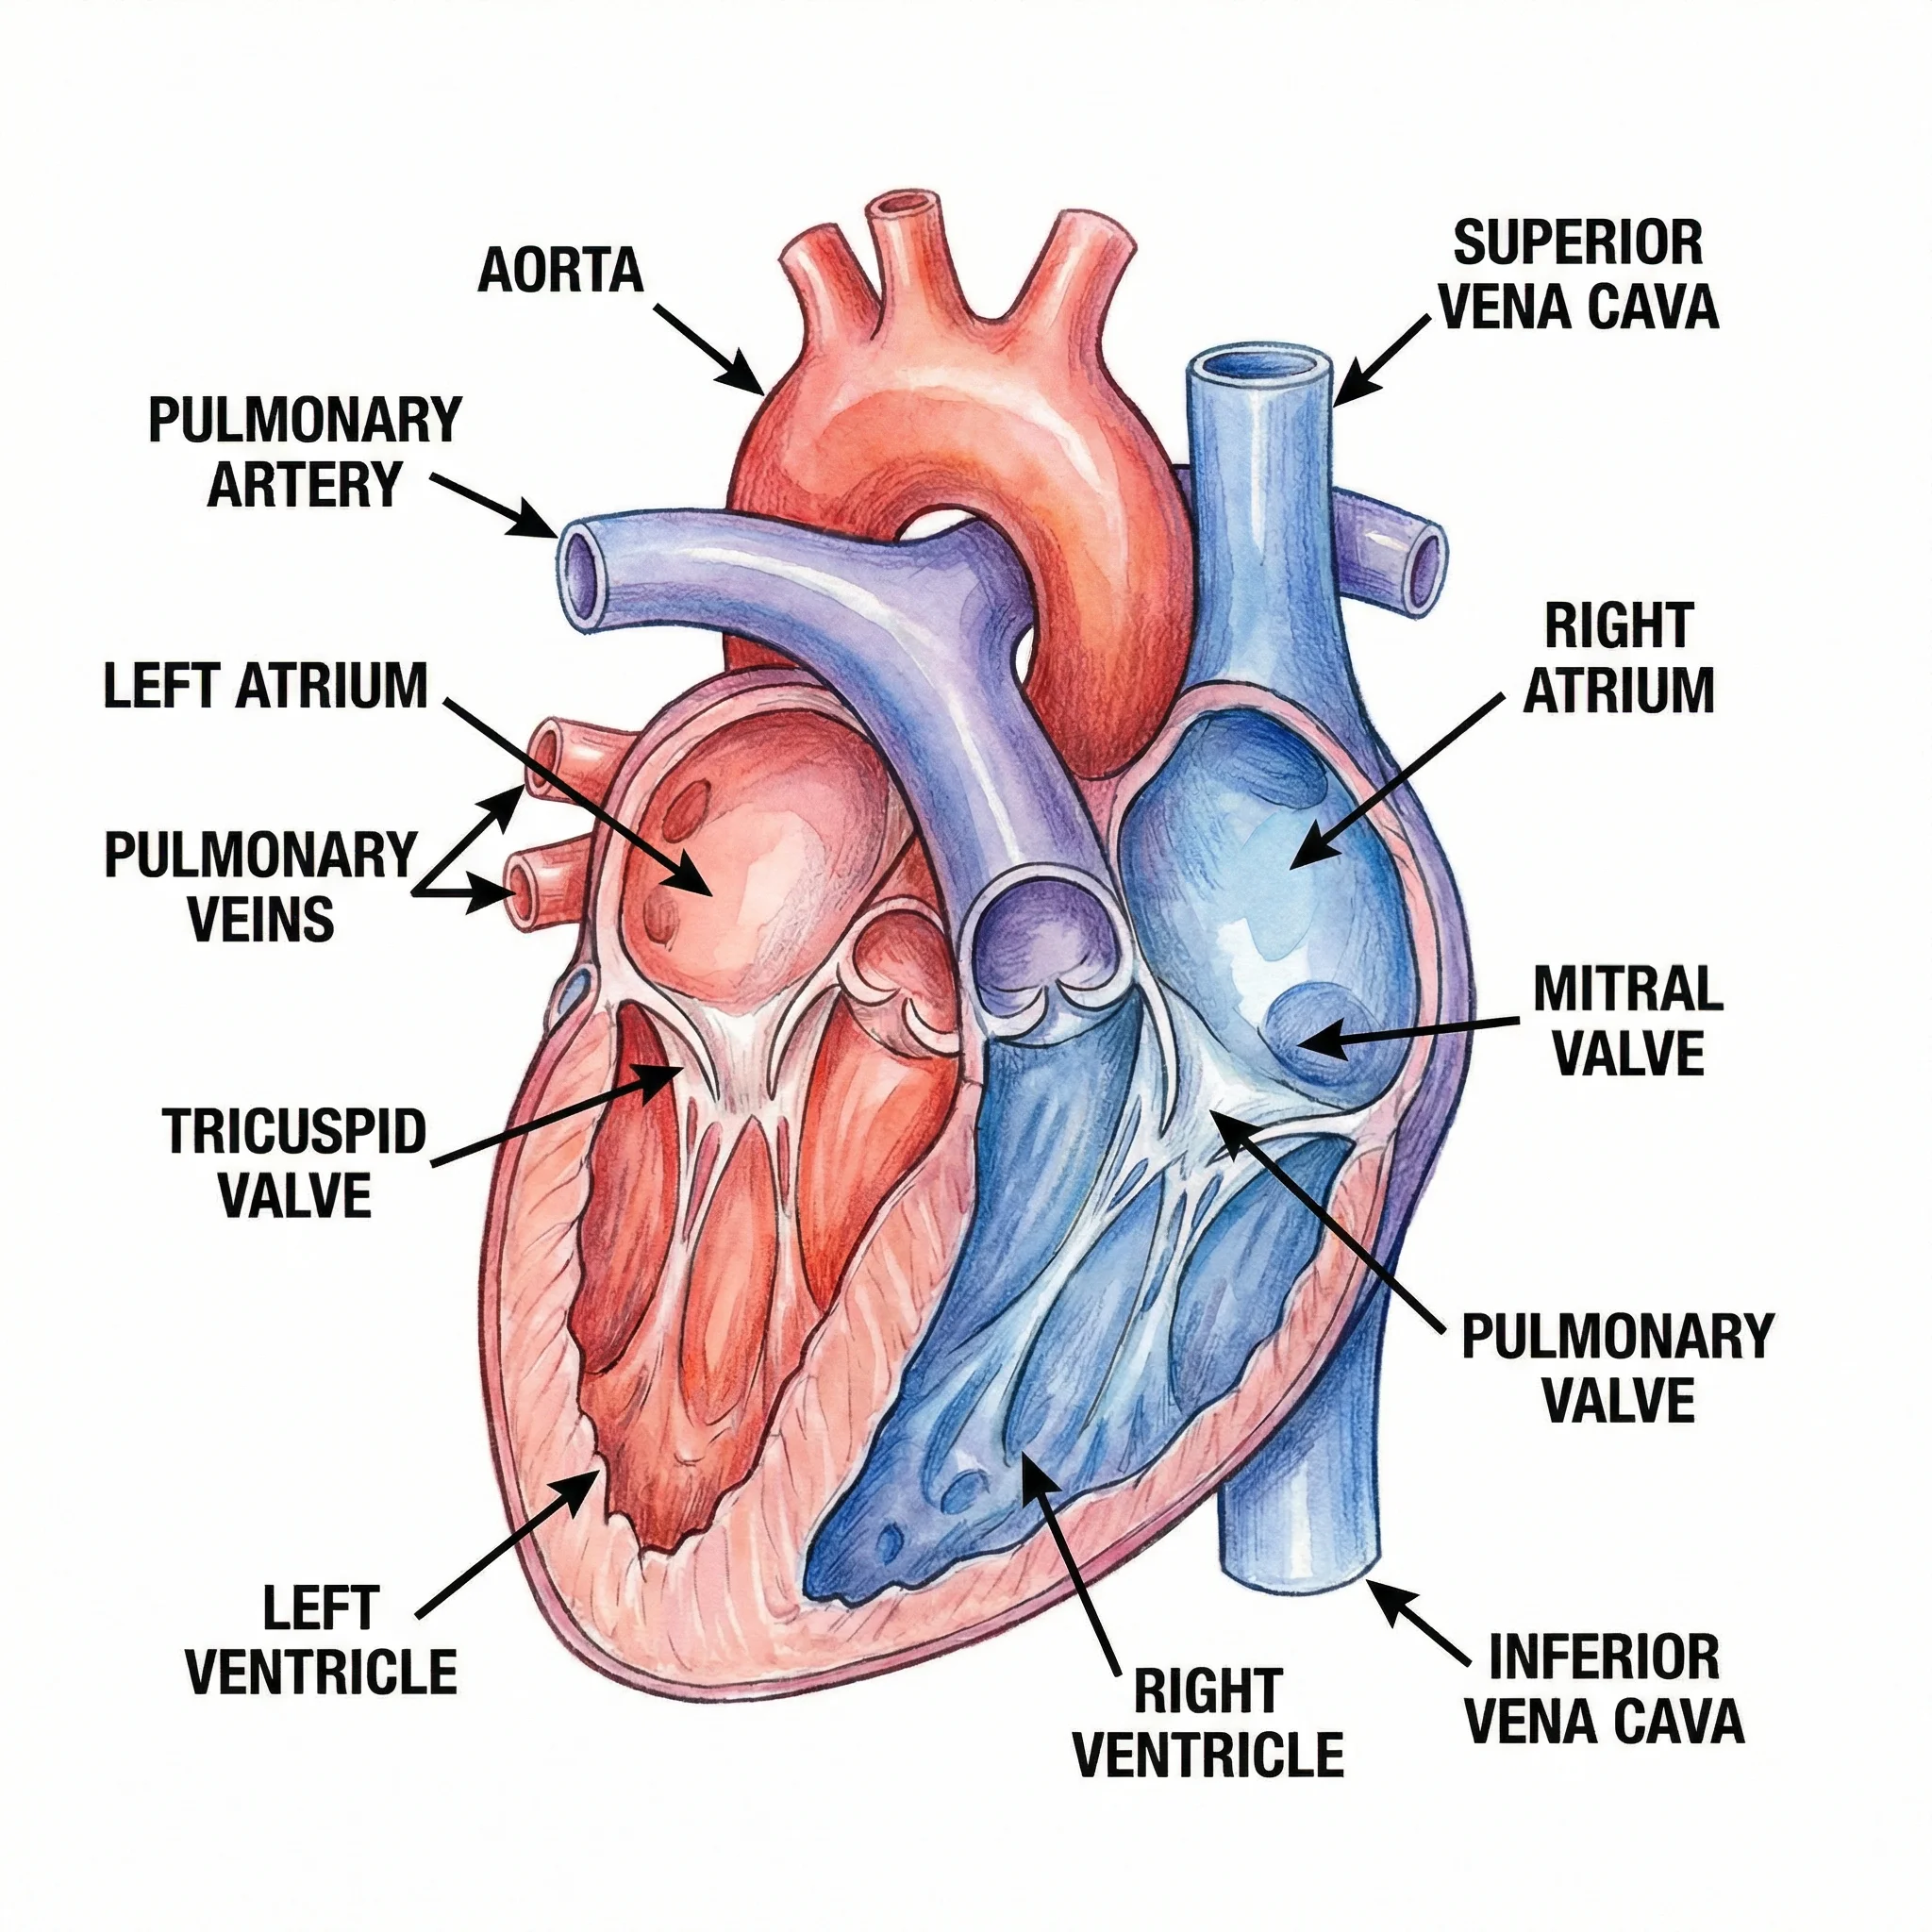
Medical Illustration Generator
Broader clinical figures when the dose-response curve is only one panel in a slide.