CONSORT Diagram Generator for Clinical Trials
Free CONSORT 2010 flow diagram generator — enter your trial’s participant counts for a publication-ready diagram with all four phases. Export SVG.
Enter your participant counts — renders an exact CONSORT 2010 flow diagram as SVG, free
CONSORT Diagram Generator
Free to try ·
Your AI CONSORT-style diagram will appear here
For an exact, standards-compliant diagram, use the Precise Diagram tab instead
CONSORT Diagram Examples
Exact engine renders plus AI illustrations across trial designs
Two-Arm Parallel RCT
Exact engine render — the standard two-arm CONSORT 2010 layout with all four phases.
Three-Arm Trial
Exact engine render — three parallel arms, showing the engine scales past two groups.
Crossover Trial
AI illustration — a crossover design with two sequences and a washout period.
Cluster RCT
AI illustration — a cluster-randomised trial with clusters and nested participants.
Pilot / Feasibility Trial
AI illustration — a small pilot and feasibility RCT.
Multi-Site Trial
AI illustration — a large multicenter trial reported with intention-to-treat analysis.
What is a CONSORT flow diagram?
A CONSORT flow diagram is the standard chart that tracks participants through a randomized controlled trial (RCT). It follows people down four phases — Enrollment, Allocation, Follow-Up, and Analysis — showing how many were assessed for eligibility, how many were excluded and why, how many were randomised, and how many in each arm received the intervention, were lost to follow-up, and were finally analysed. The CONSORT 2010 statement makes this diagram a reporting requirement for most medical journals, so nearly every published trial includes one. This generator draws it for you: enter your counts on the left and the exact SVG updates instantly on the right.
The four phases
- Enrollment — how many people were assessed for eligibility, how many were excluded (with reasons), and how many were randomised.
- Allocation — how many were allocated to each arm, how many received the allocated intervention, and how many did not (with reasons).
- Follow-Up — how many in each arm were lost to follow-up or discontinued the intervention.
- Analysis — how many in each arm were analysed and how many were excluded from analysis (with reasons).
How to make your CONSORT diagram
- Enter the enrollment numbers: assessed for eligibility, the exclusion reasons and their counts, and the number randomised.
- Fill in each arm — allocated, received, did not receive, lost to follow-up, discontinued, analysed, and excluded from analysis.
- The diagram redraws instantly as an exact SVG with the four standard phases labeled down the side and arrows connecting every box.
- Download a clean, scalable SVG for your manuscript, thesis, or slides — free, with no sign-up.
CONSORT vs PRISMA — which do I need?
These two flow diagrams look similar but answer different questions. A CONSORT diagram tracks participants through a single randomized controlled trial, from eligibility screening to final analysis. A PRISMA flow diagram, by contrast, tracks studies through a systematic review or meta-analysis — how many records were identified, screened, and included. If you are reporting one trial, you need CONSORT; if you are pooling many studies, you need PRISMA. Many methods papers include both, alongside a forest plot for the pooled results. Use the PRISMA flow diagram generator and the forest plot generator for those figures.
CONSORT diagrams in a trial report
The CONSORT flow diagram is usually the first figure in a trial paper and sits alongside the CONSORT checklist in the methods and results sections. Report the exact counts at each stage so readers can trace every participant from screening to analysis — unexplained drops between randomisation and analysis are a common reviewer flag. This tool renders the diagram from the counts you enter; it does not compute intention-to-treat or per-protocol populations for you, so enter the analysis numbers you plan to report. For the pooled treatment effect across trials, pair it with a forest plot.
Frequently Asked Questions
Related Research Tools
 Research
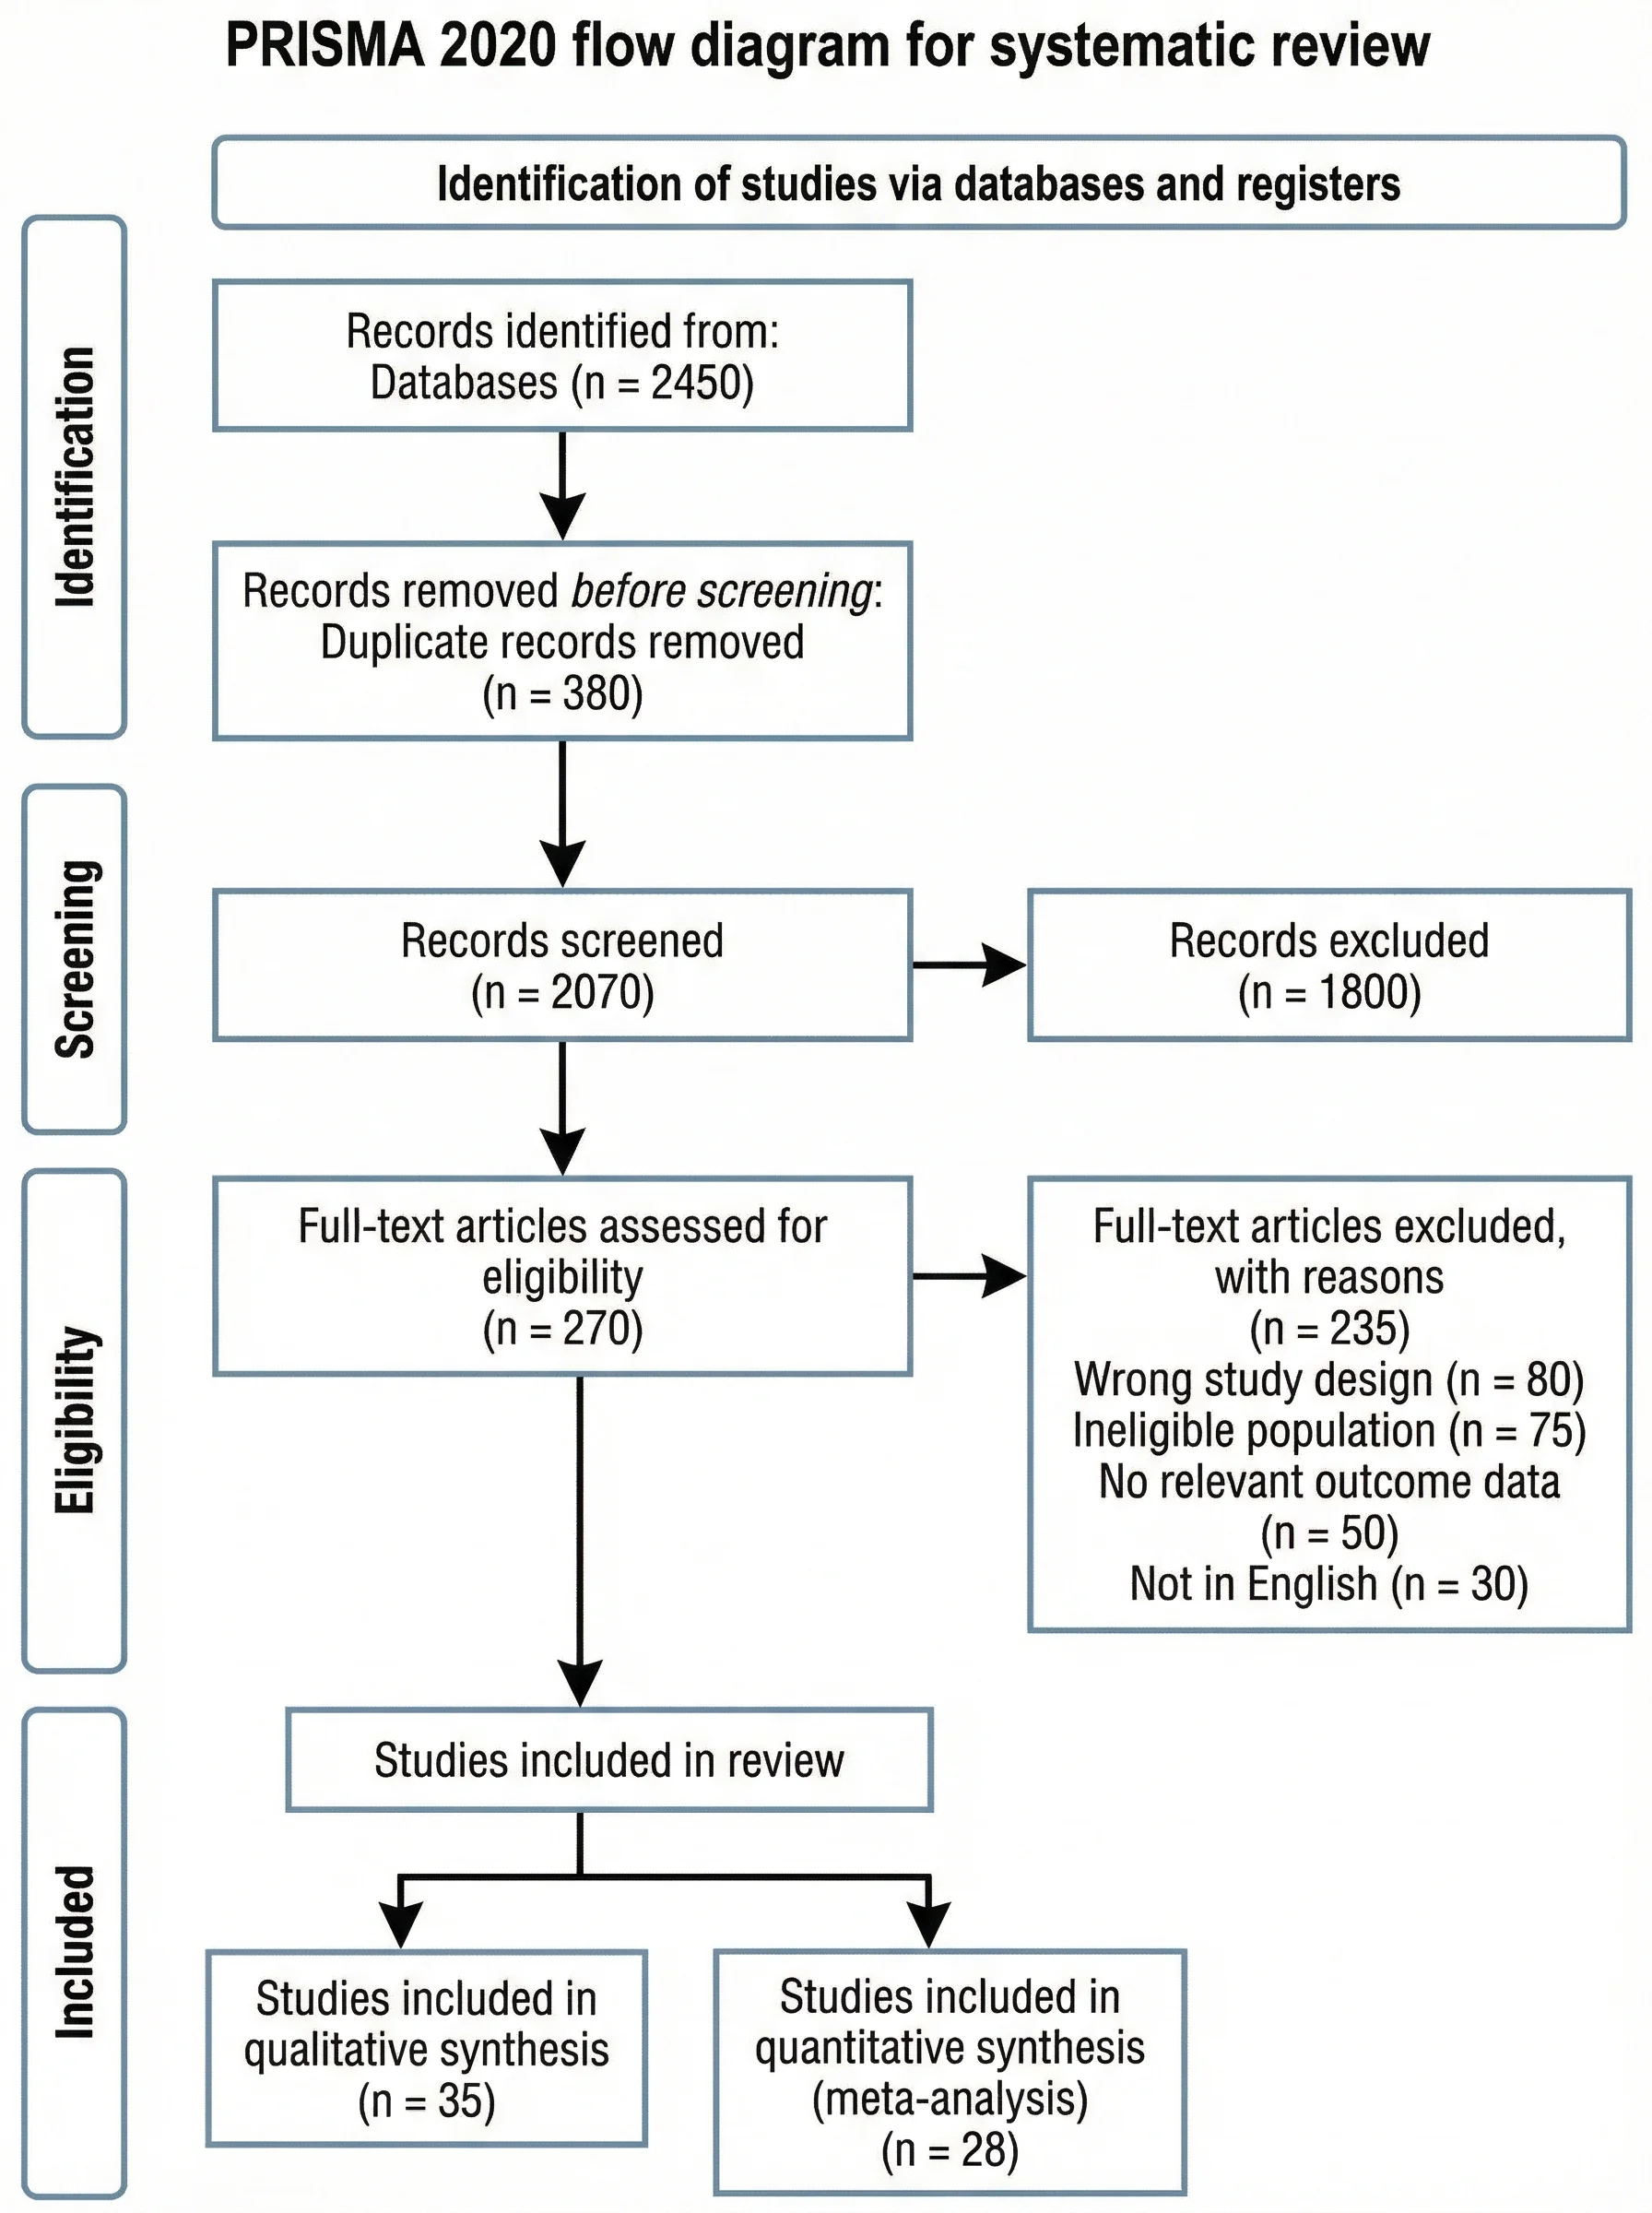
PRISMA Flow Diagram Generator
Draw the PRISMA 2020 study-selection flow for a systematic review or meta-analysis.
 Research
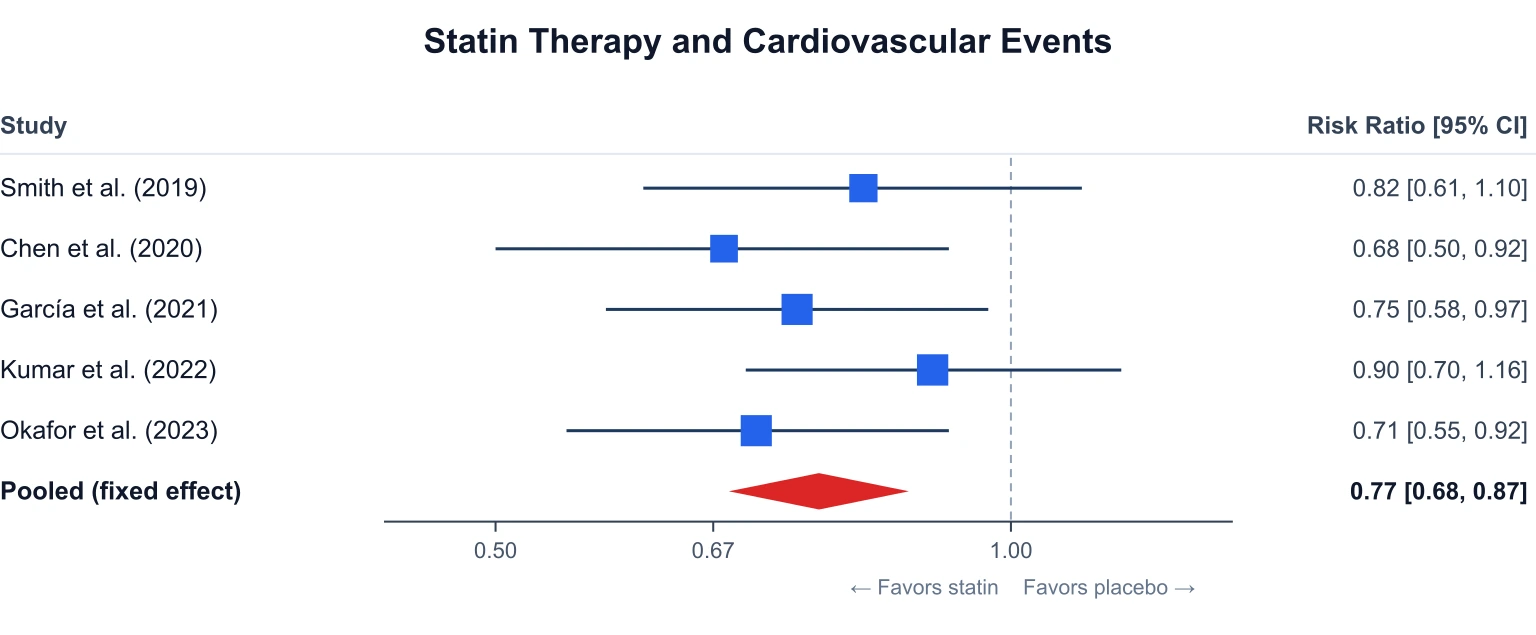
Forest Plot Generator
Plot pooled effect sizes with confidence intervals for a meta-analysis.
 Research
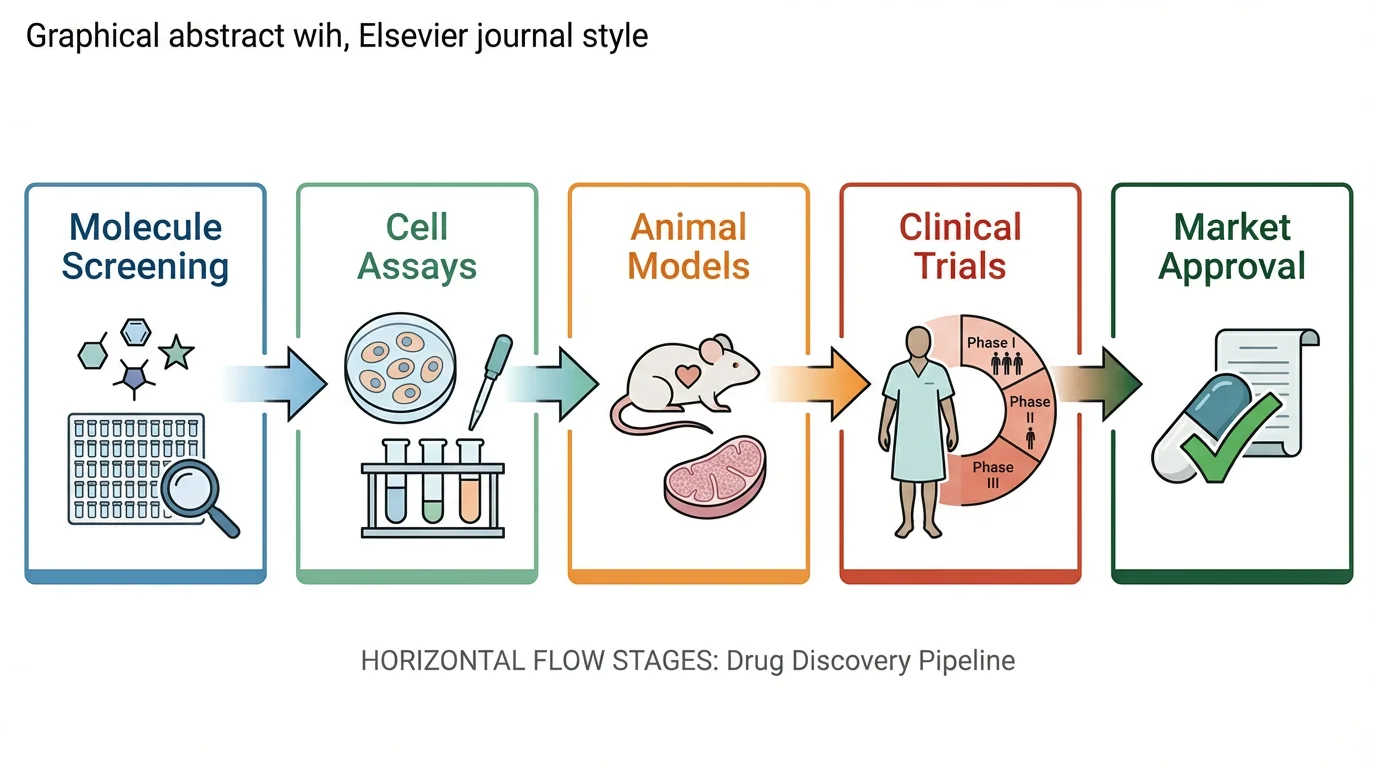
Graphical Abstract Maker
Summarize your paper in one publication-ready figure.
 Research
Scientific Poster Generator
Lay out a conference research poster with your figures and sections.
 Research
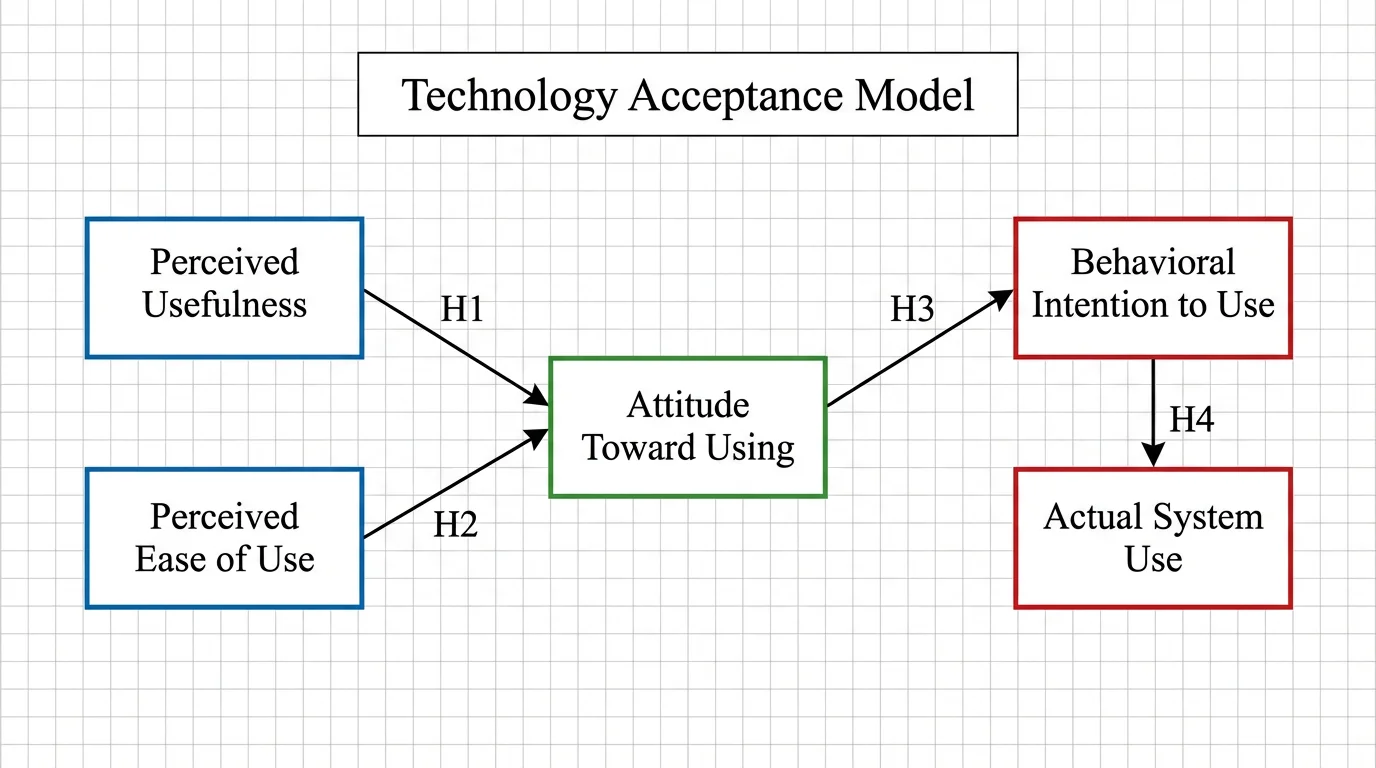
Conceptual Framework Generator
Diagram the variables and relationships behind your study or thesis.