PCR Diagram Generator denature, anneal, extend
Free PCR diagram generator. Draw denaturation, annealing, and extension as a labeled cycle SVG — not a gel and not a thermal-cycler photo.
Method figure as SVG: denature, anneal, extend, doubling, or a temperature profile — free, no account
Figure options
Temperatures and primer direction are teaching landmarks, not a cycler log. The gel of the product lives on the electrophoresis page.
PCR Diagram Generator
Preview is free on this page ·
Your AI PCR illustration will appear here
For locked temperatures and primer direction, use the Precise Diagram tab instead
PCR Diagram Examples
All six images are exact engine renders of the Precise Diagram tab.
Labeled cycle
Exact engine render — 95 °C splits, 55 °C seats primers, 72 °C extends.
Blank worksheet
Exact engine render — same three panels, names removed.
Numbered steps
Exact engine render — the Khan-style 1–2–3 on the same cycle.
Primer polarity
Exact engine render — primers point into the amplicon.
Amplification
Exact engine render — teaching 2ⁿ doubling, not a qPCR curve.
Temperature profile
Exact engine render — cycler temperatures, not a chassis photo.
What a PCR diagram is
A PCR diagram is the method figure for polymerase chain reaction: one cycle of denaturation, annealing, and extension on DNA strands, sometimes with the 2ⁿ doubling or the 95 / 55 / 72 temperature profile. This page draws that lecture cartoon as an exact SVG. It is not an agarose gel of the product, and it is not a photo of the thermal cycler.
What the cycle locks
- Denaturation is hottest (~95 °C). The duplex separates. Primers are not bound yet.
- Annealing is cooler (~55 °C). The forward primer’s 5′ sits on the left; the reverse primer’s 5′ sits on the right. Both 3′ ends point into the amplicon.
- Extension is ~72 °C. Taq lengthens the new strand 5′→3′ from each primer.
- Teaching yield doubles each cycle: 1 → 2 → 4 → 8. That is 2ⁿ, not a real efficiency-adjusted qPCR yield.
Labeled, blank, steps, primers, amplification, temperature
Start with the labeled three-step cycle. Use the blank copy for a self-test. Numbered steps mark 1–2–3 on the same panels. Primer polarity writes the 5′ and 3′ ends. Amplification shows the doubling. The temperature profile is the 95–55–72 trace. None of those modes draw a gel.
Precise SVG vs AI illustration
The Precise Diagram tab is the version for class and papers: temperatures and primer direction are fixed in code. The AI Illustration tab is only for slide mockups. Check 95 / 55 / 72 and inward primers against the precise cycle before you project the file. For the product on a gel, use the gel electrophoresis page.
Frequently Asked Questions
Related Lab Tools
 Biology
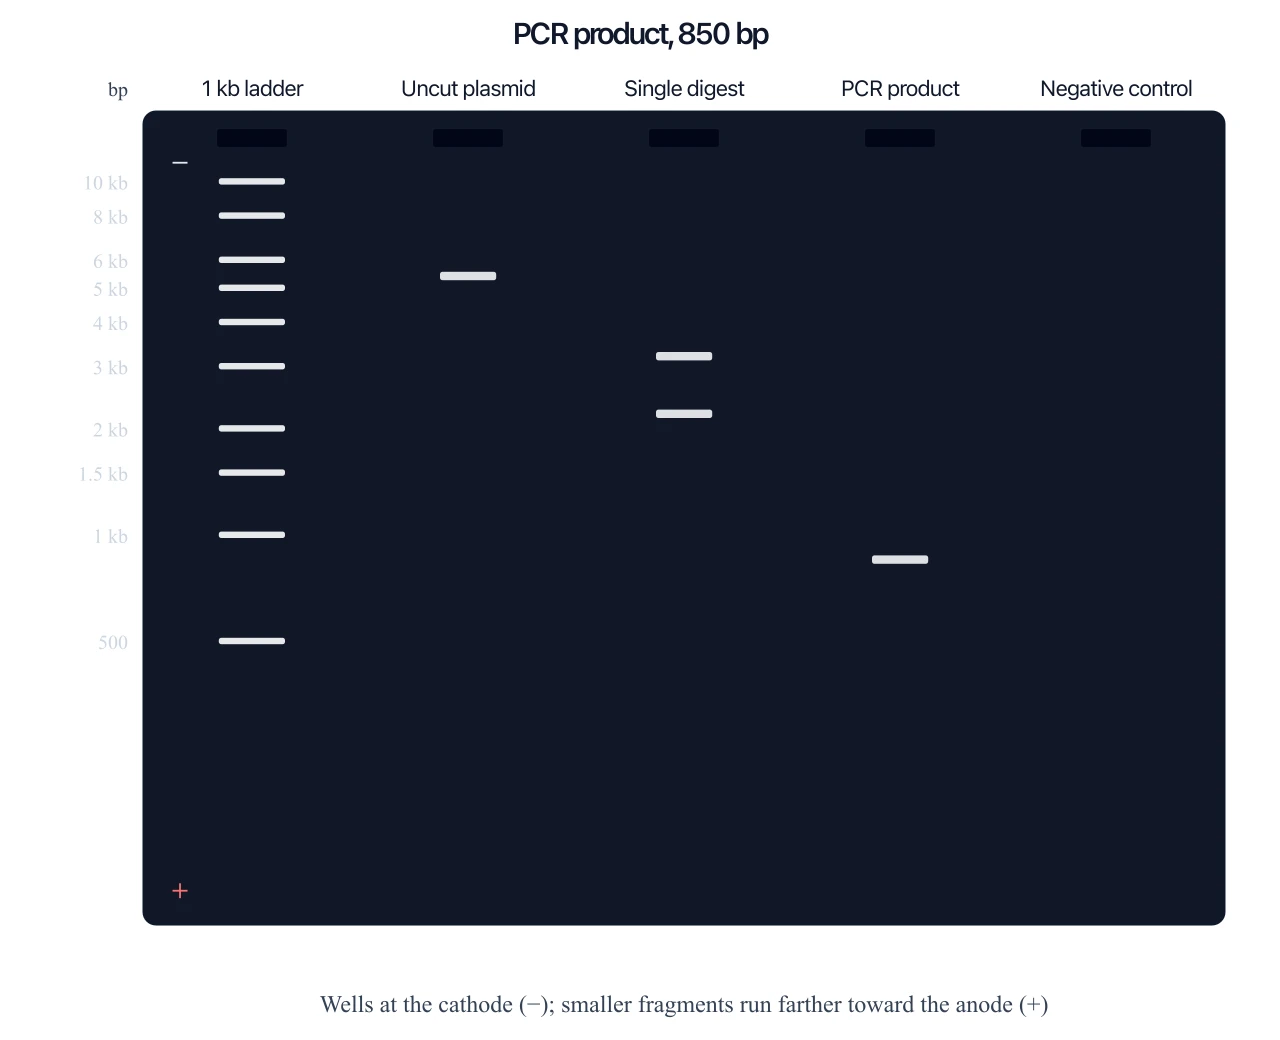
Gel Electrophoresis Diagram Generator
The product on a gel — lanes and sizes, not the denature–anneal–extend cycle.
 Biology
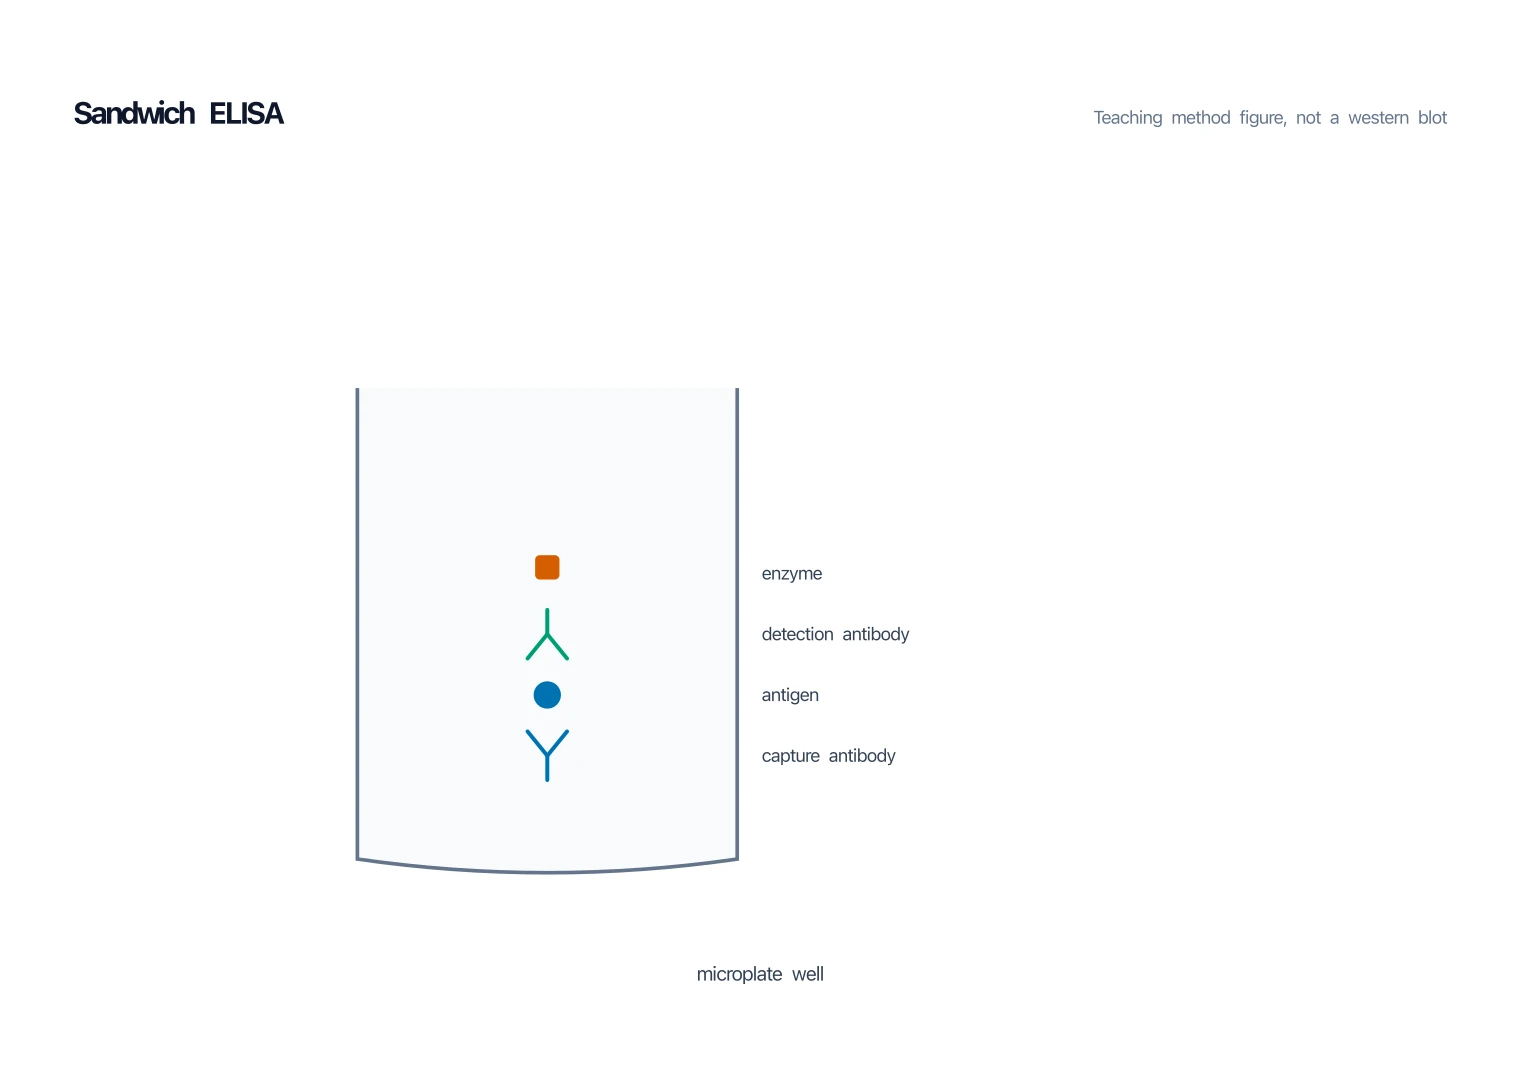
ELISA Diagram Generator
Another methods cartoon: sandwich well and antibody stack, not DNA cycling.
 Biology
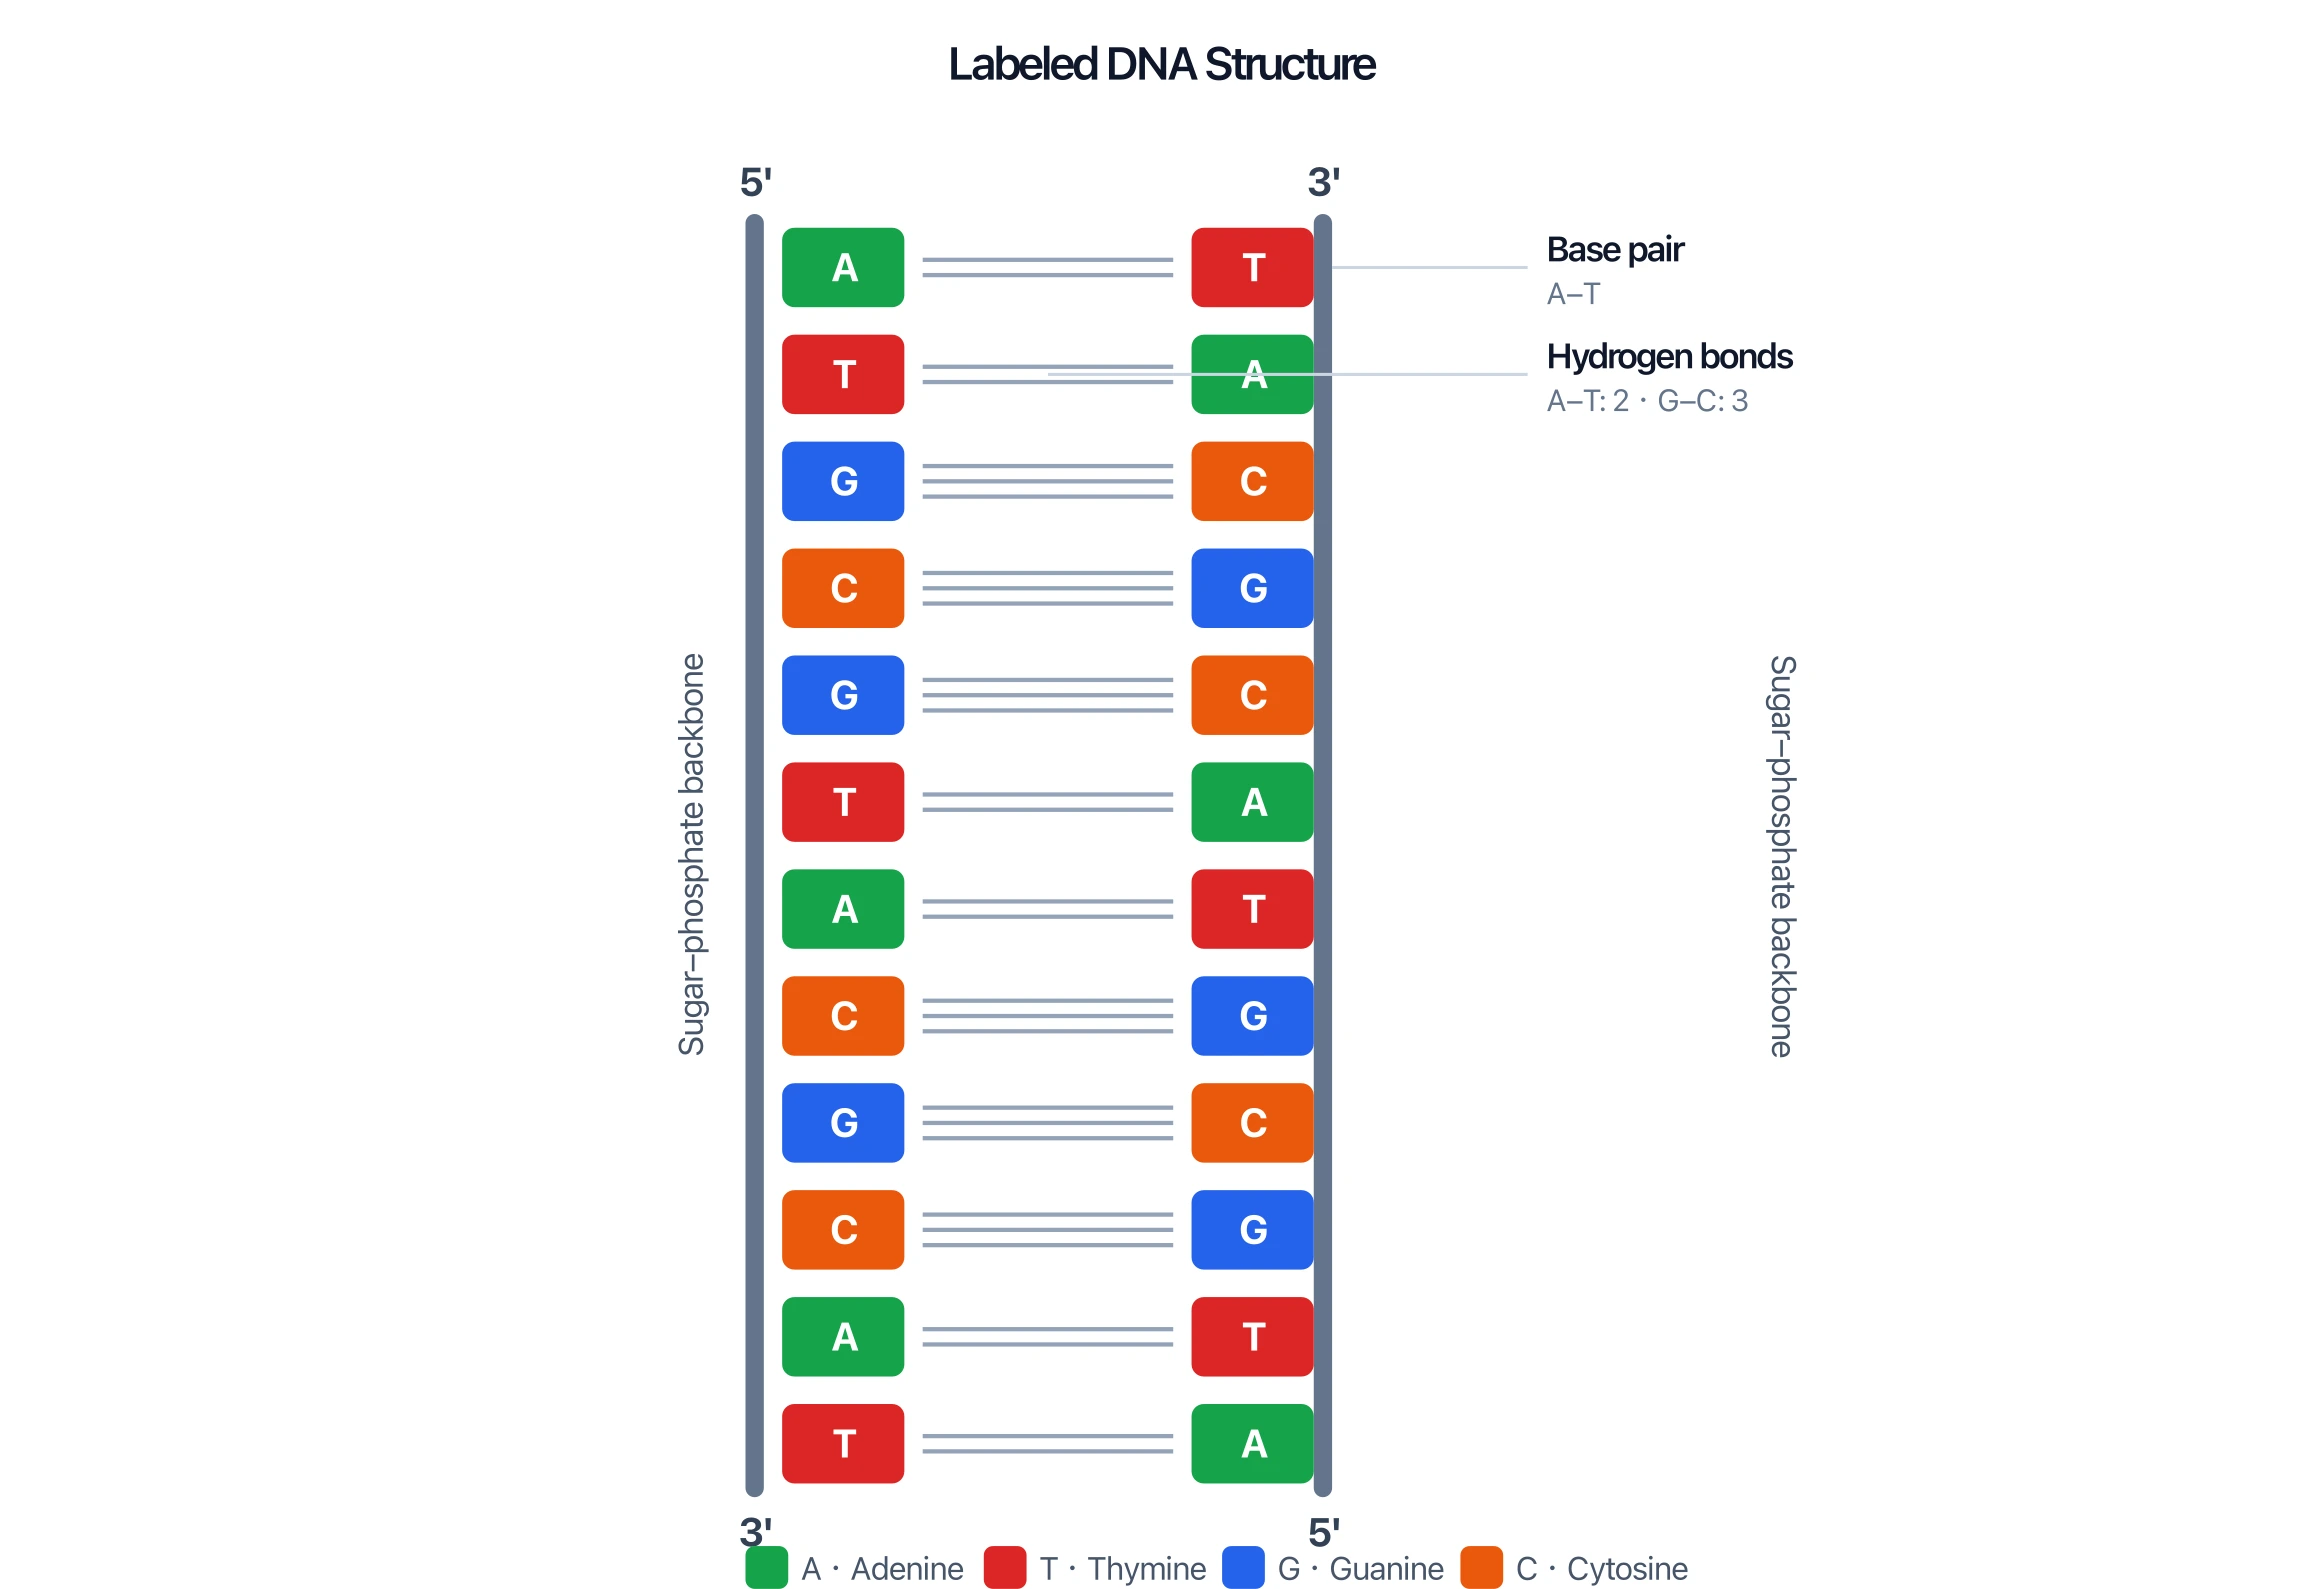
DNA Structure Diagram Generator
The helix, bases, and backbone — anatomy of the template, not the PCR cycle.