Signaling Pathway Diagram Generator receptor to nucleus
Generate signaling pathway diagrams from text: insulin to GLUT4, TGF-β/SMAD, MAPK/ERK, with membrane and nucleus layers. Includes exact reference diagrams.
Create Your Signaling Pathway Diagram
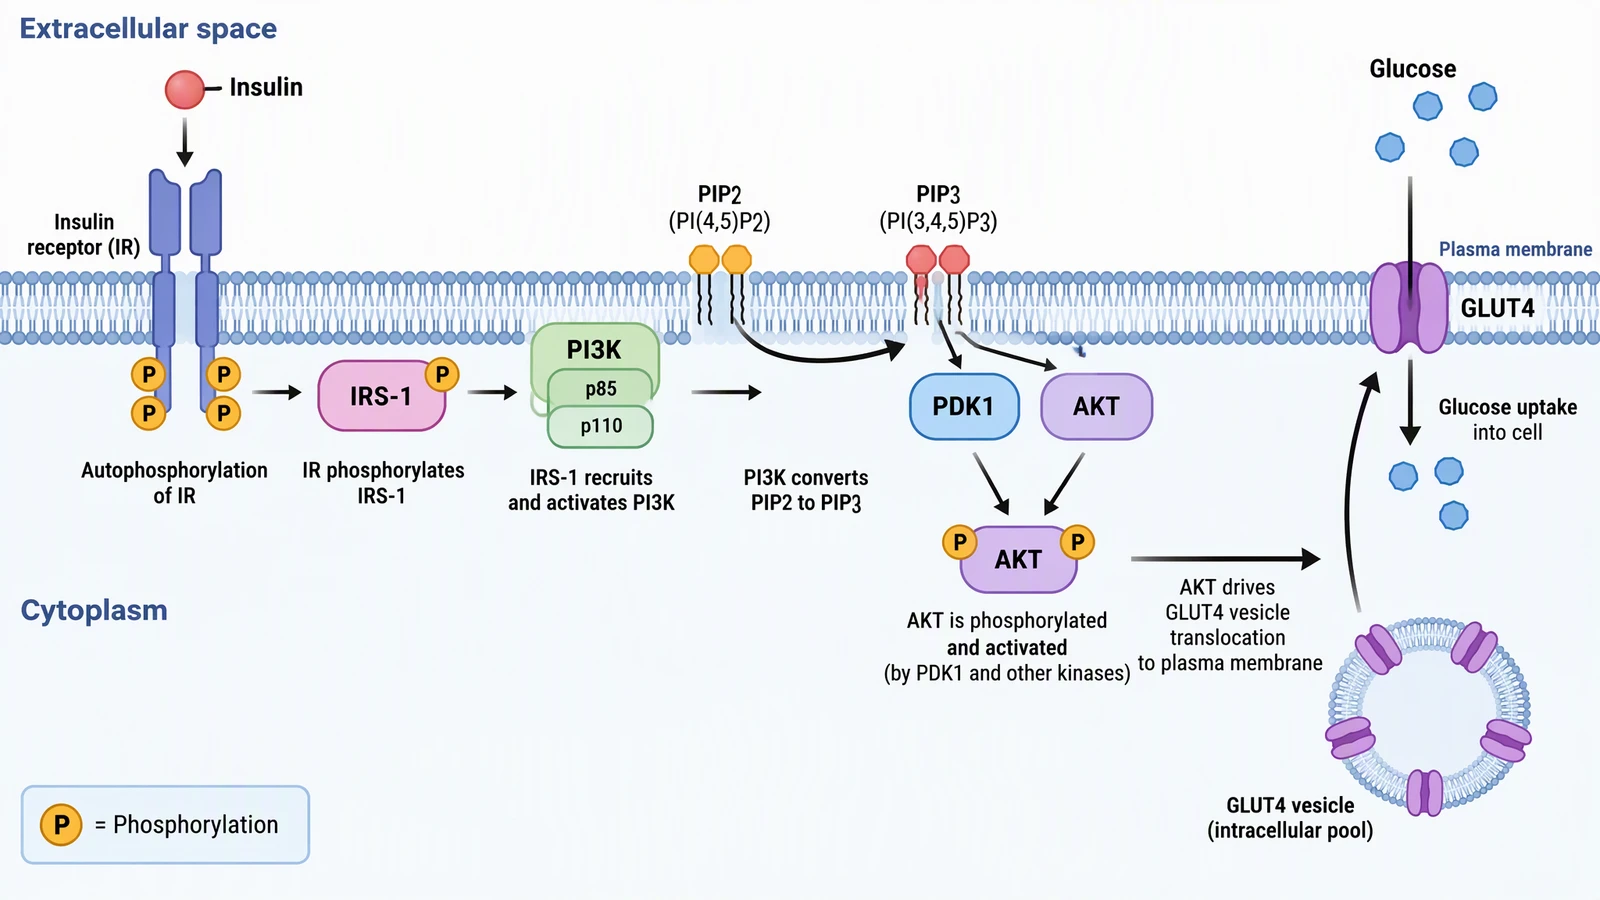 Example: Insulin to GLUT4View full size
Preview is free on this page ·
Your signaling pathway diagram will appear here
AI pathway diagrams are drafts. Check molecule order, compartments, and arrows before use.
Signaling Pathway Diagram Examples
Two exact reference diagrams drawn in code, plus three AI drafts with their known flaws noted. AI diagrams need human review.
Insulin signaling to GLUT4 (exact diagram)
Drawn in code, not by AI: receptor in the plasma membrane, then IRS-1, PI3K, PIP2 to PIP3, PDK1 and AKT at the membrane, and GLUT4 vesicles fusing to let glucose in. Seven numbered steps. A simplified PI3K/AKT route that leaves out AS160 (TBC1D4) between AKT and GLUT4, the MAPK branch, and feedback loops.
TGF-β / SMAD pathway into the nucleus (exact diagram)
Drawn in code: the ligand, TβRII phosphorylating TβRI, SMAD2/3 phosphorylation, the SMAD4 complex, passage through the nuclear pore and gene regulation. Receptor and complex stoichiometry are simplified (the active receptor unit is a heterotetramer); SMAD7 and non-SMAD branches are not shown.
Insulin to GLUT4 (AI schematic)
AI-generated. The molecule order and the activation arrows follow the pathway. Known flaws: PIP2 and PIP3 headgroups are drawn on the outer face of the membrane, while in the cell they face the cytoplasm; the PI3K arrow ends in empty space; the p85 and p110 boxes overlap; and the glucose path through GLUT4 is a thin line. AS160 between AKT and GLUT4 is not shown.
TGF-β / SMAD (AI schematic)
AI-generated. The order and the membrane, cytoplasm and nucleus layout follow the pathway. Known flaws: the receptors are drawn as a simple pair although the active unit is a heterotetramer; a T-bar glyph next to the receptor phosphorylation reads like inhibition although the step is activating, the DNA helix is clipped behind the target-genes box, and the numbered step boxes do not line up exactly with the drawings.
MAPK / ERK cascade (AI schematic)
AI-generated, second attempt. The first attempt used a prompt that did not name the kinase tiers or where RAS sits: it labeled RAF as MAPKK and left RAS unanchored in the cytoplasm. This image comes from a second, more specific prompt (shown here) that names RAF as MAPKKK, MEK as MAPKK, ERK as MAPK and puts RAS at the inner face of the plasma membrane. Known flaws: a P marker overlaps the GRB2 label, and the phosphorylation markers are not tied to a specific site.
Need the biology and drawing conventions first? Read our signal transduction pathway diagram guide for symbols, arrow types, and common mistakes. For anatomy and organ figures, try the medical illustration generator.
What a signaling pathway diagram has to show
A signaling pathway diagram follows a signal from a ligand or receptor to a cellular response. It answers three questions: in what order the molecules act, where each step happens (outside the cell, at the plasma membrane, in the cytoplasm, or in the nucleus), and what each arrow means (binding, phosphorylation, recruitment, or translocation). A figure that gets the order or the compartment wrong teaches the wrong biology, even if it looks polished.
The reference order for three common pathways
- Insulin: insulin binds the insulin receptor, which autophosphorylates and phosphorylates IRS proteins; IRS recruits PI3K; PI3K converts PIP2 to PIP3; PIP3 brings PDK1 and AKT to the membrane and AKT is activated; active AKT promotes GLUT4 vesicle translocation to the plasma membrane and glucose uptake.
- TGF-β/SMAD: the ligand binds the type II receptor, which recruits and phosphorylates the type I receptor; the type I receptor phosphorylates SMAD2 and SMAD3; these bind SMAD4; the complex moves into the nucleus and regulates target genes together with other DNA-binding proteins.
- MAPK/ERK: a growth factor activates a receptor tyrosine kinase; GRB2 and SOS activate RAS; RAS-GTP activates RAF (MAPKKK); RAF phosphorylates MEK (MAPKK); MEK phosphorylates ERK (MAPK); ERK enters the nucleus and activates transcription factors such as ELK1.
Exact diagrams vs AI illustration on this page
- Exact diagrams: the two reference diagrams in the gallery are drawn in code, so the order, the compartments and the arrow meanings are fixed. Use them as a check against any AI figure.
- AI illustration: the generator is good at a clean first draft with the right layout, membrane, and label style. It does not guarantee biological accuracy: it can swap kinase tiers, place a protein in the wrong compartment, or draw an activating step with an inhibitory-looking symbol.
- Have someone who knows the pathway review every figure before it goes into a thesis, paper, or lecture, and compare it with a primary source.
How to prompt for a correct pathway diagram
- Write the pathway as an ordered chain, for example IR to IRS-1 to PI3K to PIP3 to AKT to GLUT4, so the model does not invent the order.
- Name the compartments: extracellular space, plasma membrane, cytoplasm, nuclear envelope, nucleus.
- State the role of each step: binds, phosphorylates, recruits, translocates. Name kinase tiers where they matter (RAF as MAPKKK, MEK as MAPKK, ERK as MAPK).
- Ask for small P circles for phosphorylation and one arrow style for activation.
- Check every label and arrow against a primary source before use.
Frequently Asked Questions
Reference sources (checked October 2026)
Related Biology Tools
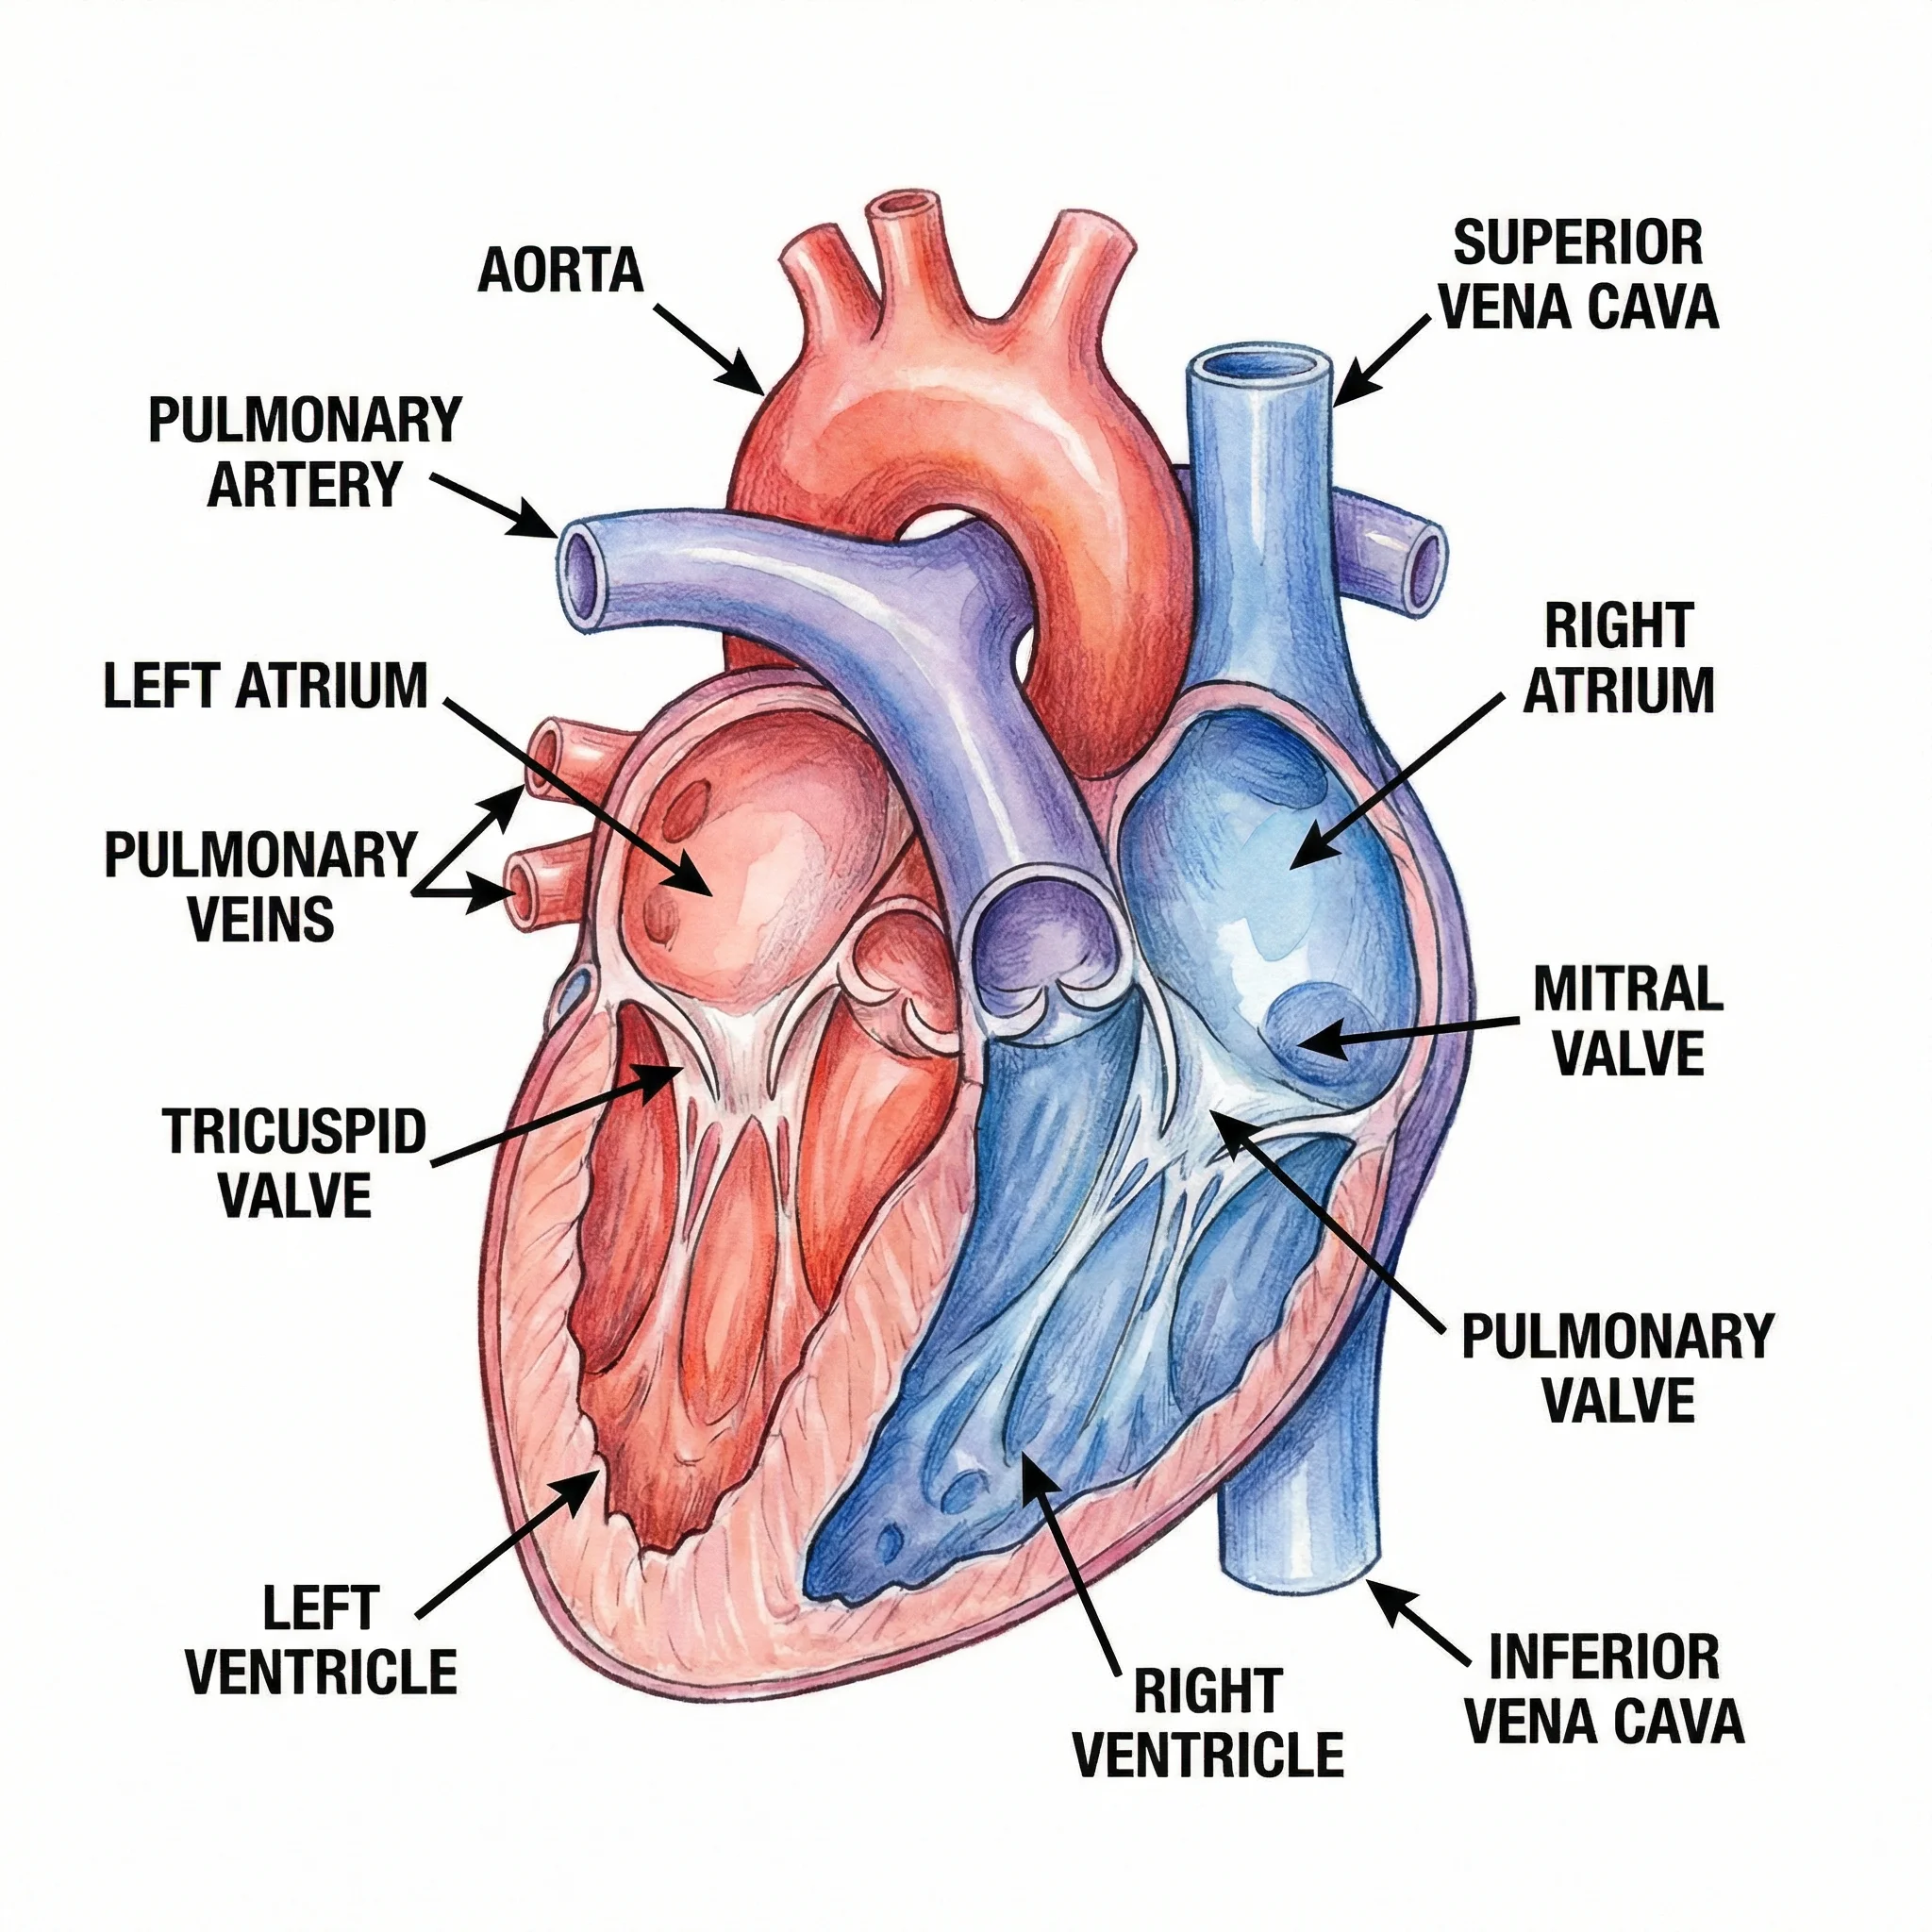 Medical
Medical Illustration Generator
Generate anatomy diagrams, organ systems, and healthcare visuals for medical education.
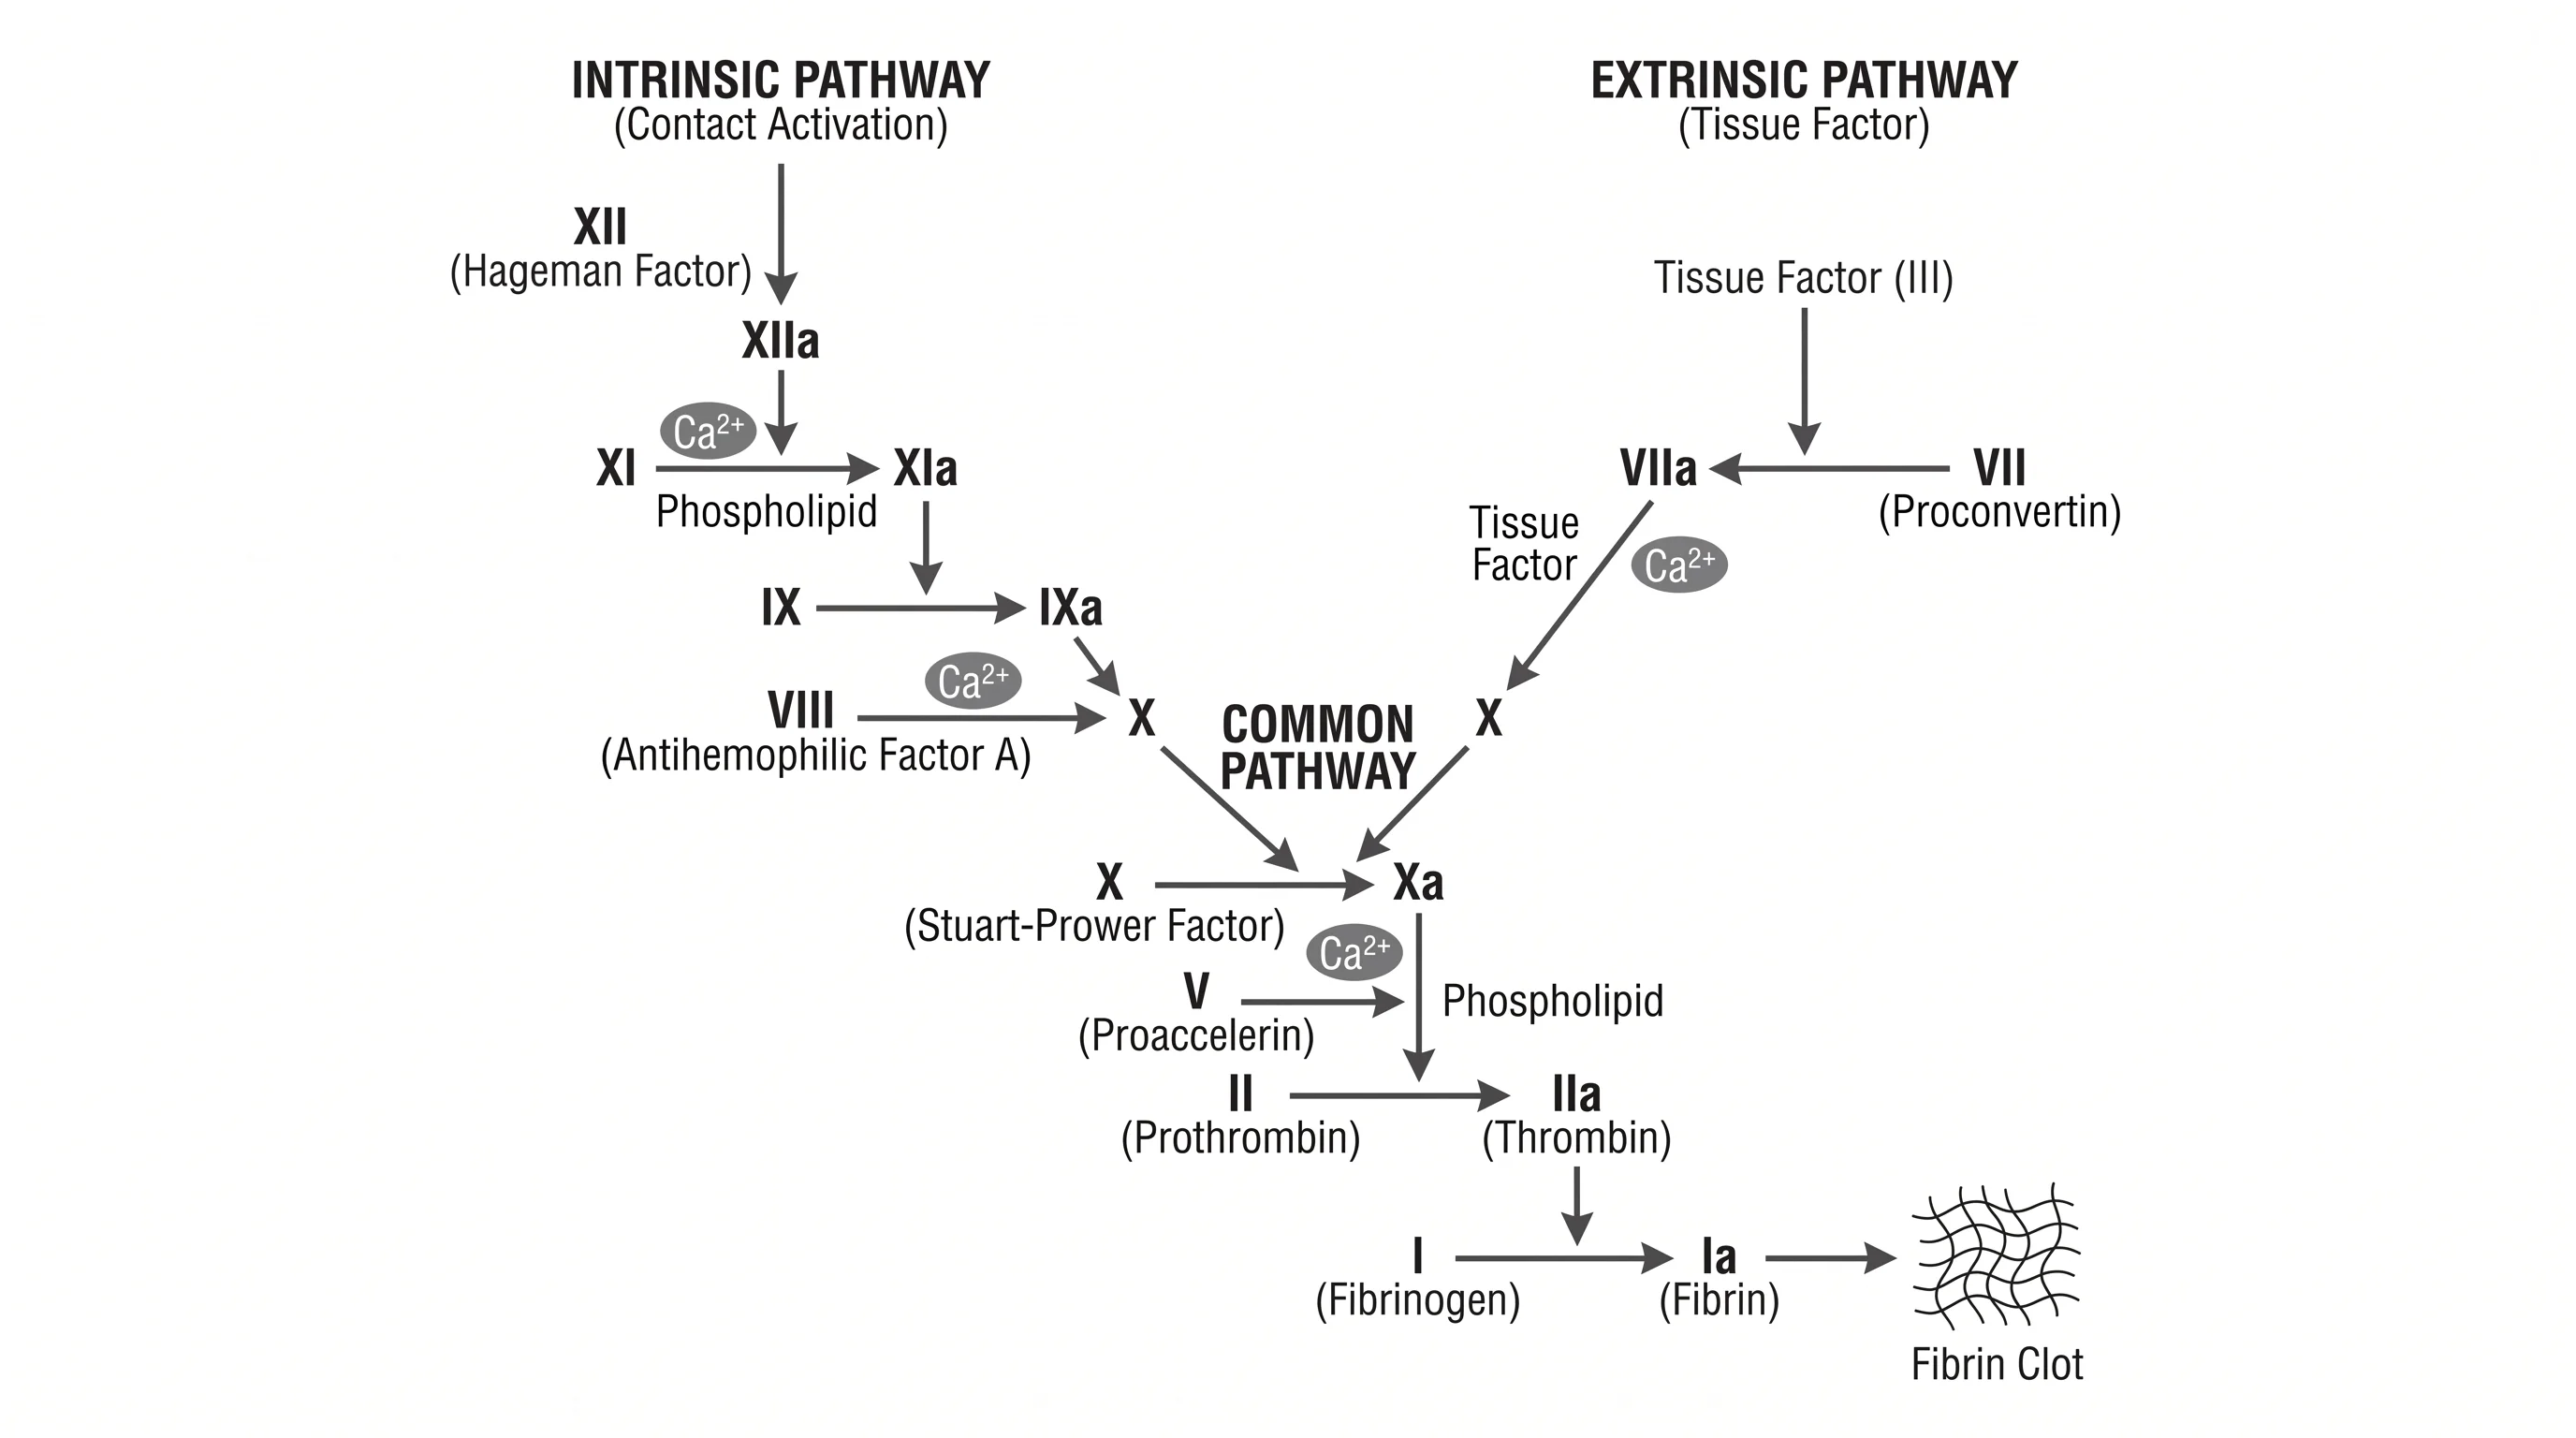 Medical
Coagulation Cascade Diagram Generator
Another cascade figure: labeled, blank, or simplified coagulation pathways.
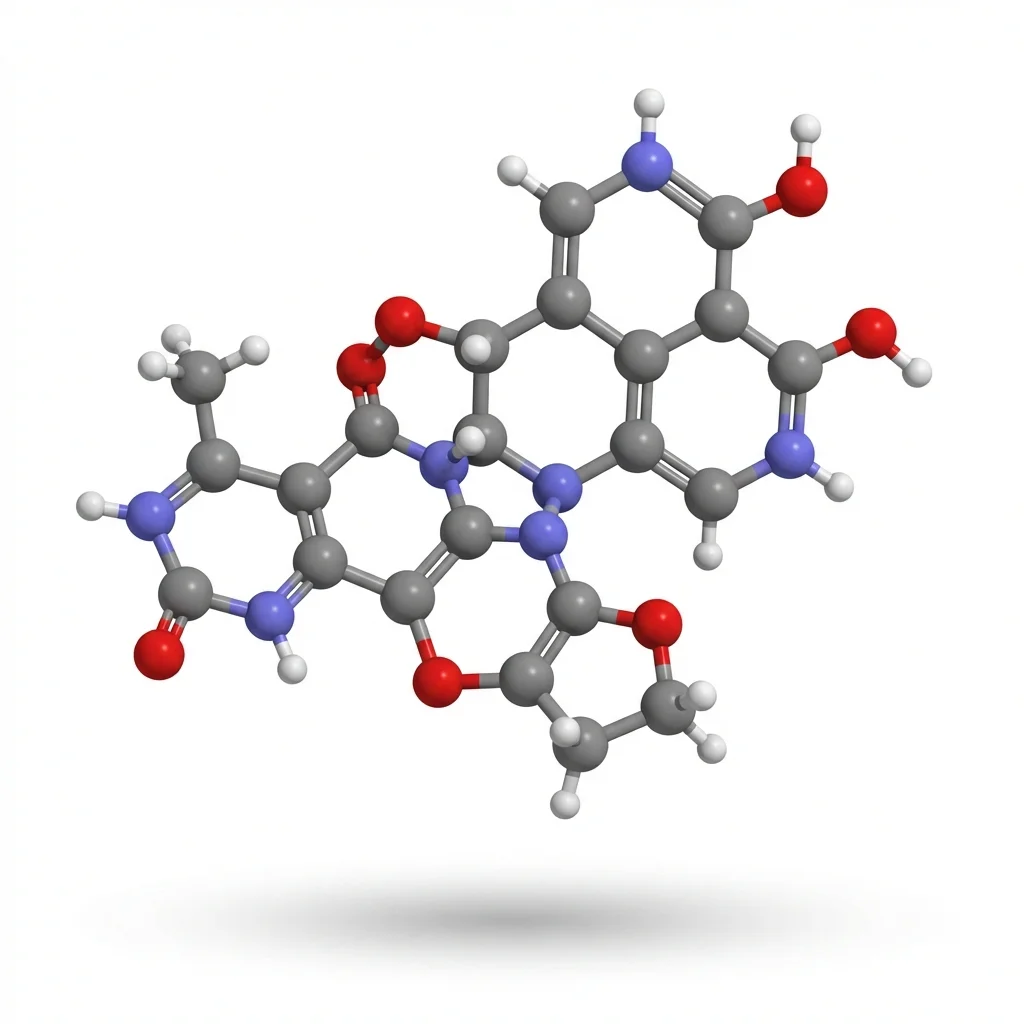 Research
AI Scientific Image Generator
Describe any lab or biology figure and generate a clean illustration.