Punnett Square Maker for Genetics Crosses
Make a Punnett square online for monohybrid (Aa × Aa) and dihybrid crosses. Type both parent genotypes for an exact, labeled square with genotype and phenotype ratios, or describe one for an AI illustration — then export SVG, free.
Enter both parent genotypes (e.g. Aa × Aa) — builds an exact, labeled Punnett square as SVG, free
Cross settings
Exact Punnett square, rendered as SVG.
1 AA : 2 Aa : 1 aa
3:1(dominant : recessive)
Monohybrid cross · 2×2 grid. Alleles are sorted dominant-first in every cell. Download an editable SVG for slides, reports, and worksheets.
Punnett Square Maker
Free to try ·
Your Punnett square will appear here
Describe the cross you want
Punnett Square Examples
Monohybrid, carrier, sex-linked, and dihybrid crosses
Monohybrid Cross (Aa × Aa)
The classic 2×2 cross — two heterozygous parents give a 1:2:1 genotype ratio and 3:1 phenotype ratio.
Carrier Cross (Cc × Cc)
Two carriers of a recessive allele — each child has a 25% chance of being affected (cc).
Trait Inheritance
How a real human trait passes on — the square predicts normal, carrier, and affected outcomes.
Sex-Linked Cross
Sex-linked inheritance — outcomes differ for sons and daughters in an X-linked cross.
Genotype & Phenotype Reference
A notation refresher — dominant vs recessive alleles and how genotype maps to phenotype.
Dihybrid Cross (4×4)
Two genes at once — a 4×4 grid of 16 combinations giving the famous 9:3:3:1 phenotype ratio.
What is a Punnett square?
A Punnett square is a grid that predicts the possible genotypes of offspring from a genetic cross. You list one parent’s gametes across the top and the other parent’s gametes down the side, then fill each cell by combining the row and column alleles. Each cell is one equally likely offspring outcome, so the grid shows both the genotype combinations and how often each is expected. Named after geneticist Reginald Punnett, it is the standard tool for working out inheritance in biology class — and this maker fills, labels, and ratios the square for you, exactly, every time.
Alleles, dominant vs recessive, genotype vs phenotype
- An allele is one version of a gene; you inherit one from each parent. Alleles are written as letters — a capital letter for the dominant allele (A) and the same letter in lowercase for the recessive allele (a).
- A dominant allele is expressed whenever it is present; a recessive allele only shows when both copies are recessive (aa). So AA and Aa look the same outwardly, while aa looks different.
- The genotype is the allele pair itself (AA, Aa, or aa). The phenotype is the observable trait that genotype produces (for example, dominant vs recessive appearance). One phenotype can come from more than one genotype, which is why the two ratios differ.
Two ways to make a Punnett square here
- Precise mode: type both parent genotypes (for example Aa and Aa, or AaBb and AaBb). The tool derives each parent’s gametes, fills every cell with the correctly combined and ordered genotype, and computes the genotype and phenotype ratios automatically — accurate every time, with nothing to align by hand.
- AI illustration mode: describe the cross in plain English and the tool generates a polished, presentation-ready illustration with color-coded results and labels.
- Use Precise mode when correctness matters (homework, exams, lab reports); use AI mode when you want a styled graphic for slides or a handout.
Monohybrid vs dihybrid crosses
A monohybrid cross tracks one gene, so each parent has two alleles and produces two gamete types — the square is 2×2 with four cells. The textbook example is Aa × Aa, which yields a 1:2:1 genotype ratio (1 AA : 2 Aa : 1 aa) and a 3:1 phenotype ratio (dominant : recessive). A dihybrid cross tracks two genes at once. Each parent like AaBb produces four gamete types (AB, Ab, aB, ab) by combining one allele from each gene, so the square becomes 4×4 with sixteen cells. The dihybrid AaBb × AaBb gives the classic 9:3:3:1 phenotype ratio. This maker builds both the 2×2 and 4×4 squares from your genotypes.
How to use the Punnett square maker
- Enter the Parent 1 genotype — two letters for a monohybrid cross (Aa) or four for a dihybrid (AaBb).
- Enter the Parent 2 genotype using the same gene letters so the cross is valid.
- The tool derives the gametes, fills every cell with the combined offspring genotype (alleles sorted dominant-first, e.g. Aa not aA), and reads out the genotype and phenotype ratios.
- Download a clean, editable SVG to drop into a worksheet, slide, or report — or switch to AI mode for a styled illustration.
Genotype and phenotype ratios for genetics class
The two ratios a Punnett square produces are exactly what most genetics questions ask for. The genotype ratio counts how many cells fall into each allele combination — for Aa × Aa that is 1 AA : 2 Aa : 1 aa. The phenotype ratio groups genotypes by the trait they show: because both AA and Aa display the dominant trait, Aa × Aa gives a 3:1 dominant-to-recessive split. For a dihybrid cross the phenotype ratio is 9:3:3:1. Because this maker tallies the ratios directly from the filled grid, the numbers always match the square you see — handy for checking homework, building test-prep examples, or teaching Mendelian inheritance.
Frequently Asked Questions
Related Biology Tools
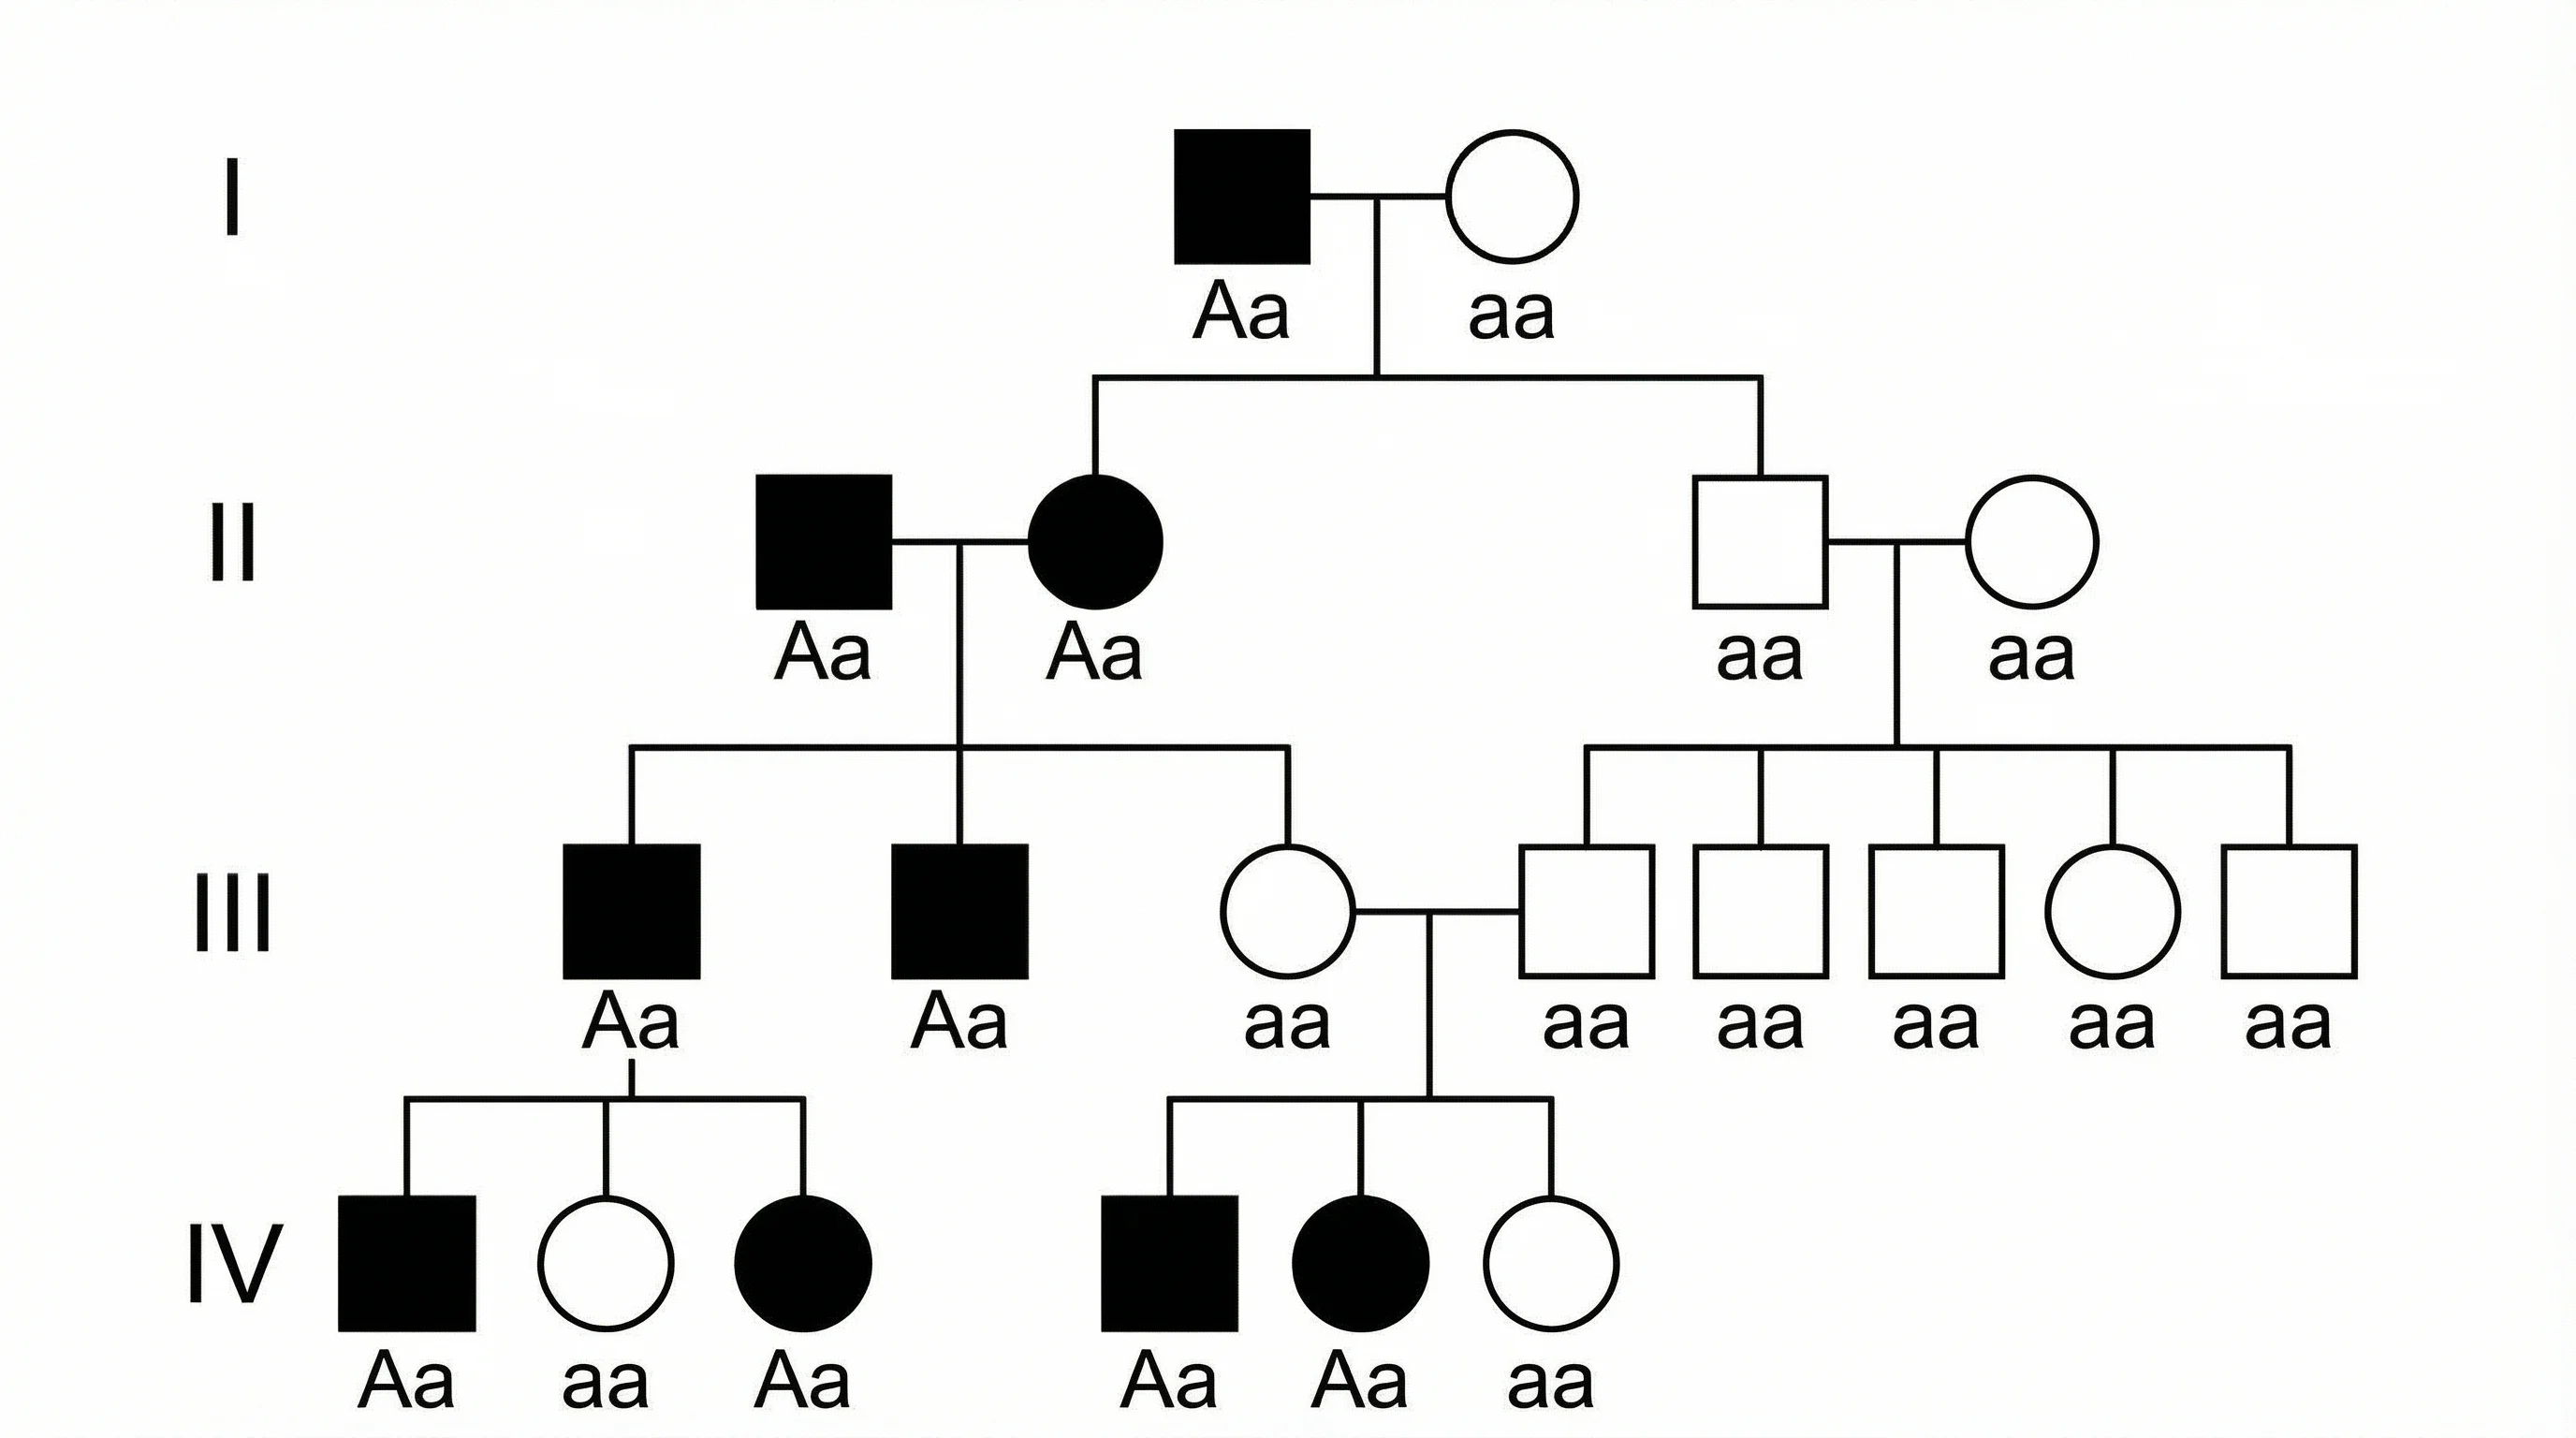 Biology
Pedigree Chart Maker
Map inheritance across generations with a clear, labeled pedigree chart.
 Biology
Mitosis Diagram Generator
Illustrate the phases of mitosis with a clean, labeled cell-division diagram.
ResearchAI Scientific Image Generator
Create publication-ready figures and diagrams for biology and research.