Pedigree Chart Maker for Inheritance Charts
Make a genetics pedigree chart with standard symbols — squares for males, circles for females, filled shapes for affected individuals, and carrier notation. Describe the family and inheritance pattern, and the AI draws a clear multi-generation chart for biology class, counseling, or research.
Pedigree Chart Generator
Free to try ·
Your pedigree chart will appear here
Describe the family and click Generate
Pedigree Chart Examples
Genetics pedigrees covering autosomal, X-linked, dominant, and recessive inheritance
Autosomal Recessive Inheritance
A recessive trait can skip generations: two unaffected carrier parents (Aa) produce an affected child (aa).
X-Linked Recessive Pattern
The classic hemophilia or color-blindness pattern: carrier mothers pass the trait mainly to their sons.
Autosomal Dominant Inheritance
A dominant trait shows up in every generation, and each affected child has at least one affected parent.
Sickle Cell Trait Pedigree
A real-world example: two sickle-cell-trait carriers (HbA/HbS) can have a child with sickle cell anemia (HbS/HbS).
Royal Family Hemophilia
The famous historical pedigree tracing hemophilia from Queen Victoria through the British, Spanish, and Russian royal lines.
Pedigree Symbols Reference
A full legend of the standard pedigree symbols — handy to keep beside any chart you build.
What is a pedigree chart?
A pedigree chart is a diagram that maps how a specific trait or genetic condition is inherited across the generations of a family. It is the family tree of genetics: each individual is drawn as a symbol, partnerships and offspring are joined by lines, and shaded symbols mark who is affected. Geneticists, genetic counselors, and biology students use pedigrees to see how a trait passes from parents to children and to work out the underlying inheritance pattern — autosomal or X-linked, dominant or recessive. Describe the family here and the generator draws a clean, standard-symbol chart for you.
Standard pedigree symbols
- Square = a male individual; circle = a female individual.
- Filled (shaded) shape = an individual affected by the trait or condition; an empty shape = unaffected.
- Half-filled shape = a carrier of a recessive trait (heterozygous, one copy of the allele).
- Circle with a center dot = a carrier female for an X-linked recessive trait.
- Horizontal line connecting a square and a circle = a mating or partnership.
- Vertical line dropping from that pair = their offspring, with siblings hung along a horizontal sibship line.
- A diagonal line through a symbol = a deceased individual; a double horizontal line = a consanguineous (related) mating.
Reading generations and relationships
Generations are stacked top to bottom and labeled with Roman numerals — I for the oldest generation, then II, III, and so on. Within each generation, individuals are numbered left to right with Arabic numerals, so any person can be named precisely (for example, II-3). The arrow or "P" often marks the proband, the individual who first brought the family to attention. Reading a pedigree means following these lines: horizontal lines join mates, vertical lines connect parents to children, and the sibship line groups brothers and sisters. Once the structure is clear, the pattern of shaded symbols across the generations tells you how the trait is being inherited.
Autosomal vs X-linked, dominant vs recessive
Pedigree analysis sorts a trait along two axes. On the chromosome axis, autosomal traits are carried on the non-sex chromosomes and affect males and females about equally, while X-linked traits sit on the X chromosome and show a sex bias. On the expression axis, a dominant allele shows its effect with a single copy, while a recessive allele must be present in both copies to be expressed. Combining them gives the classic patterns: autosomal dominant traits appear in every generation and every affected child has an affected parent; autosomal recessive traits can skip generations, with two unaffected carrier parents producing an affected child; X-linked recessive traits affect far more males than females, never pass father to son, and reach sons through carrier mothers; X-linked dominant traits pass from an affected father to all of his daughters but none of his sons. Mitochondrial inheritance is a separate case — passed only through the maternal line to all children.
How to build and analyze a pedigree
- Start with the proband and work outward, adding parents, partners, siblings, and children.
- Use the standard symbols consistently — squares and circles, with shading for affected and half-shading for carriers.
- Label each generation with a Roman numeral down the left edge, and number individuals left to right within each row.
- Join mated pairs with a horizontal line and drop a vertical line to their offspring on a shared sibship line.
- Mark affected, carrier, and deceased individuals, and add genotypes (such as Aa or X^H X^h) if the pattern is known.
- Read the finished chart: count how many generations show the trait and whether males and females are affected equally to deduce the inheritance pattern.
Pedigrees in genetics class and counseling
In a genetics classroom, pedigrees are the standard way to teach inheritance and a favorite exam format: students are given a family chart and asked to infer whether a trait is autosomal or X-linked, dominant or recessive, and to calculate the odds that a future child is affected. In the clinic, genetic counselors build family pedigrees to estimate the risk of an inherited condition, identify relatives who may benefit from testing, and explain the pattern to a family in a clear visual form — often annotated with age of onset, test results, and severity. This maker produces accurate, legible charts for both uses: drop one into a worksheet, a study guide, slides, or a counseling handout.
Frequently Asked Questions
Related Diagram Tools
 Research
Tree Diagram Generator
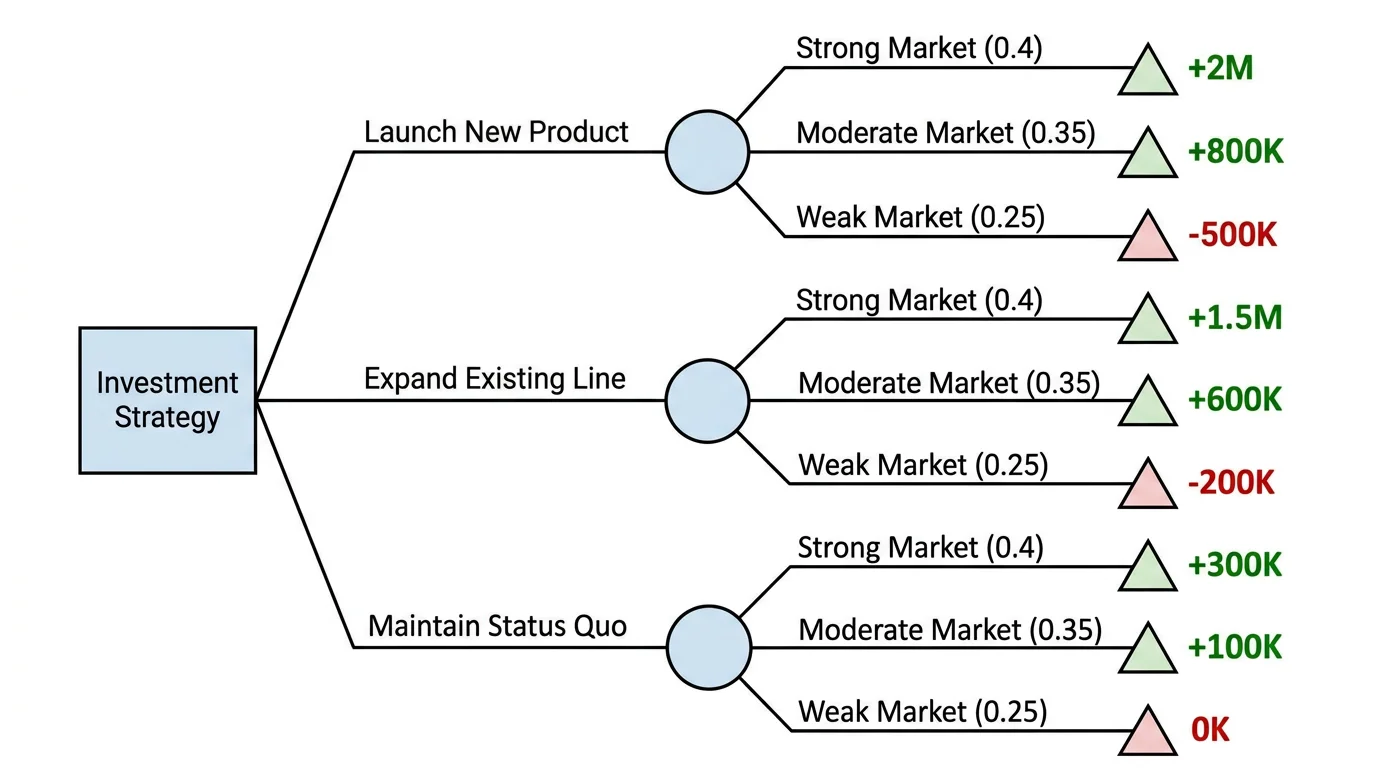
Build branching tree diagrams for probability, hierarchies, and decision paths.
 Biology
Life Cycle Diagram Generator
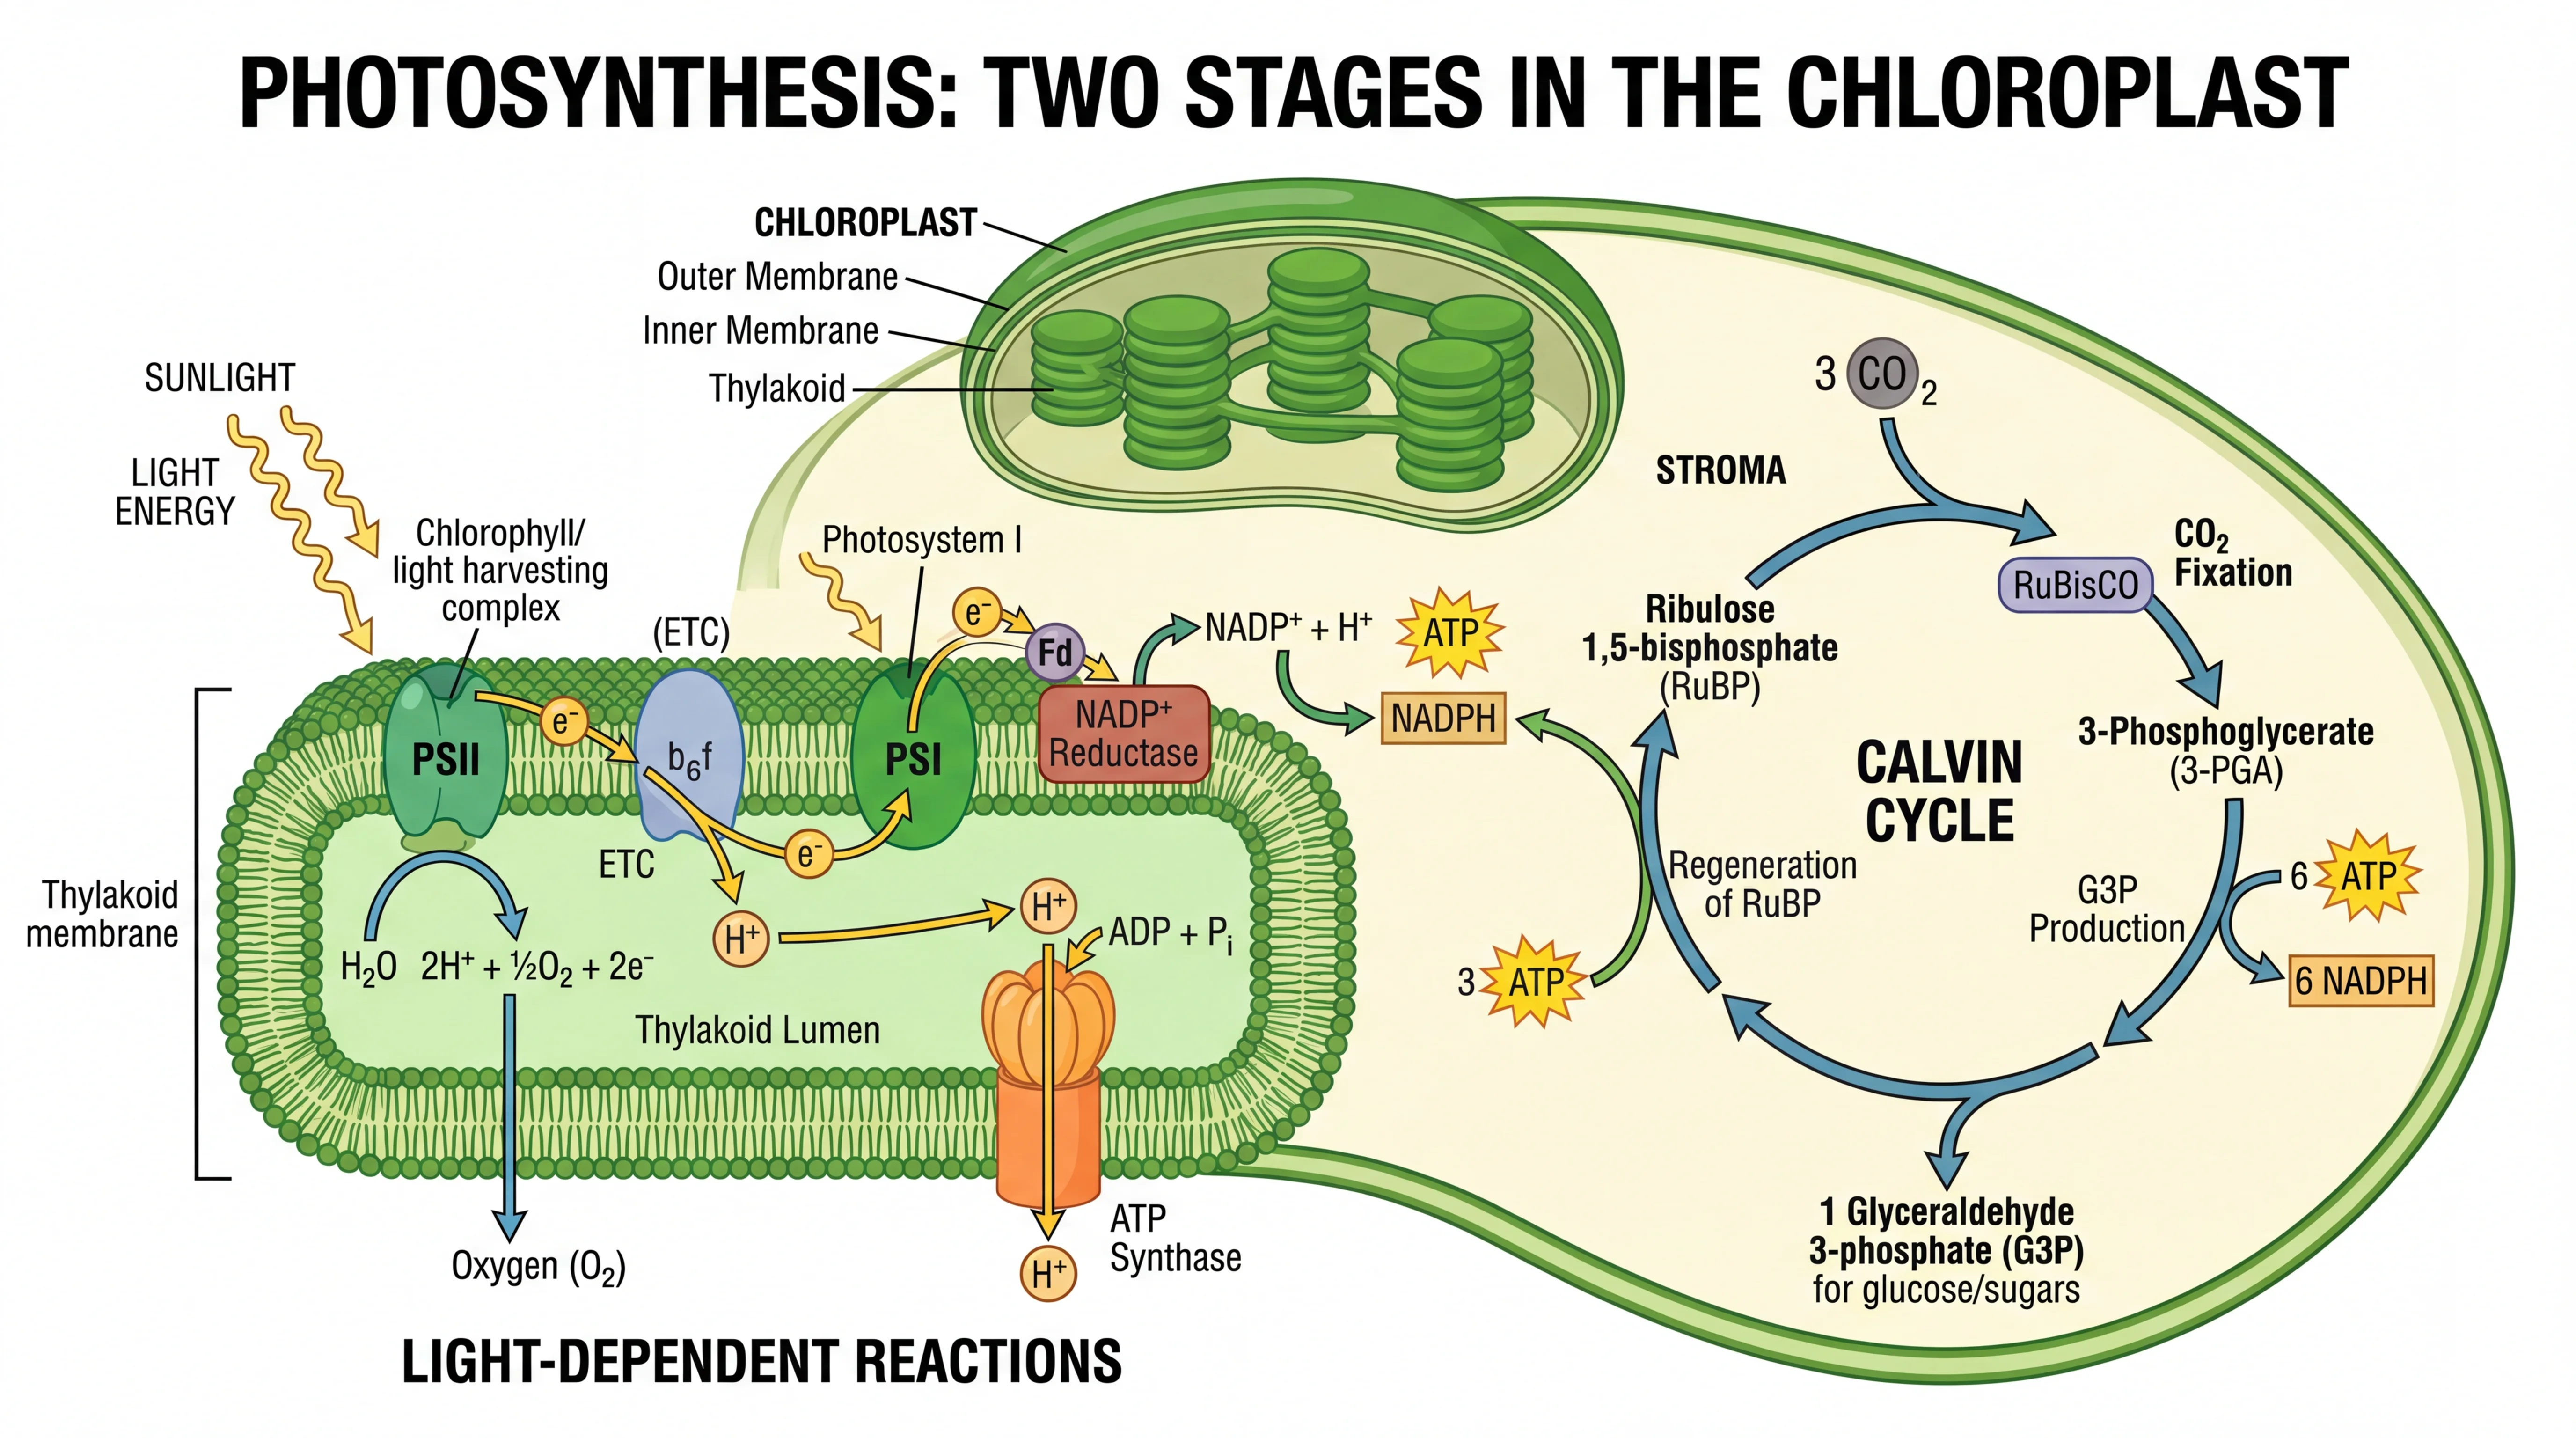
Draw labeled life cycle diagrams for plants, animals, and biological processes.
 Research
AI Flowchart Generator
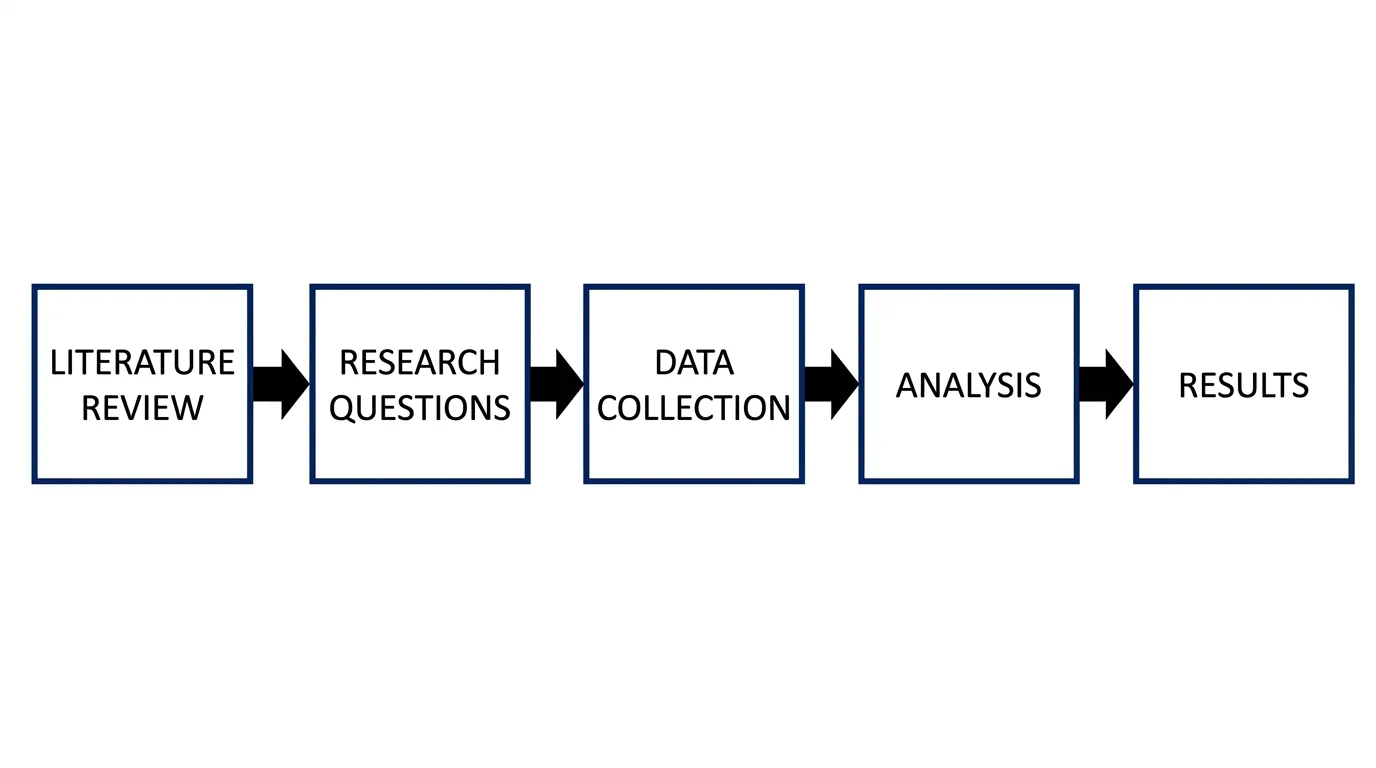
Turn a process into a clean flowchart with labeled steps and decision points.