Graphical Abstract Maker for Journal Submissions
Make a graphical abstract for your research paper in minutes. Describe your study and the AI generates a publication-quality, journal-ready illustration — sized for Elsevier, Nature, and Cell submissions. Free to try.
AI Graphical Abstract Generator
Free to try ·
Your graphical abstract will appear here
Generate the illustration here, then add your text labels in a vector or slide editor
Graphical Abstract Examples
Journal-style summaries across biomedicine, ML, environment, and materials
Drug Discovery Pipeline
A left-to-right pipeline — screening to assays to trials — the classic methodology-to-result flow.
Machine Learning Workflow
Input on the left, model in the middle, prediction on the right — a clean ML summary.
Gene Expression Study
A molecular pathway with the key finding boxed — ideal for a Cell-style submission.
Clinical Trial Results
Treatment vs control, a comparison chart, and the headline result — a NEJM-style layout.
Environmental Impact
A top-to-bottom cause-and-effect story — source, mechanism, and impact, in earth tones.
Nanomaterials Application
Fabrication to characterization to application — a materials-science narrative in three panels.
What is a graphical abstract?
A graphical abstract is a single, self-contained image that visually summarizes the main finding of a research paper. Many journals now display it alongside the title and text abstract in search results, tables of contents, and on social media, where it is often the first — and sometimes only — thing a reader sees. A strong graphical abstract communicates the core message at a glance: what you studied, what you found, and why it matters. This maker is an AI graphical abstract generator: you describe your study in plain language and it produces a clean, publication-style illustration you can refine and download.
How to make a graphical abstract with AI
- Summarize your study in a sentence or two — the system, the method, and the single key result you want to lead with.
- Describe the visual flow you want, usually left-to-right (input → method → result) or top-to-bottom (cause → mechanism → effect).
- Pick an aspect ratio that matches your target journal (16:9 landscape suits Elsevier; 1:1 works well for social and many other journals).
- Generate, review, and refine the prompt until the layout and emphasis are right, then download the image to add your own text labels.
What makes a good graphical abstract
The best graphical abstracts are simple, focused, and readable at thumbnail size. Show one clear take-home message rather than every result in the paper. Use a single, obvious direction of flow so the reader's eye moves from setup to conclusion without effort. Keep the palette limited and consistent, leave generous white space, and make sure any element would still be legible when shrunk to a small icon in a journal's table of contents. Avoid clutter, redundant decoration, and dense text — a graphical abstract is a visual summary, not a second figure.
Journal requirements: size, format, and clarity
Always check your target journal's author guidelines, because specifications vary. Elsevier, for example, recommends a landscape image around 1328 × 531 pixels (a roughly 2.5:1 ratio) at a minimum of 531 pixels high. Many publishers ask for a minimum resolution near 300 dpi and accept TIFF, EPS, PDF, JPEG, or PNG. Almost all require that the graphical abstract be original, contain no previously published material, and stay clear and legible at reduced size. Generate at the aspect ratio closest to your journal's spec, then crop or resize to the exact dimensions before submission.
Adding and editing text labels
AI image generation excels at composition, color, and scientific imagery, but on-image text can render imperfectly, so this tool focuses on producing a clean illustration rather than baking in labels. The reliable workflow is to generate the artwork here, then add your titles, panel captions, and annotations afterward in a vector editor or slide tool. That keeps the text crisp and lets you match the exact terminology, fonts, and abbreviations your manuscript uses — and makes last-minute wording changes painless during revision.
A free graphical abstract maker for researchers
Designing a graphical abstract by hand can take hours of fiddling in illustration software, and commissioning one can be expensive. This free graphical abstract generator turns a description of your study into a journal-style draft in seconds, so you can iterate on ideas quickly before a submission deadline. It suits researchers, graduate students, and lab groups across biomedicine, life sciences, chemistry, materials, environmental science, and computational fields — anyone who needs a clear visual summary of a paper without starting from a blank canvas.
Frequently Asked Questions
Related Research Tools
 Visualization
AI Infographic Generator
Create clean, shareable infographics from your data and key points.
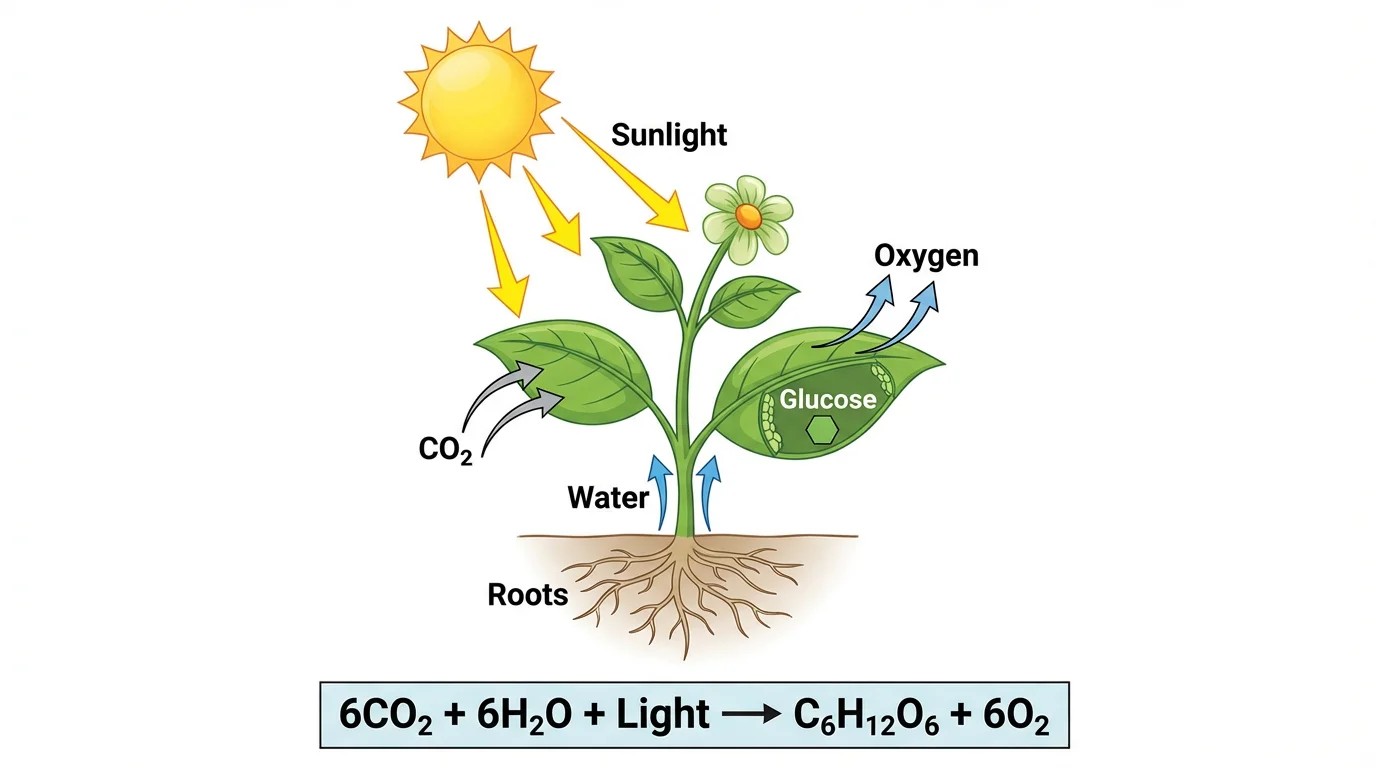 Biology
Photosynthesis Diagram Generator
Make labeled photosynthesis diagrams showing inputs, outputs, and the chloroplast.
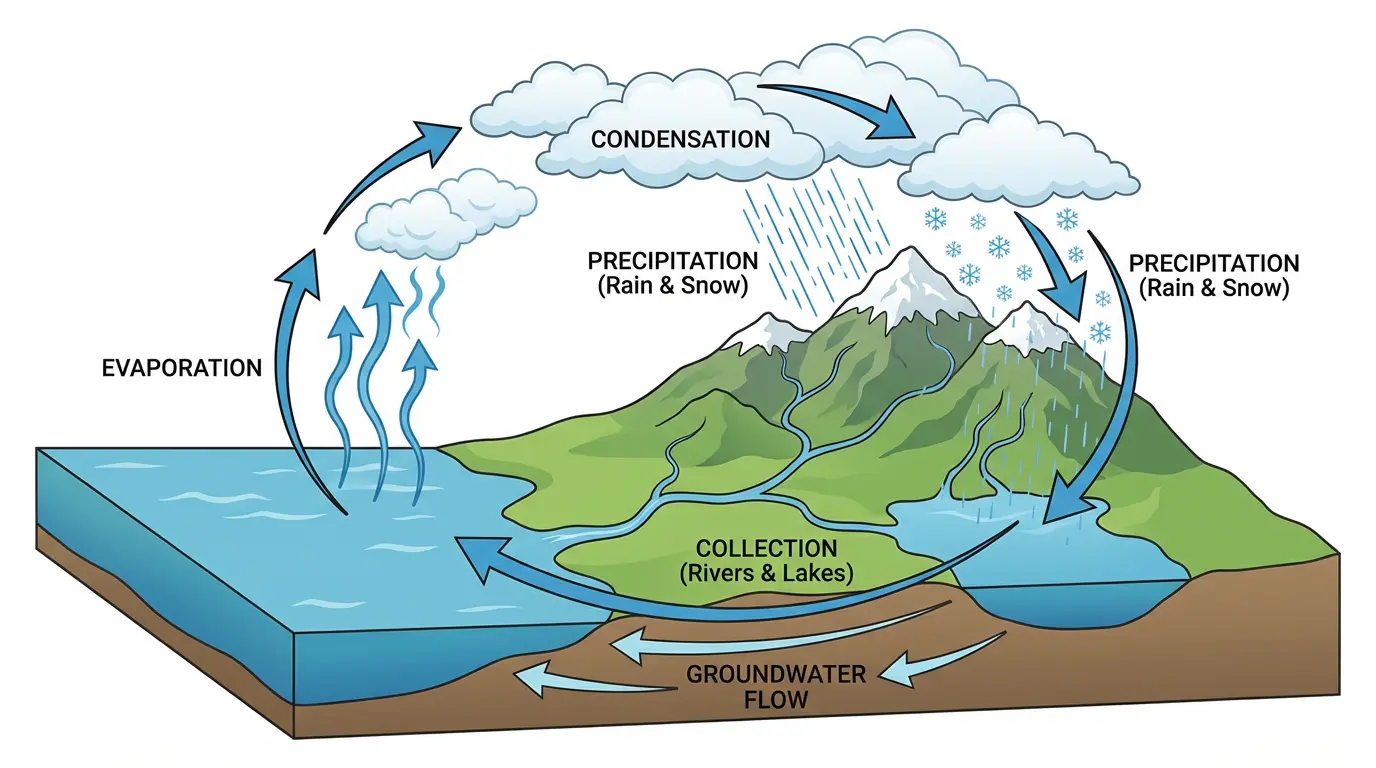 Earth Science
Water Cycle Diagram Generator
Draw a labeled water cycle with evaporation, condensation, and precipitation.