Energy Pyramid Generator with the 10% Rule
Make an energy pyramid from producer energy and a transfer efficiency, or from your own data. Shows kcal or kJ per level and energy not passed up. PNG and SVG.
The 10% rule is an average. Real transfers usually fall between about 5% and 20%. Allowed here: 1% to 30%.
| Level | Energy (kcal/m²/yr) | From level below | Not passed up |
|---|---|---|---|
| Tertiary consumers | 10 | 10% | 10 |
| Secondary consumers | 100 | 10% | 90 |
| Primary consumers | 1,000 | 10% | 900 |
| Producers | 10,000 | - | 9,000 |
Energy Pyramid Examples
Each pyramid below is computed by the tool above from the numbers in its description.
Silver Springs Energy Pyramid
Odum (1957) field data as reproduced in OpenStax Biology 2e. Efficiencies computed by the tool.
Worked examples
What an energy pyramid shows
An energy pyramid is a diagram of how much usable energy sits at each trophic level of a food chain over a year. Producers, such as plants and algae, form the wide base because they capture sunlight. Each step up is a group of consumers that gets its energy by eating the level below. The pyramid always narrows going up, because only part of the energy at one level ends up in the next. Most of it is spent on respiration and released as heat (the largest part of the energy not passed up), and some is never eaten or passes to decomposers as waste and dead matter. That loss is why food chains rarely have more than four or five levels, and why a hawk needs a far larger territory than a rabbit.
How the 10% rule is calculated
- The 10% rule says that about 10 percent of the energy at one trophic level is passed to the next. To build the pyramid, multiply the energy of the level below by the transfer efficiency. With 10,000 kcal/m²/yr in the producers and 10 percent transfer, the primary consumers get 1,000, the secondary consumers 100 and the tertiary consumers 10.
- The efficiency of one step is the energy in the upper level divided by the energy in the level below, times 100. The energy that is not passed up is the difference between the two. Use the first mode of this tool when a question gives you the producer energy and a percentage, and the second mode when it gives you the energy of every level.
- The 10% figure is an average, not a law. Measured transfer efficiencies between trophic levels usually fall between roughly 5% and 20%, and they differ between ecosystems and between warm-blooded and cold-blooded consumers. That is why the efficiency here is editable from 1% to 30%.
Worked example: Silver Springs, Florida
- Silver Springs is the classic field measurement behind many textbook energy pyramids. Howard T. Odum studied the spring and its river in the 1950s and reported the energy flow of each trophic level in kcal/m²/yr. The values loaded by the example button are the ones printed in Figure 46.10 of OpenStax Biology 2e (Clark, Douglas and Choi, 2018), which reproduces Odum's data: producers 20,810, primary consumers 3,368, secondary consumers 383 and tertiary consumers 21. Decomposers, at 5,060, are shown in that figure too but are not a tier of the pyramid, so they are left out here. The producer figure of 20,810 is Odum's gross primary productivity. Many textbook pyramids use net primary productivity instead, so if your course does, enter your own numbers; the efficiencies here are calculated from the gross value.
- Run those numbers through the tool and the steps come out at 16.2%, 11.4% and 5.5%. The first step is well above 10 percent and the last is far below it, which is the point: the 10% rule is a useful average, and real food chains scatter around it. Textbooks print slightly different producer and consumer totals for the same study (for example 20,805 or 3,373), so check which numbers your course uses. We could not open the original 1957 monograph, so treat these values as the textbook version of Odum's data. The original is H. T. Odum, "Trophic structure and productivity of Silver Springs, Florida", Ecological Monographs 27(1), 1957.
Energy pyramid vs food chain, food web and ecosystem diagrams
A food chain or food web diagram shows who eats whom, using arrows between organisms. It does not tell you how much energy moves along each arrow. This page does the opposite: it takes energy amounts, or a producer value and an efficiency, and computes every level. Use the Food Chain Diagram Generator to draw the organisms, the Food Web Maker for the full network, and the Ecosystem Diagram Generator for the wider setting. Then bring the food chain here to put numbers on it. The pyramid also does not replace a biomass pyramid or a pyramid of numbers, which count dry mass and individuals instead of energy.
Reading the diagram
- The number inside each tier is the energy at that trophic level in the unit you picked. The blue label between two tiers is the share of the lower level that reached the upper one. The red arrow on the right shows the energy that was not passed up from that level. For the top level, the arrow shows its whole value, because nothing eats it in this model.
- Tier widths are set for a readable layout, not drawn to scale. A true to-scale 10% pyramid would shrink the top level to a hairline, so read the numbers rather than the widths.
Frequently Asked Questions
Related Biology Tools
 Biology
Food Chain Diagram Generator
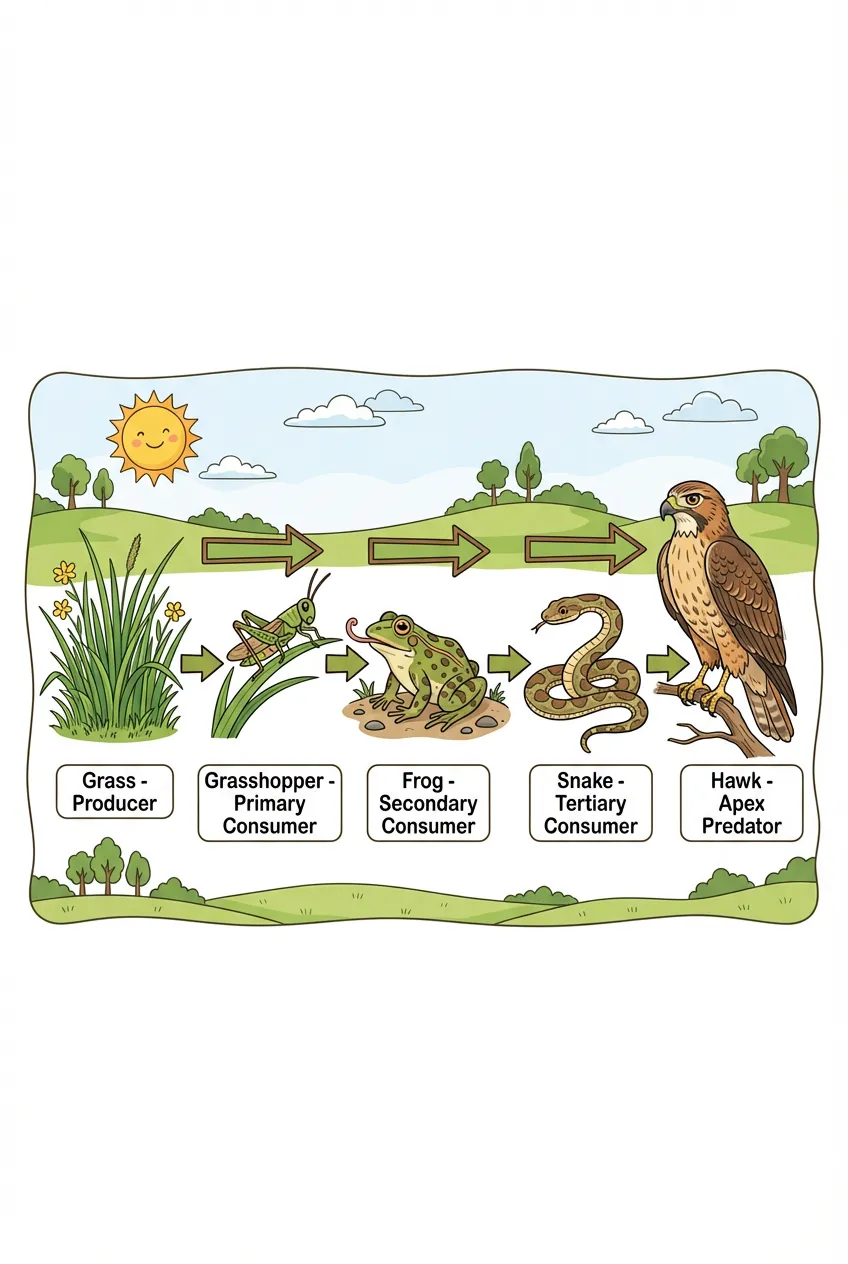
Draw the organisms of a food chain, producer to apex predator, with arrows for who eats whom.
 Biology
Food Web Maker
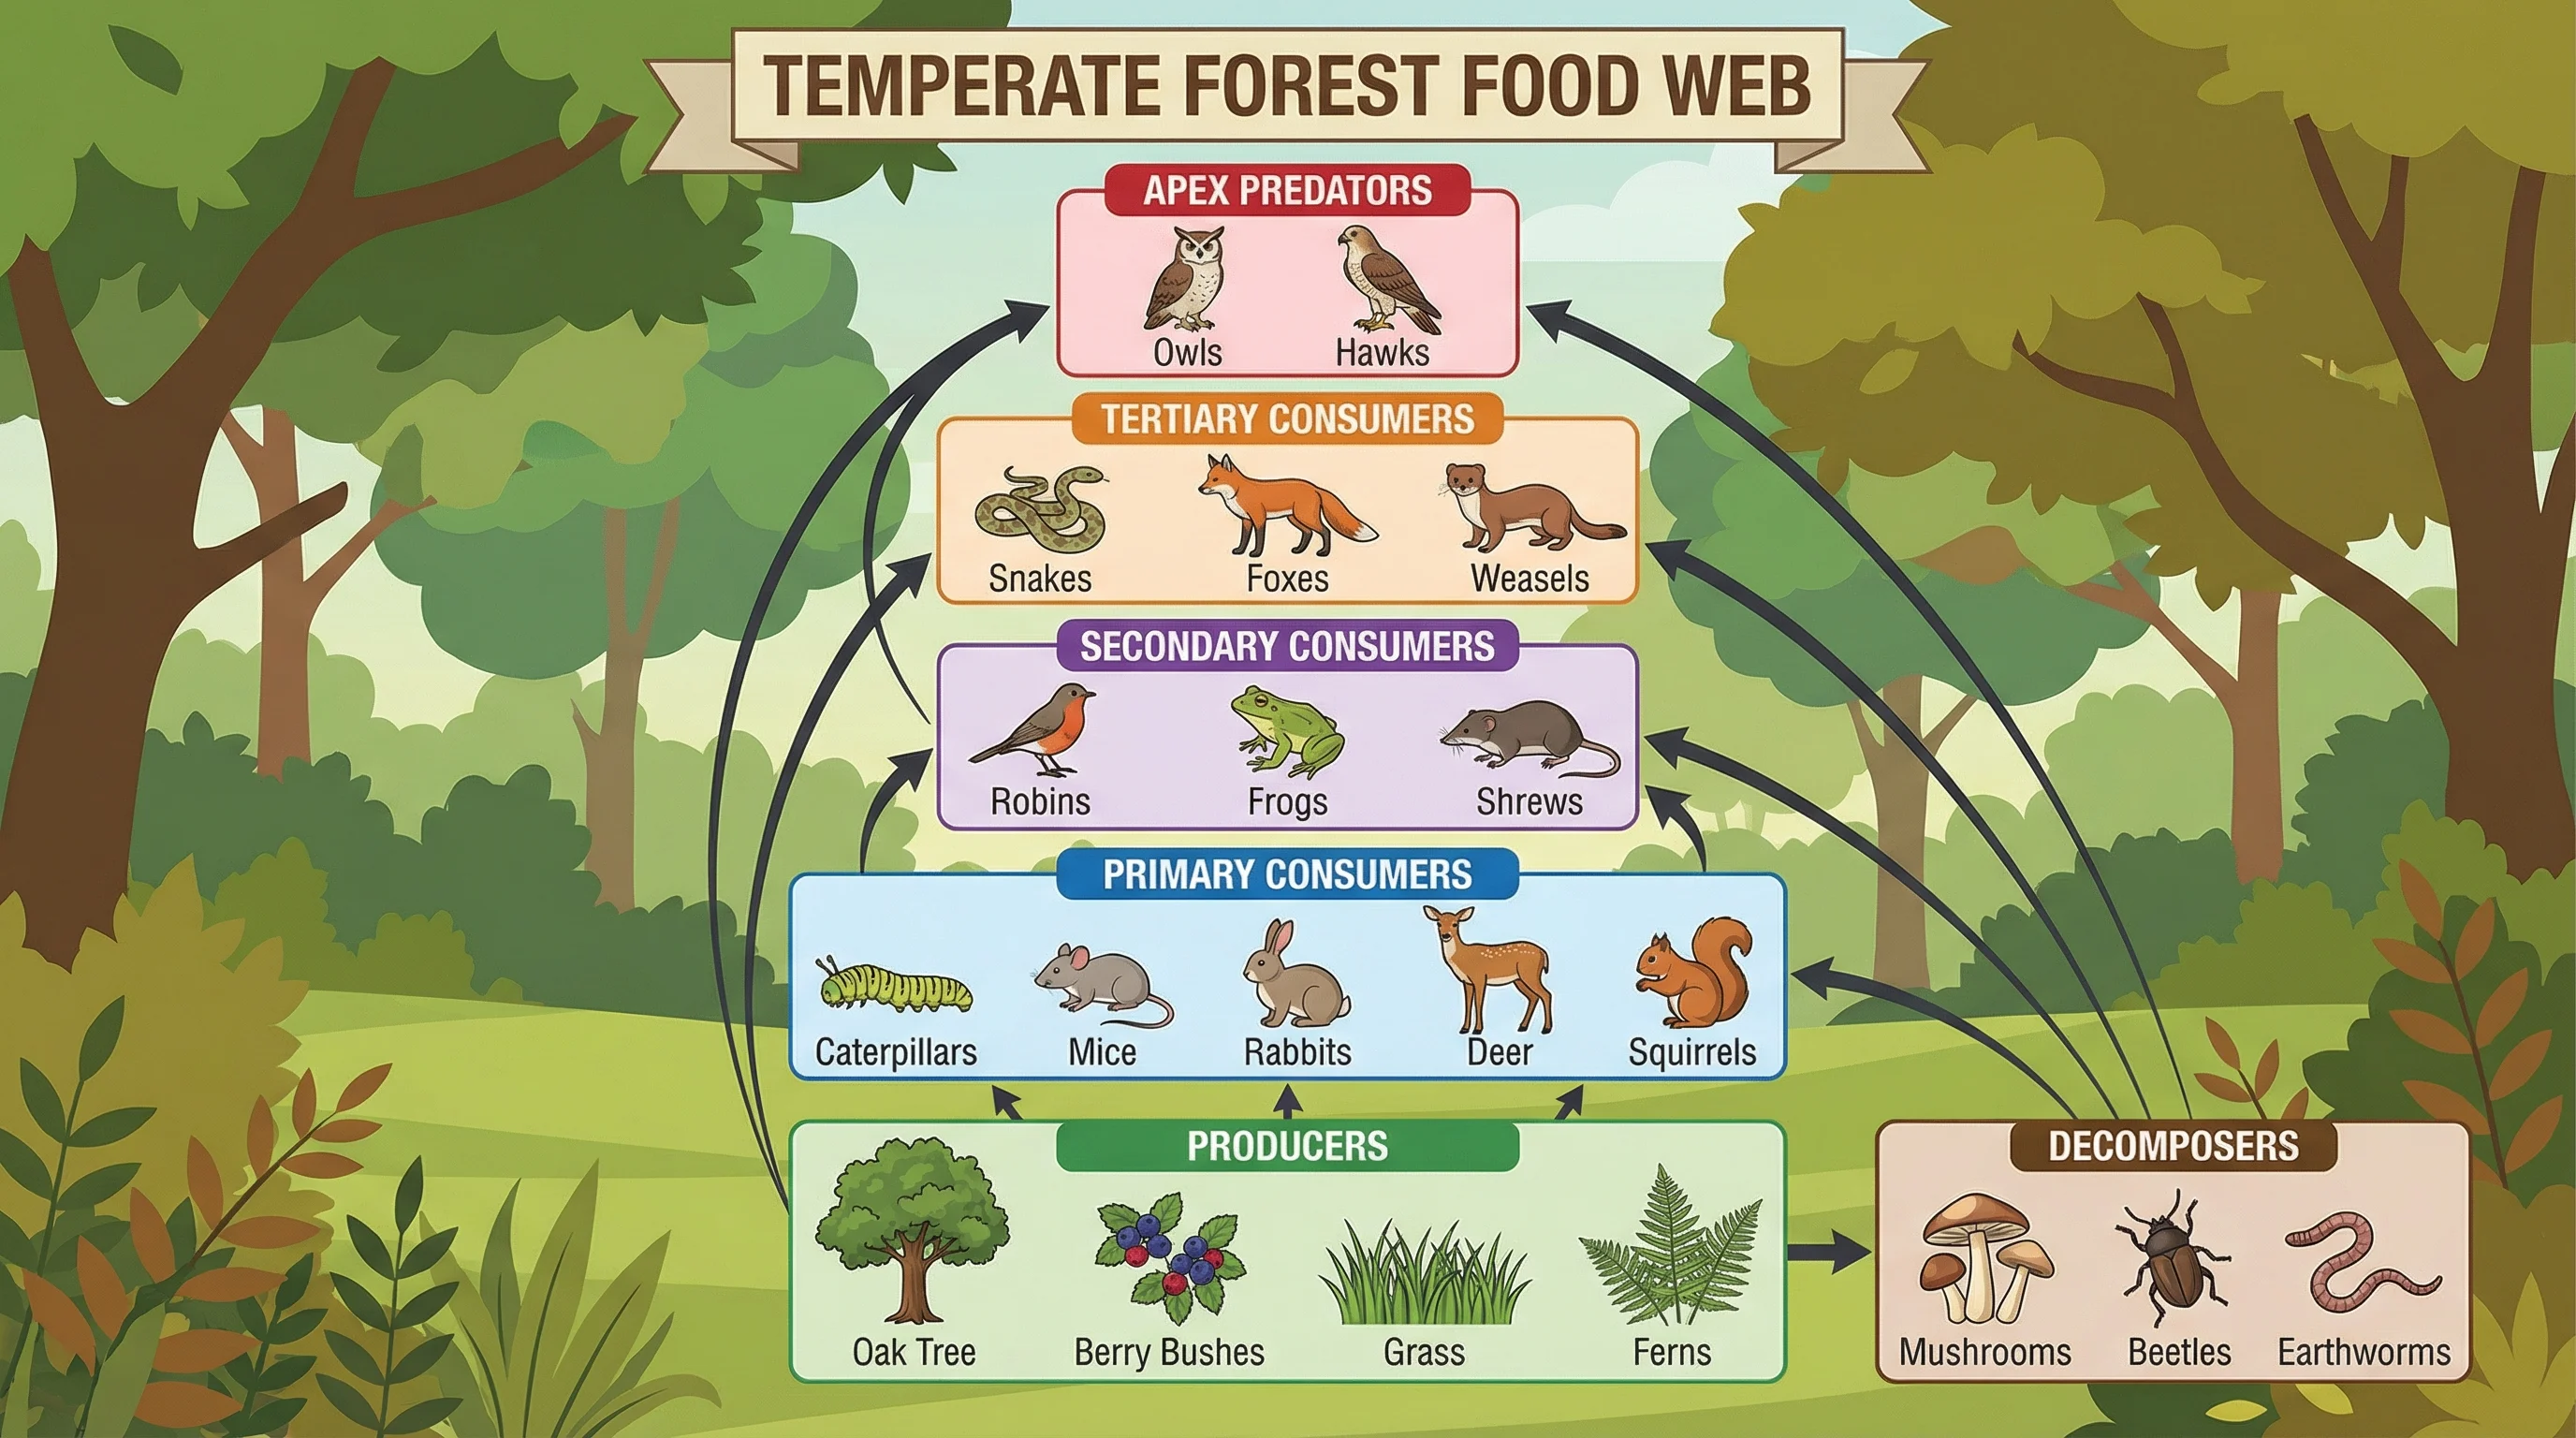
Map the full network of feeding relationships between organisms in an ecosystem.
 Biology
Ecosystem Diagram Generator
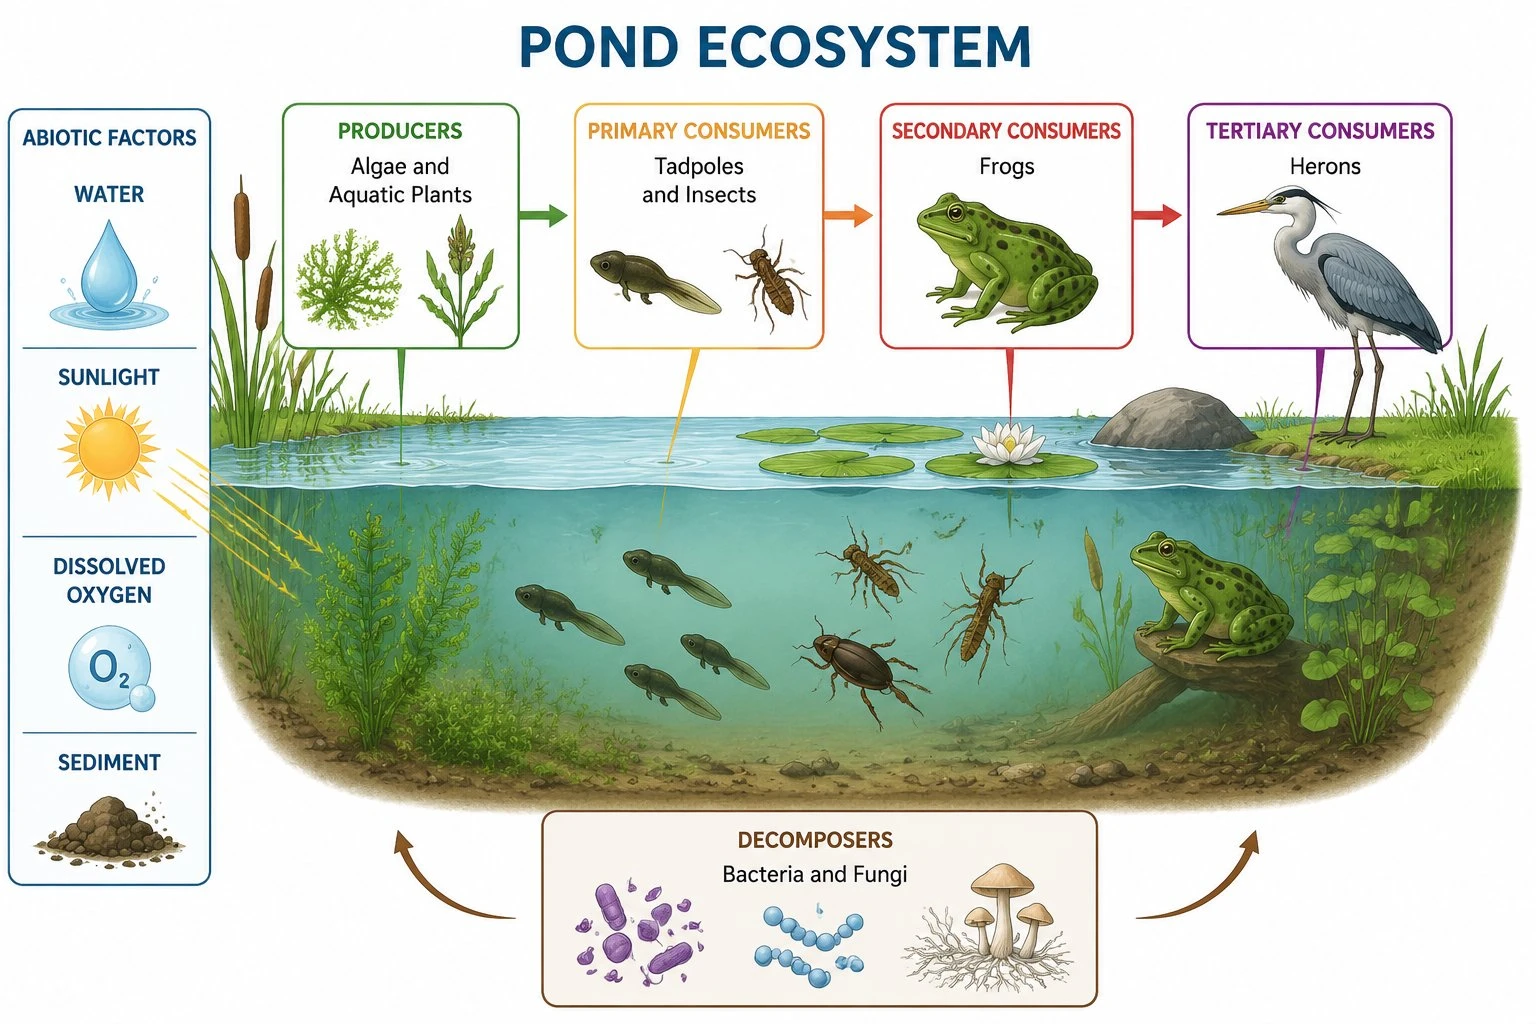
Show the living and nonliving parts of an ecosystem and how they connect.