Conceptual Framework Generator Visualize Your Research
Make a conceptual framework for your thesis or dissertation in seconds. Describe your independent, dependent, mediating, and moderating variables in plain English and the AI lays them out with labeled hypothesis arrows — ready for research papers and proposals, free.
Conceptual Framework Generator
Free to try ·
Used by 40,000+ teachers, students & researchers
Your conceptual framework will appear here
Describe your research model and click Generate
Conceptual Framework Examples
Browse examples from different research fields or generate your own above
Technology Adoption Model
A Technology Acceptance Model (TAM) framework — the classic layout for information-systems research papers.
Employee Performance Model
A human-resource-management framework with a moderating variable shaping the variable relationships.
Consumer Behavior Framework
A consumer-psychology model where satisfaction mediates the path from brand factors to purchase intention.
Educational Outcomes Model
An education-research model with multiple mediating pathways from inputs to learning outcomes.
Sustainability Business Model
A corporate-sustainability framework mapping the three ESG dimensions onto firm performance.
Health Behavior Model
A Theory of Planned Behavior (TPB) adaptation for health-behavior research.
What is a conceptual framework in research?
A conceptual framework is a visual map of the key concepts and variables in your study and the relationships you expect between them. It shows how your independent variables, dependent variables, mediators, and moderators connect, usually with directional arrows that represent your hypotheses. Think of it as the blueprint that links your research questions to your methodology — readers, reviewers, and thesis committees can see your whole argument at a glance. This generator turns a plain-English description of your study into exactly that diagram, with the variables placed and the hypothesis arrows labeled for you.
Independent, dependent, mediating, and moderating variables
- Independent variable (IV): the predictor or cause you study — the factor you expect to influence an outcome.
- Dependent variable (DV): the outcome you measure — the effect you expect the IV to change.
- Mediating variable: the mechanism that sits between the IV and DV and explains why the effect happens (IV → mediator → DV).
- Moderating variable: a variable that changes the strength or direction of the IV→DV relationship — it explains when or for whom the effect is stronger.
- Control variable: a factor you hold constant or account for statistically so it does not confound the relationships you care about.
Conceptual framework vs theoretical framework
These two terms are often confused, but they do different jobs. A theoretical framework is the existing theory you borrow as a lens — established constructs and propositions from the literature, such as the Technology Acceptance Model or the Theory of Planned Behavior. A conceptual framework is your own specific model for this study: it takes those ideas and lays out the exact variables and relationships you will test, often combining several theories or proposing new links. In short, the theoretical framework is the broad foundation, and the conceptual framework is the targeted map you build on top of it. This tool draws either one — a textbook theory model or your custom study design.
How to build a conceptual framework for a thesis or dissertation
- Start from your research question and identify the dependent variable — the outcome you ultimately want to explain.
- List the independent variables (predictors) you believe influence that outcome, drawn from your literature review.
- Decide whether any mediators explain the mechanism, and whether any moderators change the strength of a relationship.
- State each expected relationship as a hypothesis (H1, H2, …) and draw a directional arrow for it.
- Describe all of this in the box above and generate the diagram, then refine the labels and export it for your proposal or thesis chapter.
Generate a framework from a plain-English description
You do not need design software or hours of dragging boxes around. Describe your study the way you would explain it to a colleague — name your independent and dependent variables, any mediators or moderators, the theory you are building on, and your hypotheses — and the AI arranges the constructs into a clean academic layout with labeled arrows. It is the fastest way to go from a research idea to a presentable framework figure, and you can regenerate as your model evolves.
Use it across any research field
Conceptual frameworks are required across disciplines, and the generator adapts to all of them. Business and management researchers map drivers of performance and adoption; psychology and education researchers trace motivation and learning pathways; health-sciences researchers model behavior and outcomes; and information-systems researchers build TAM- and UTAUT-style models. Whether your study is quantitative with hypothesis arrows or qualitative with themes and categories, you can describe the relationships and get a framework figure that fits your paper.
Frequently Asked Questions
More Research Tools
 Research
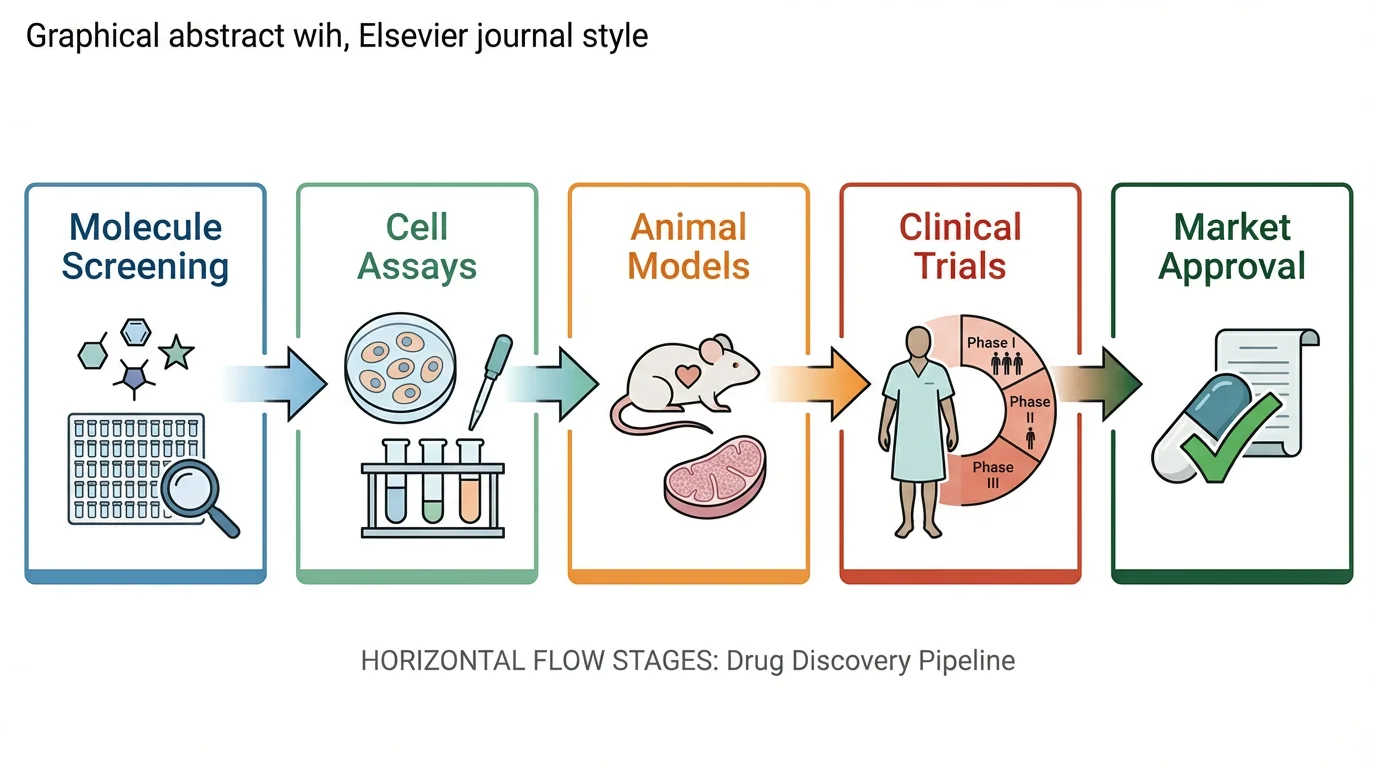
Graphical Abstract Maker
Create professional graphical abstracts for academic journal submissions.
 Visualization
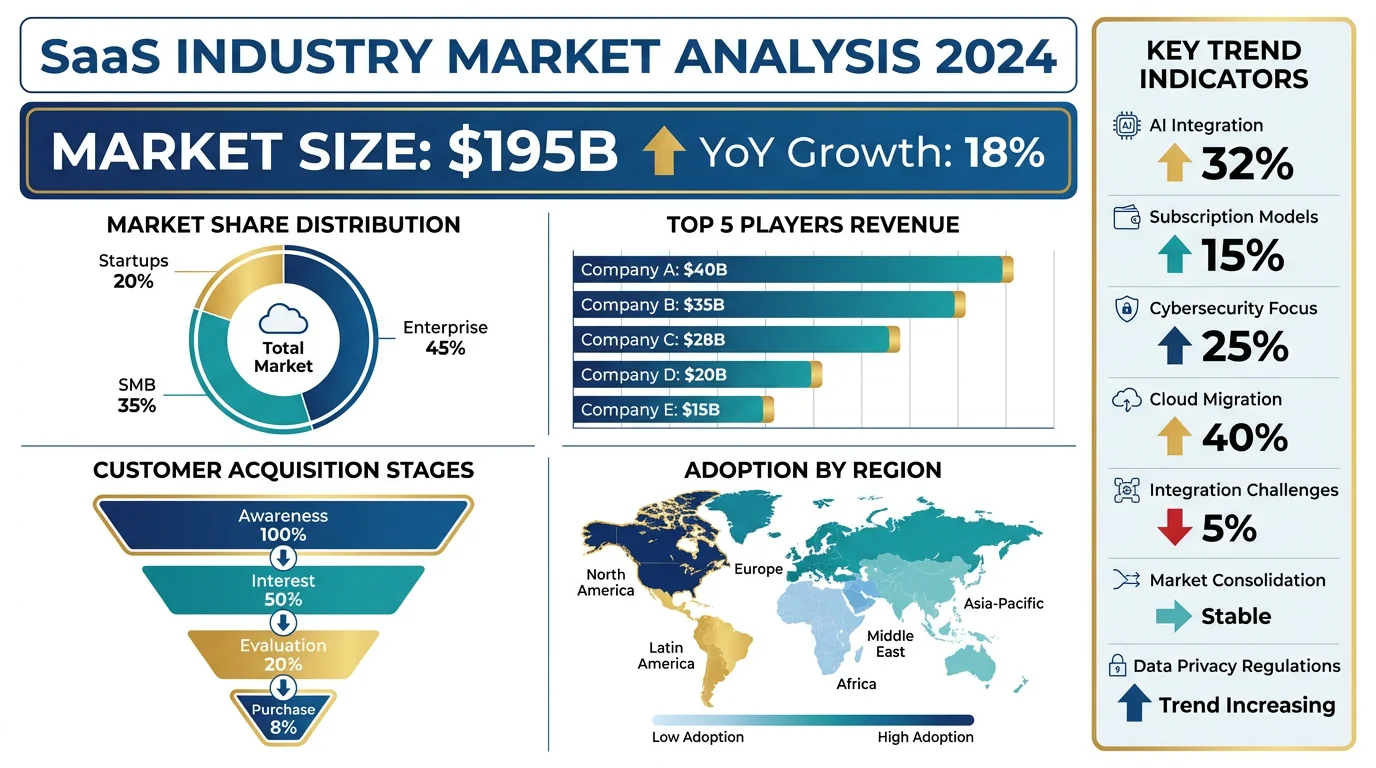
AI Infographic Generator
Turn your data and key points into clean, shareable infographics for reports.
 Research
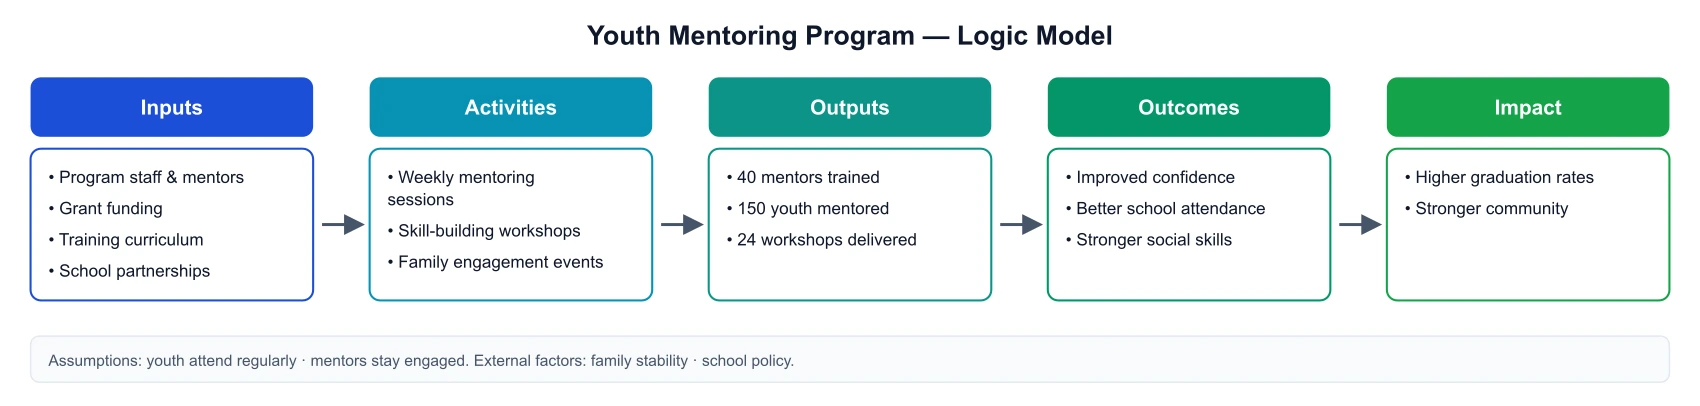
Logic Model Generator
Map program inputs, activities, outputs, and short- to long-term outcomes for grants and evaluation.