PRISMA Flow Diagram Generator for Systematic Reviews
Make a PRISMA 2020 flow diagram online, free. Fill in your record counts for a precise, auto-laid-out diagram, or describe your review for an AI illustration — then download an editable SVG for your systematic review or meta-analysis.
Enter your record counts — renders an exact PRISMA 2020 flow diagram as SVG, free
PRISMA 2020 counts
Fill in the numbers — rendered as SVG.
Identification
Screening
Included
Standard PRISMA 2020 template with the Identification, Screening, and Included phases. Edit the counts on the left and download an editable SVG for your manuscript, thesis, or slides.
PRISMA Flow Diagram Generator
Free to try ·
Your PRISMA flow diagram will appear here
Enter your review numbers and click Generate
PRISMA Flow Diagram Examples
Systematic reviews, meta-analyses, and scoping reviews on the PRISMA 2020 template
Standard PRISMA 2020
The default PRISMA 2020 layout — phase ribbon down the left, main column, and side exclusion boxes.
Multiple Databases
For searches across several databases — totals roll up into the identification stage.
Scoping Review
Adapts to scoping-review methodology, including grey literature and charted sources.
Databases + Other Methods
Captures records found through databases plus other methods like citation searching.
Meta-Analysis
Tracks studies through to both qualitative synthesis and the quantitative meta-analysis.
Clean Template
A minimal, student-friendly version — ideal for a thesis appendix or classroom example.
What is a PRISMA flow diagram?
A PRISMA flow diagram is the standard chart that shows how studies were found, screened, and selected during a systematic review or meta-analysis. PRISMA stands for Preferred Reporting Items for Systematic Reviews and Meta-Analyses, and the flow diagram is the part that makes your study-selection process transparent: it counts every record from the initial database search down to the studies finally included, and records exactly why others were dropped along the way. Journals across medicine, nursing, psychology, public health, and the social sciences expect this diagram, and this generator draws the official template for you — you just supply the numbers.
The three phases of PRISMA 2020
- Identification: the records you found in databases and registers, and the records removed before screening — duplicates, those flagged by automation tools, and any removed for other reasons.
- Screening: the records screened and the records excluded; the reports sought for retrieval and any not retrieved; and the reports assessed for eligibility together with the reports excluded, with reasons.
- Included: the studies included in the review, and the reports of those included studies that you go on to synthesize.
Two ways to build your diagram here
- Precise mode: type your record counts into the labeled fields and the tool lays out the exact PRISMA 2020 template — phase ribbon, main column, side exclusion boxes, and connecting arrows — with your numbers in place. Nothing to drag, align, or redraw.
- AI illustration mode: describe your review in plain English and the tool generates a polished, presentation-ready PRISMA illustration with clean academic styling.
- Use Precise mode for anything that must be reproducible and correct — a journal submission, thesis, or registered protocol; use AI mode when you want a styled graphic for a talk or poster.
How to make a PRISMA flow diagram
- Enter how many records you identified from databases and registers, and how many were removed before screening (duplicates, automation, other).
- Add the records screened and excluded, the reports sought and not retrieved, and the reports assessed and excluded with reasons.
- Enter the studies included in the review and the reports of those included studies.
- Check the live diagram, then download an editable SVG to drop into your manuscript, thesis appendix, or slides.
PRISMA 2020 vs the 2009 version
The PRISMA statement was updated in 2020, and the flow diagram changed with it. The original 2009 version used four phases — Identification, Screening, Eligibility, and Included. PRISMA 2020 simplifies this to three labeled phases (Identification, Screening, Included) and folds the old eligibility step into screening as the "reports assessed for eligibility" box. The 2020 version also makes the "records removed before screening" and the new-methods sources explicit. This generator follows the current 2020 structure, which is what most journals now require — so your diagram matches the latest reporting guideline rather than the deprecated one.
Why systematic reviews need this diagram
A systematic review is only credible if a reader can see exactly how the included studies were chosen, and the PRISMA flow diagram is what makes that auditable. By reporting every count — records found, duplicates removed, records excluded, reports assessed, and studies included — you let reviewers and readers reproduce your selection and judge whether anything relevant was missed. That transparency is why the diagram is mandatory in most evidence-synthesis journals and why supervisors ask for it in dissertations. Drawing it from a fixed template, rather than freehand, also means the layout stays consistent with thousands of other published reviews.
Frequently Asked Questions
Related Research Tools
 Research
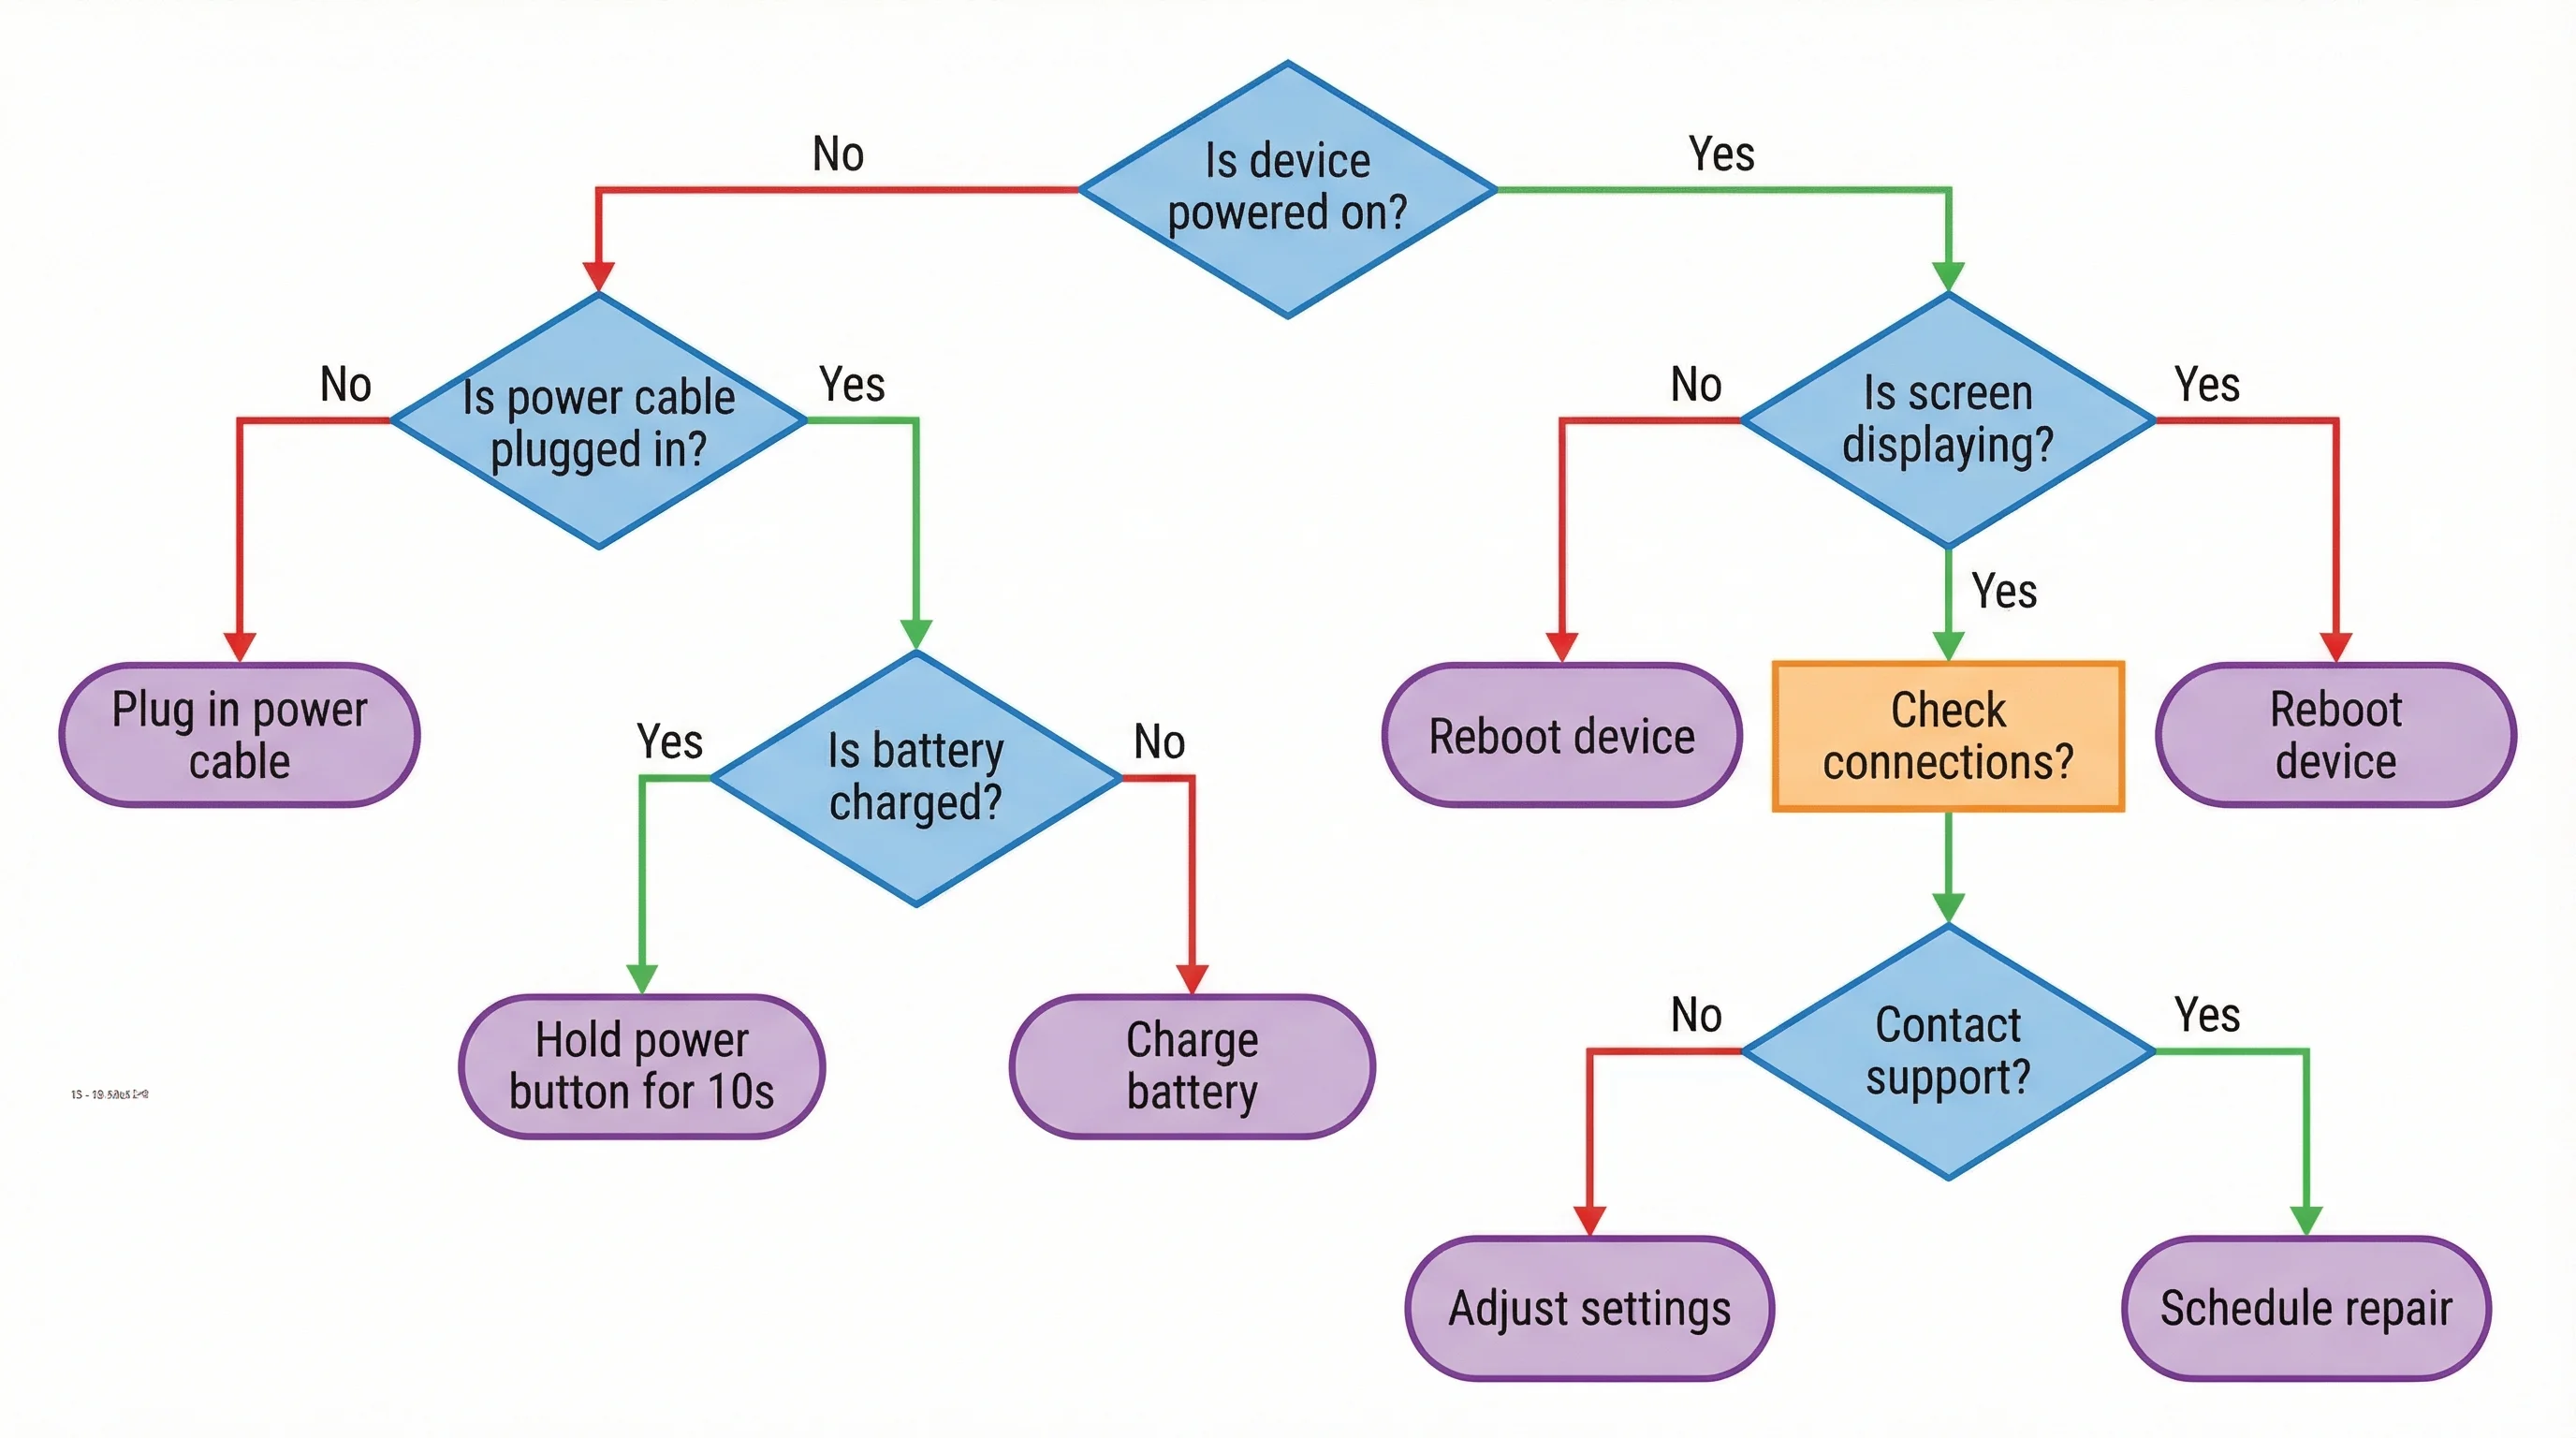
AI Flowchart Generator
Turn a process or decision tree into a clean, labeled flowchart.
 Research
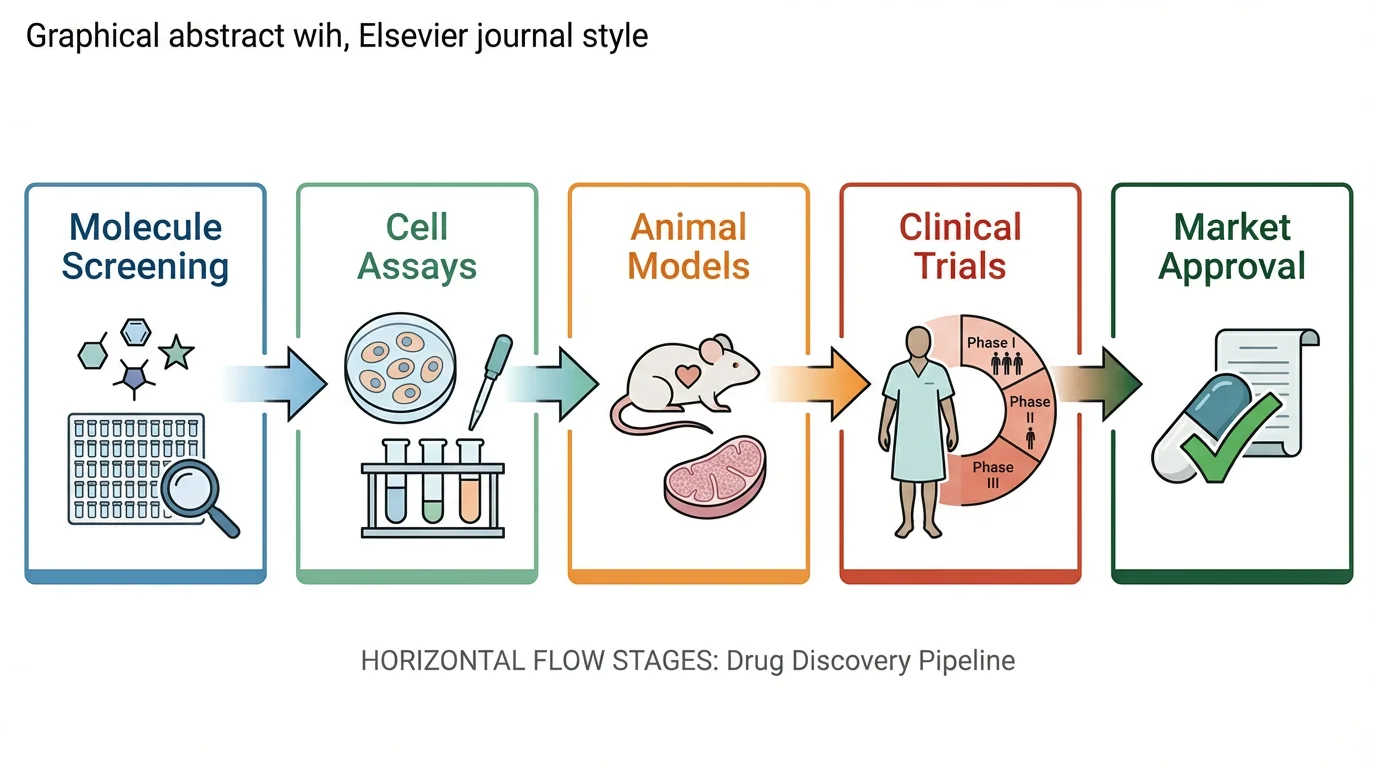
Graphical Abstract Maker
Summarize your study in a single, journal-ready graphical abstract.
 Research
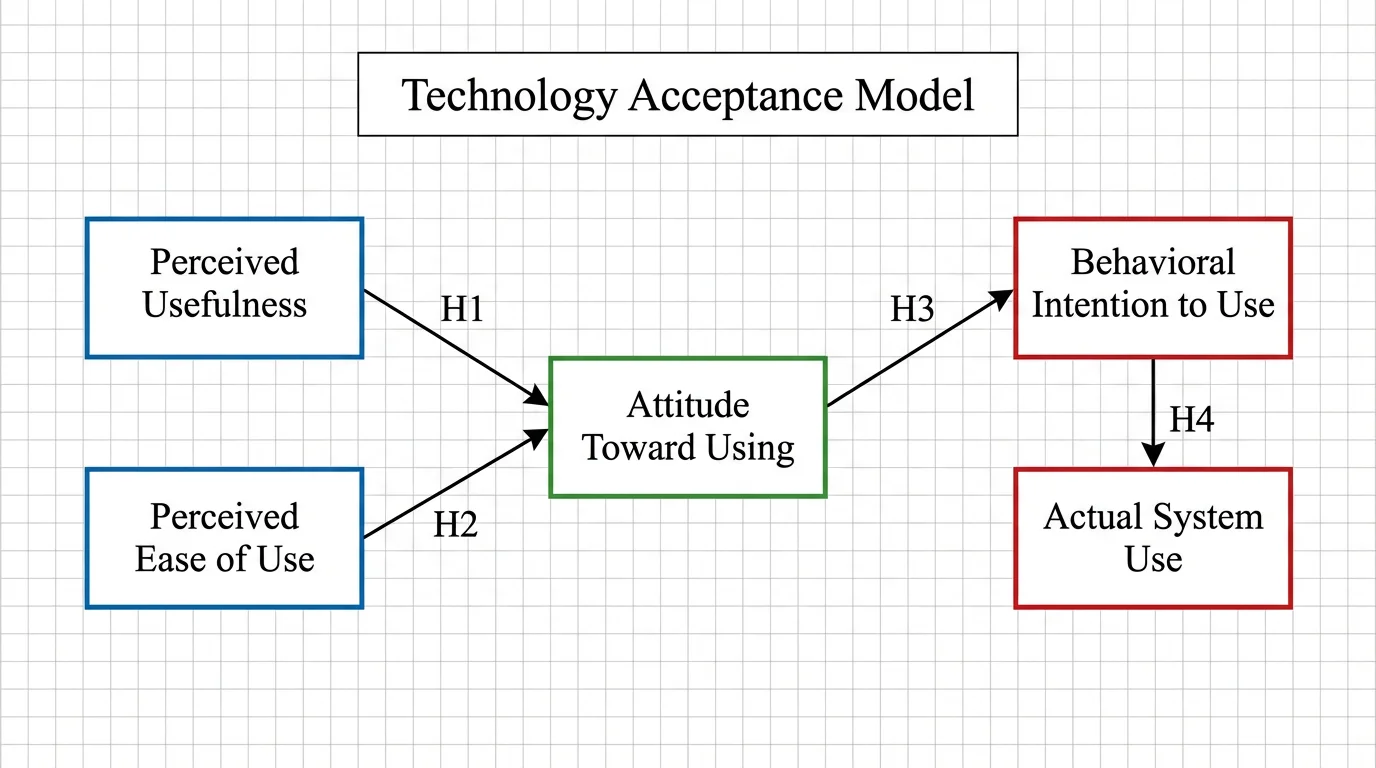
Conceptual Framework Generator
Map variables and relationships into a clear conceptual framework for research.