96 Well Plate Template Generator
Make a 96 or 384 well plate template with standard curve, serial dilution, replicate and control presets. Export SVG, PNG, PDF or CSV free, no sign-in.
Edit wells by hand
Pick a group, then click or drag across wells in the plate, or type a range such as A1:C4.
Swipe the plate sideways; tap a well to paint it with the selected group.
Plate outline and well spacing follow the ANSI/SLAS footprint; well diameter is schematic. Exports run in your browser and need no sign-in.
Free blank 96 and 384 well plate templates
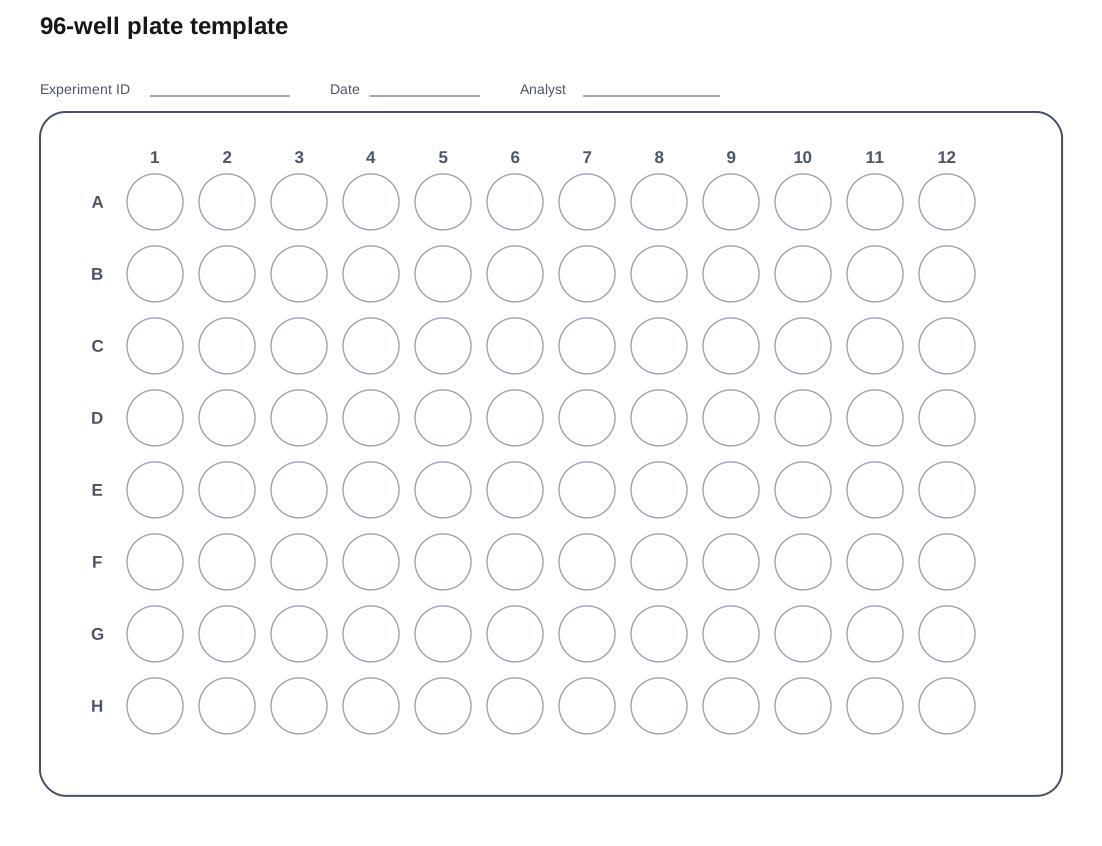
Need an empty sheet to print or paste into a protocol? Download the vector SVG below. For a PDF or PNG, choose the format and the Blank plate preset in the editor above, tick the write-in lines and download. Both blank templates are drawn by the same renderer as the editor, so the grid, labels and proportions match your edited plates.
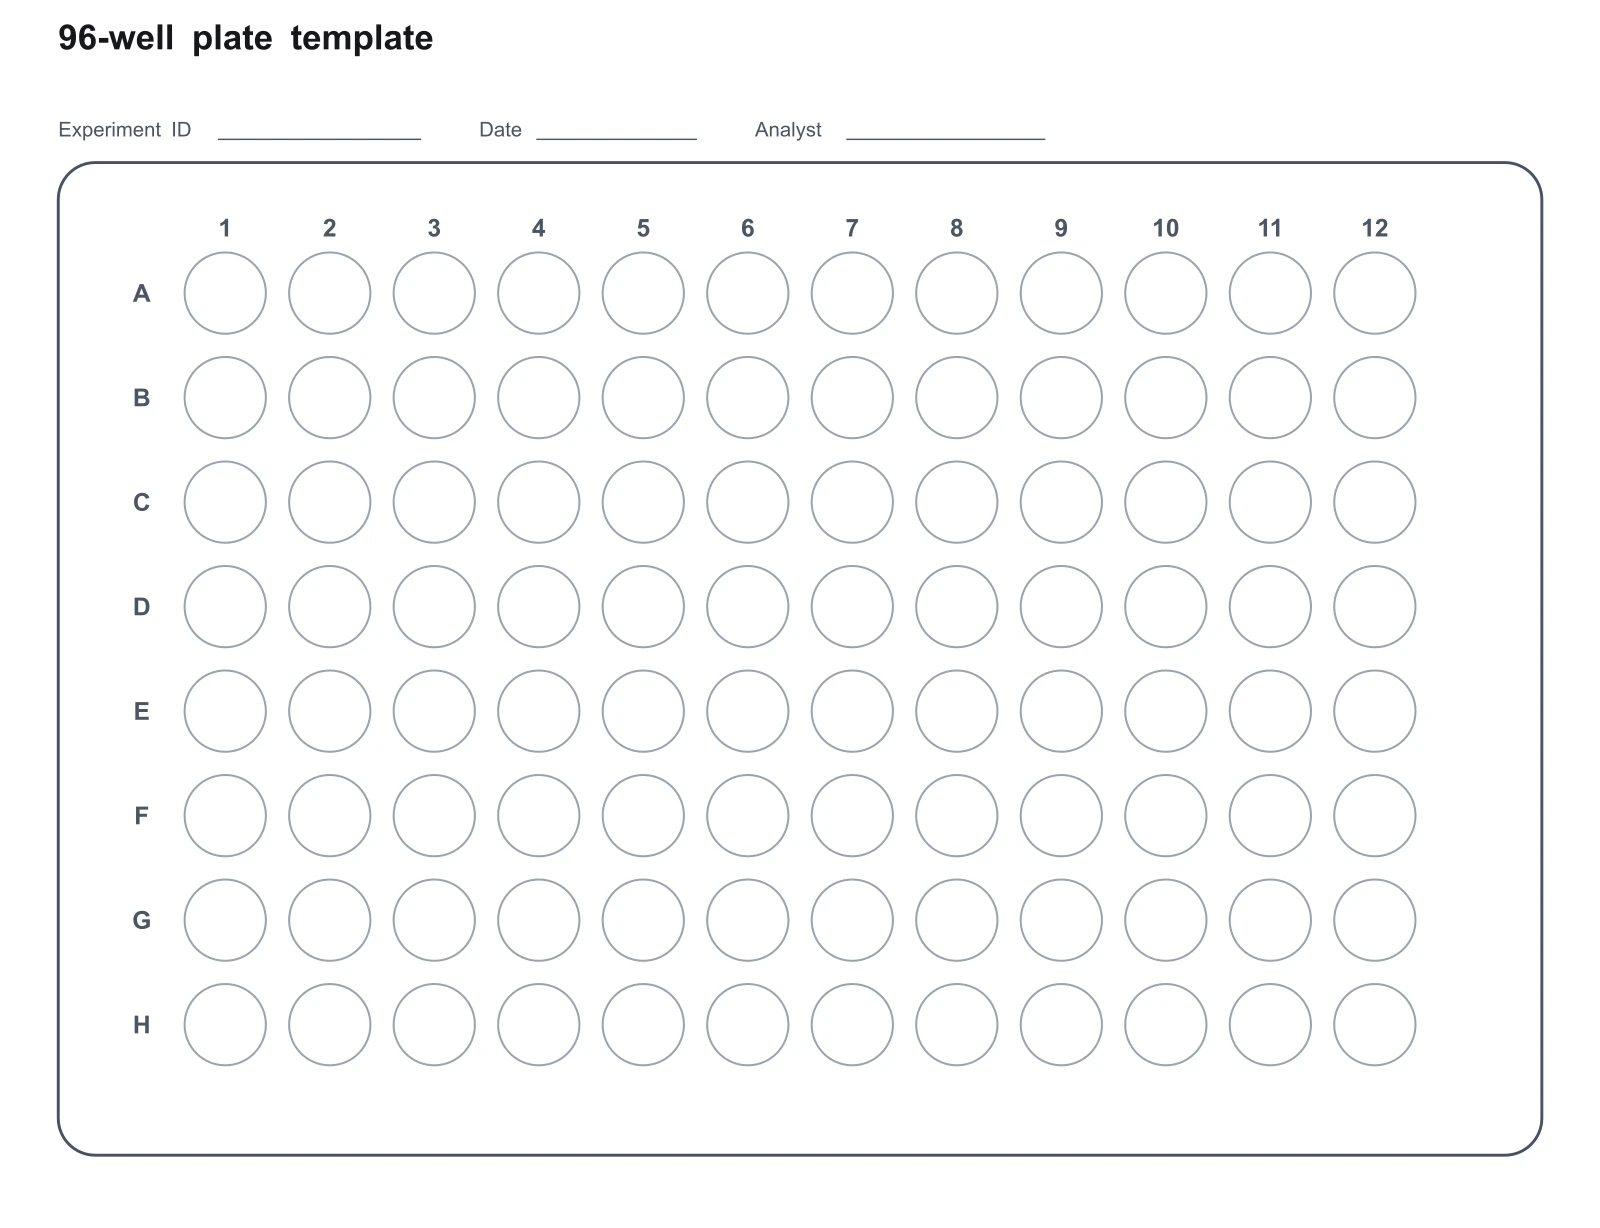
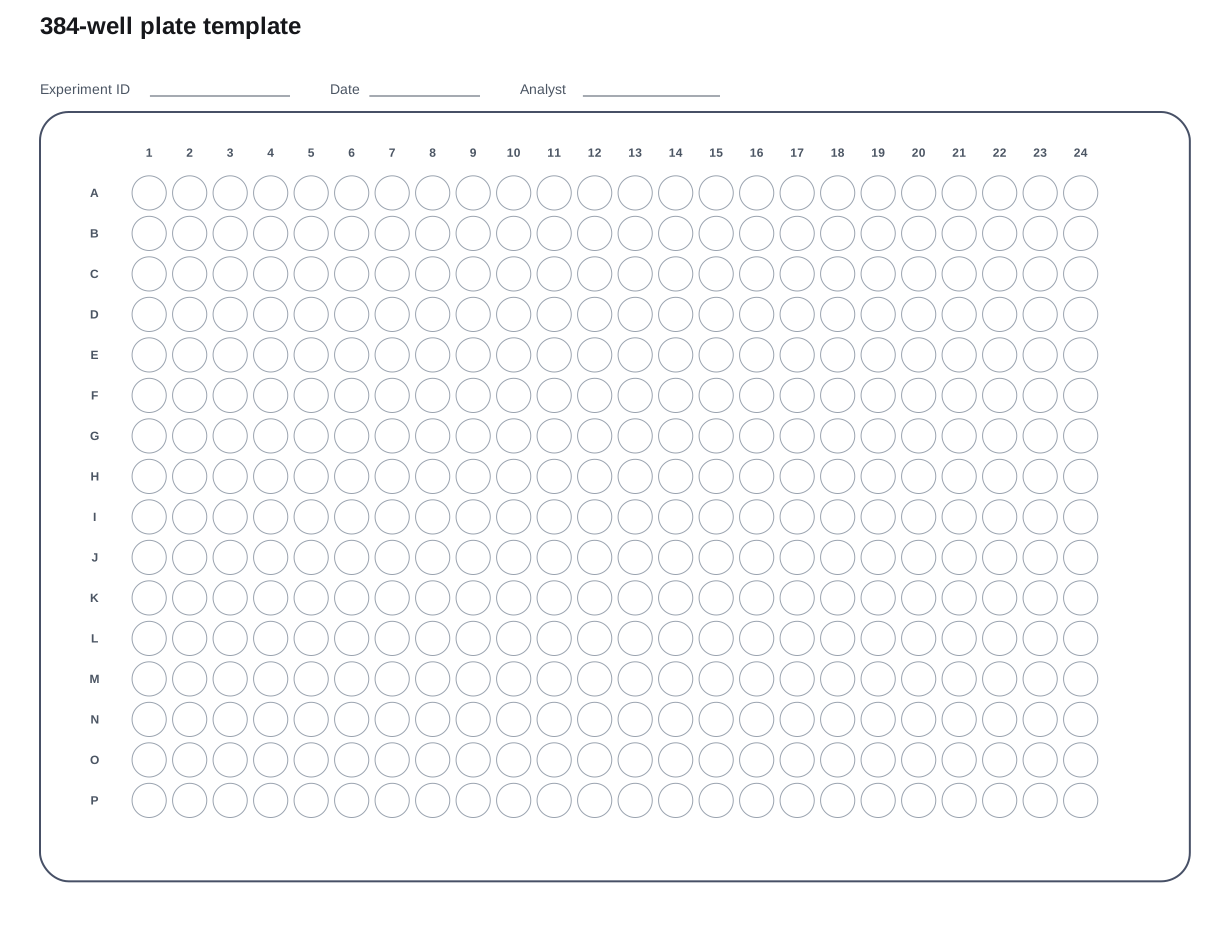
Blank 96 well plate template
8 rows (A-H) by 12 columns, 96 wells, with write-in lines.
Download SVG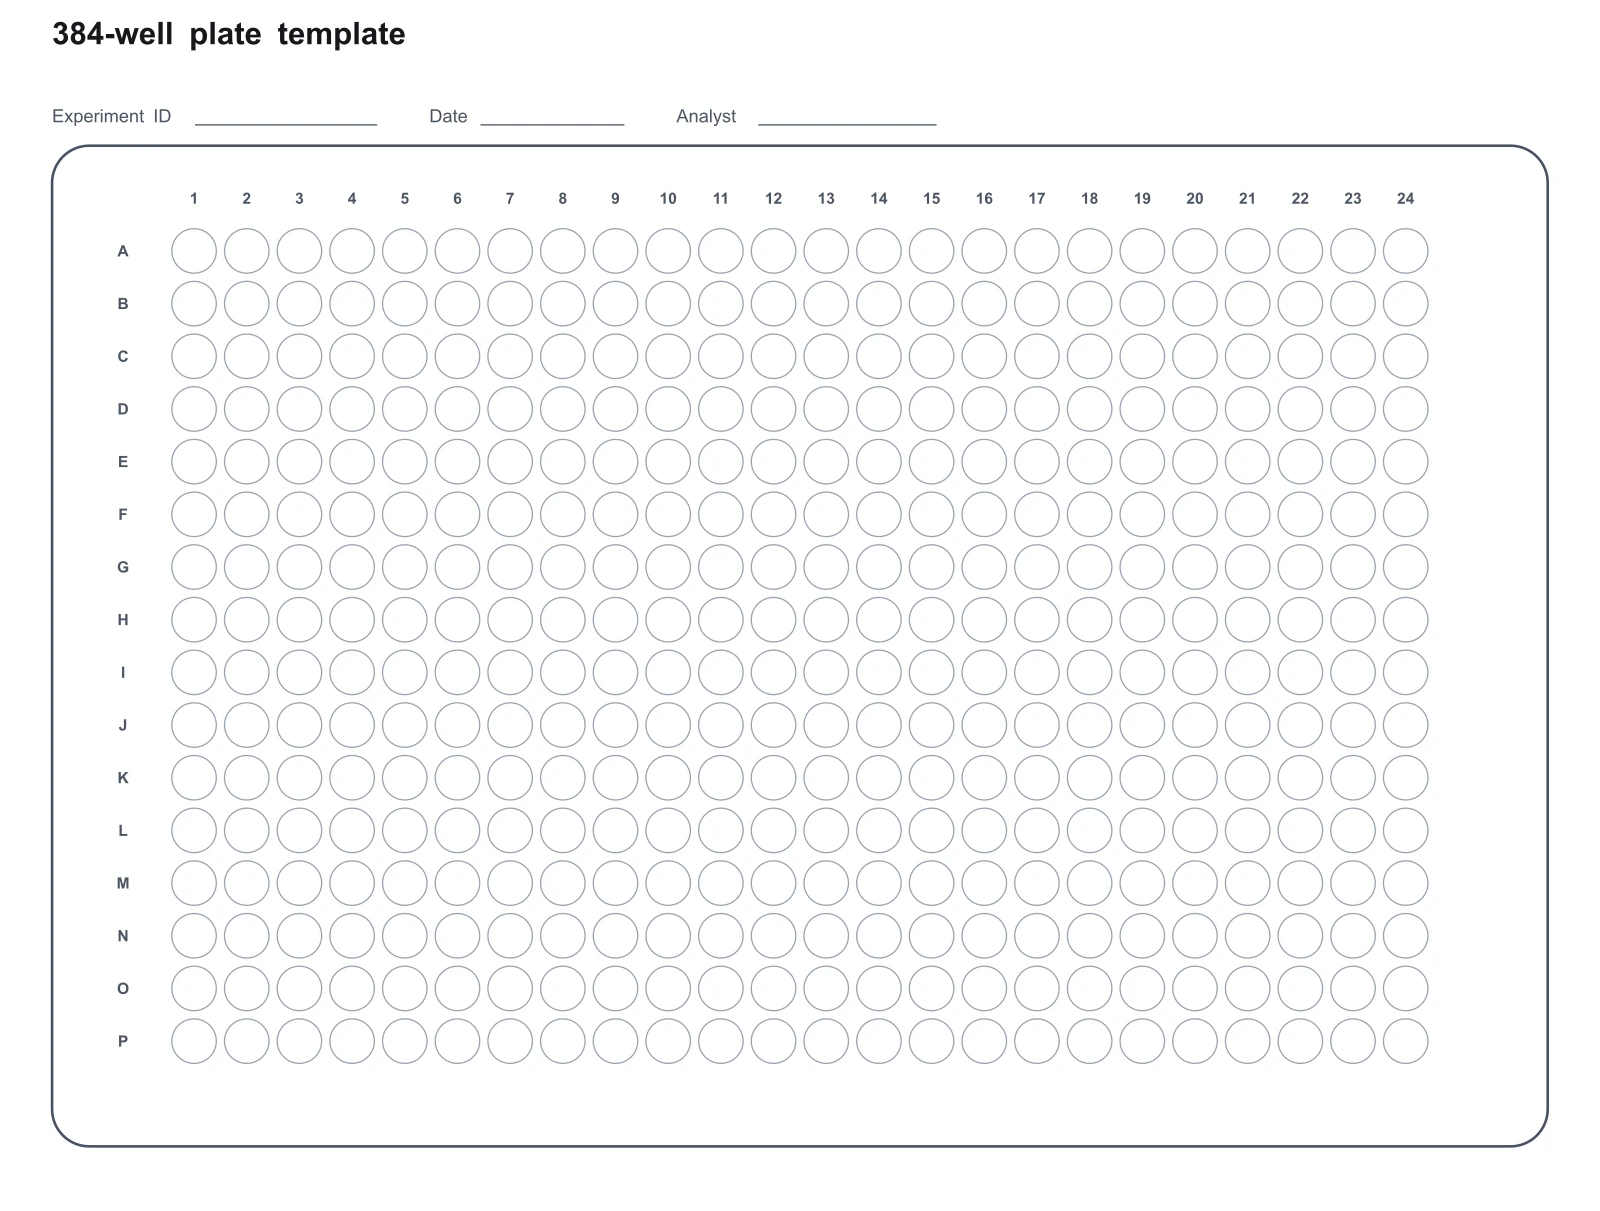
Blank 384 well plate template
16 rows (A-P) by 24 columns, 384 wells, with write-in lines.
Download SVGHow plate maps are numbered
A 96-well plate has 8 lettered rows (A to H) and 12 numbered columns (1 to 12), so well B3 is the second row, third column, and A1 is the top-left well in the standard orientation. A 384-well plate doubles both counts to 16 rows (A to P) by 24 columns. Well spacing is 9 mm on a 96-well plate and 4.5 mm on a 384-well plate, inside the same 127.76 by 85.48 mm outer footprint defined by the ANSI/SLAS microplate standards. The standards fix footprint, height and well positions; well volume and diameter are left to each manufacturer.
A plate map is the key that connects well IDs to what you pipetted. Colour groups, a legend and labelled replicates make it quick to check against your pipetting sheet and to import the layout later: the CSV export lists every well with its group and label, one row per well.
Four layouts you can recreate in one click
Each image below is an exact export from the same presets and renderer as the editor. Choose the matching preset above to change the numbers.
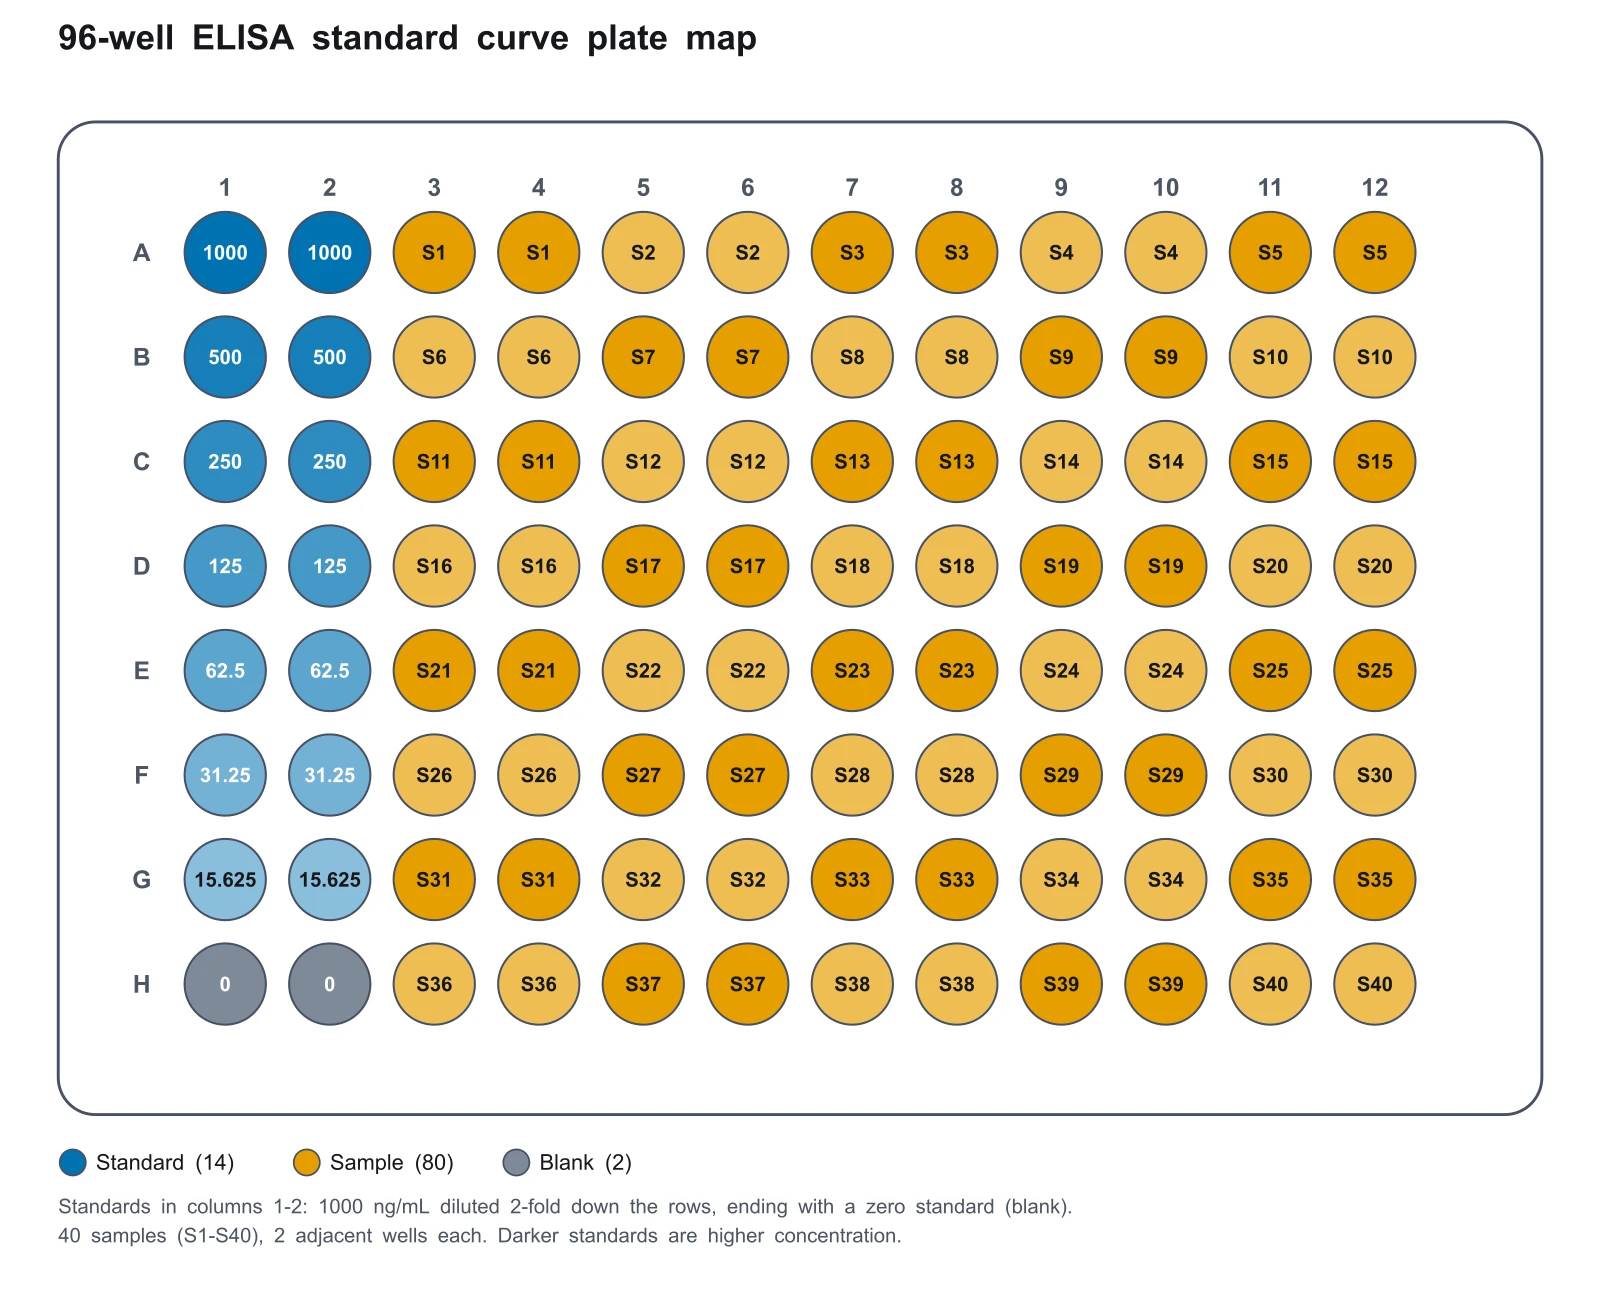
ELISA standard curve with samples in duplicate
Eight standards sit in columns 1 and 2 as duplicates: 1000 ng/mL halved seven times, then a zero standard as the blank. The other 80 wells hold 40 samples, each in two adjacent wells. Change the top concentration, dilution factor, unit or replicate count and every label is recalculated.
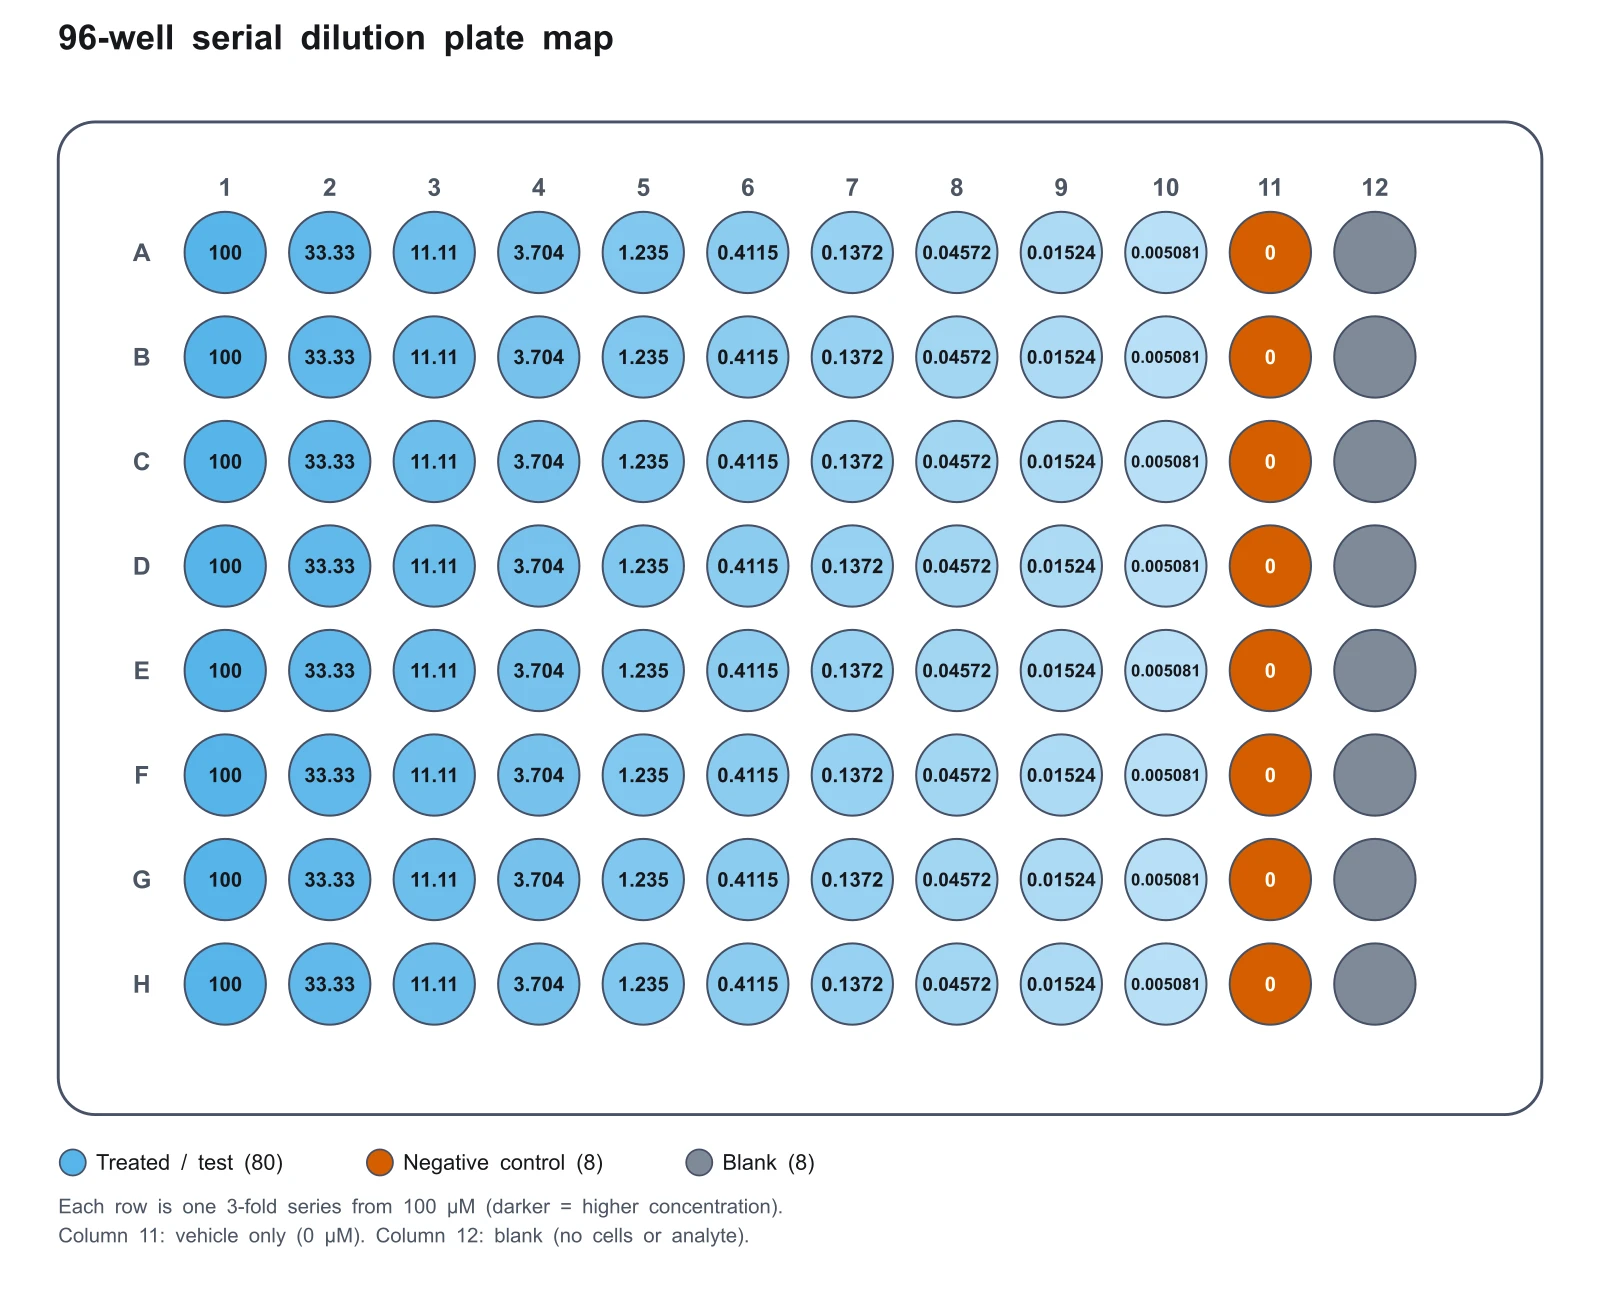
Serial dilution gradient across each row
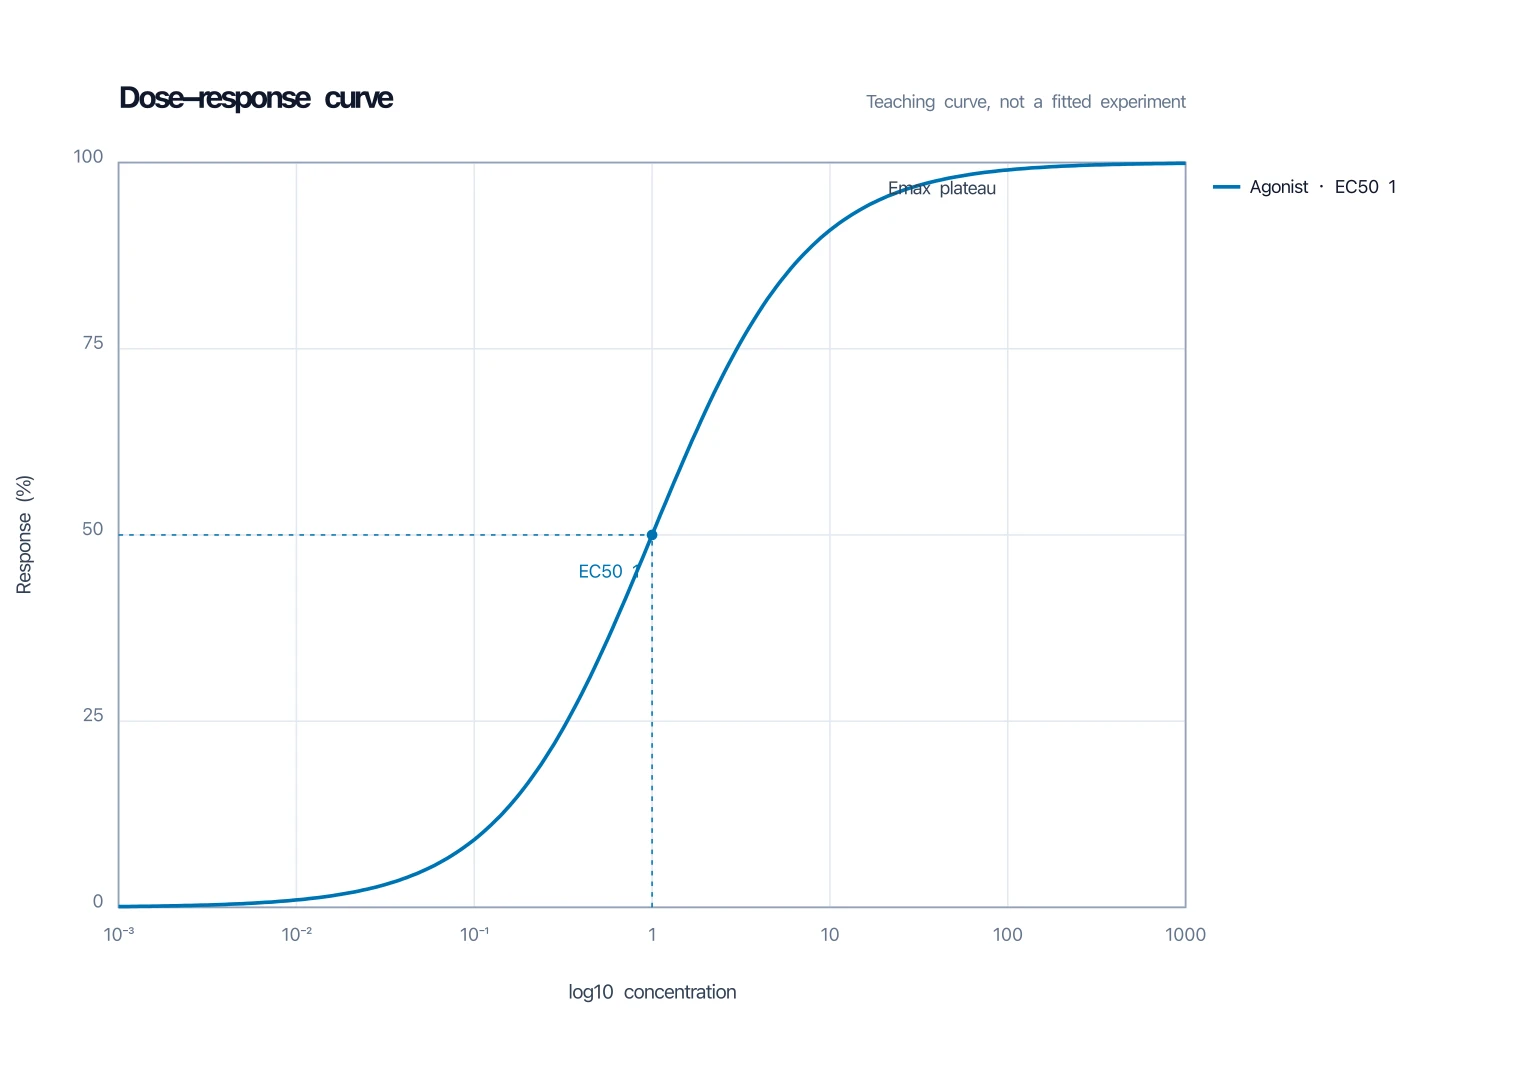
Each row is a separate series, so eight compounds or eight replicate series fit on one plate. Shading fades as concentration falls. The next column is vehicle only (0) and the one after is a blank, a common arrangement for dose-response assays.
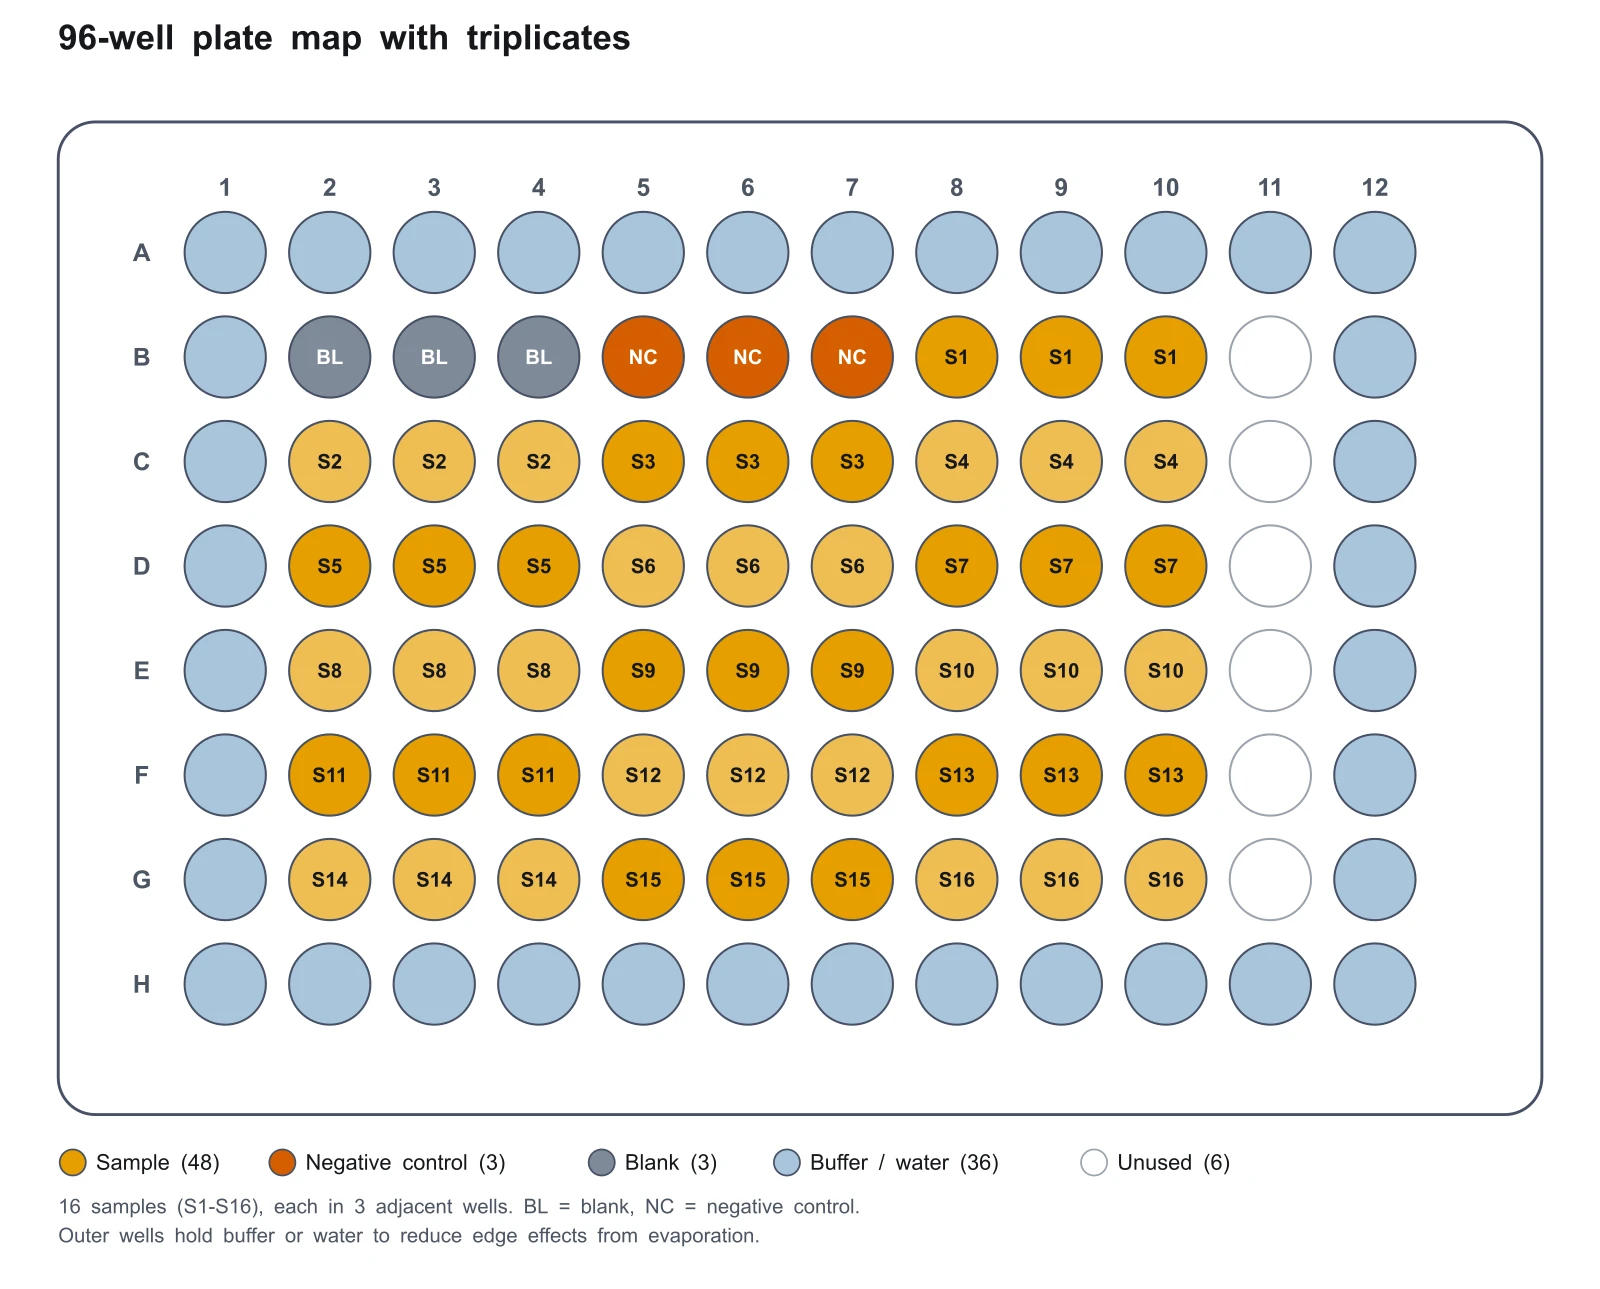
Technical replicates with edge buffer
Samples occupy three adjacent wells, with a blank block and a negative control block first. Buffer in the outer wells is a common way to limit evaporation at the plate edge; you can switch it off to use all 96 wells.
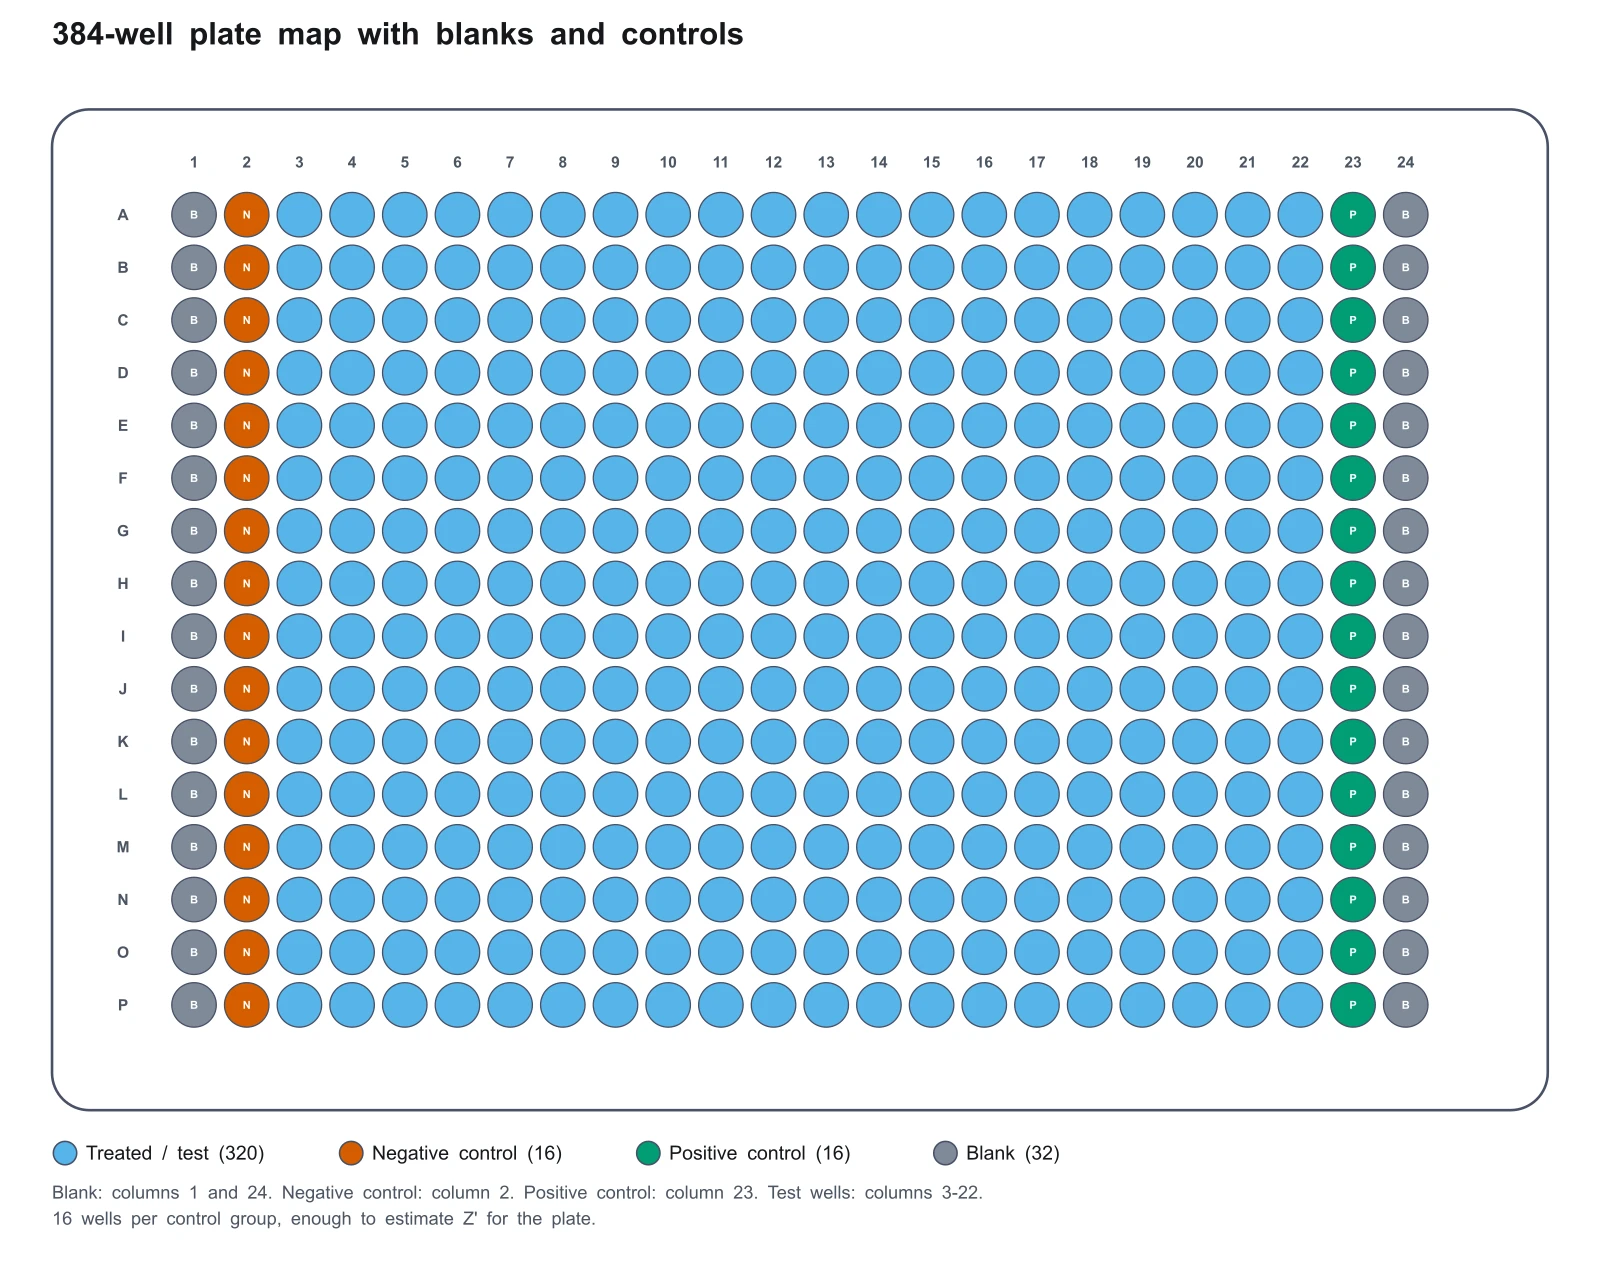
384-well plate with blank and control columns
The same presets work on a 16 by 24 plate. Here two blank columns frame the plate, the negative and positive controls sit in the next columns in, and 320 wells remain for test compounds. Each control has its own column of 16 wells, and the two blank columns add 32 blank wells, which gives a plate-quality estimate plenty to work with.
Design choices worth making before you pipette
Replicates. Put technical replicates side by side and keep the same arrangement on every plate so a stray well stands out. Controls. Include blanks and, where the assay calls for them, positive and negative controls on every plate, not only the first. For high-throughput screens, the Z′ factor compares the spread of those controls to the gap between them (Zhang, Chung and Oldenburg, 1999). Edges. Consider filling the outer wells with buffer so evaporation affects wells you do not analyse. Standards. Run the standard curve on the same plate as the samples it will quantify, and keep sample concentrations inside the standard range.
These are common practices rather than rules; your assay kit or SOP has the final say. This tool lays out wells and computes dilution labels. It does not fit curves, check your assay, or replace a validated protocol.
After the plate map
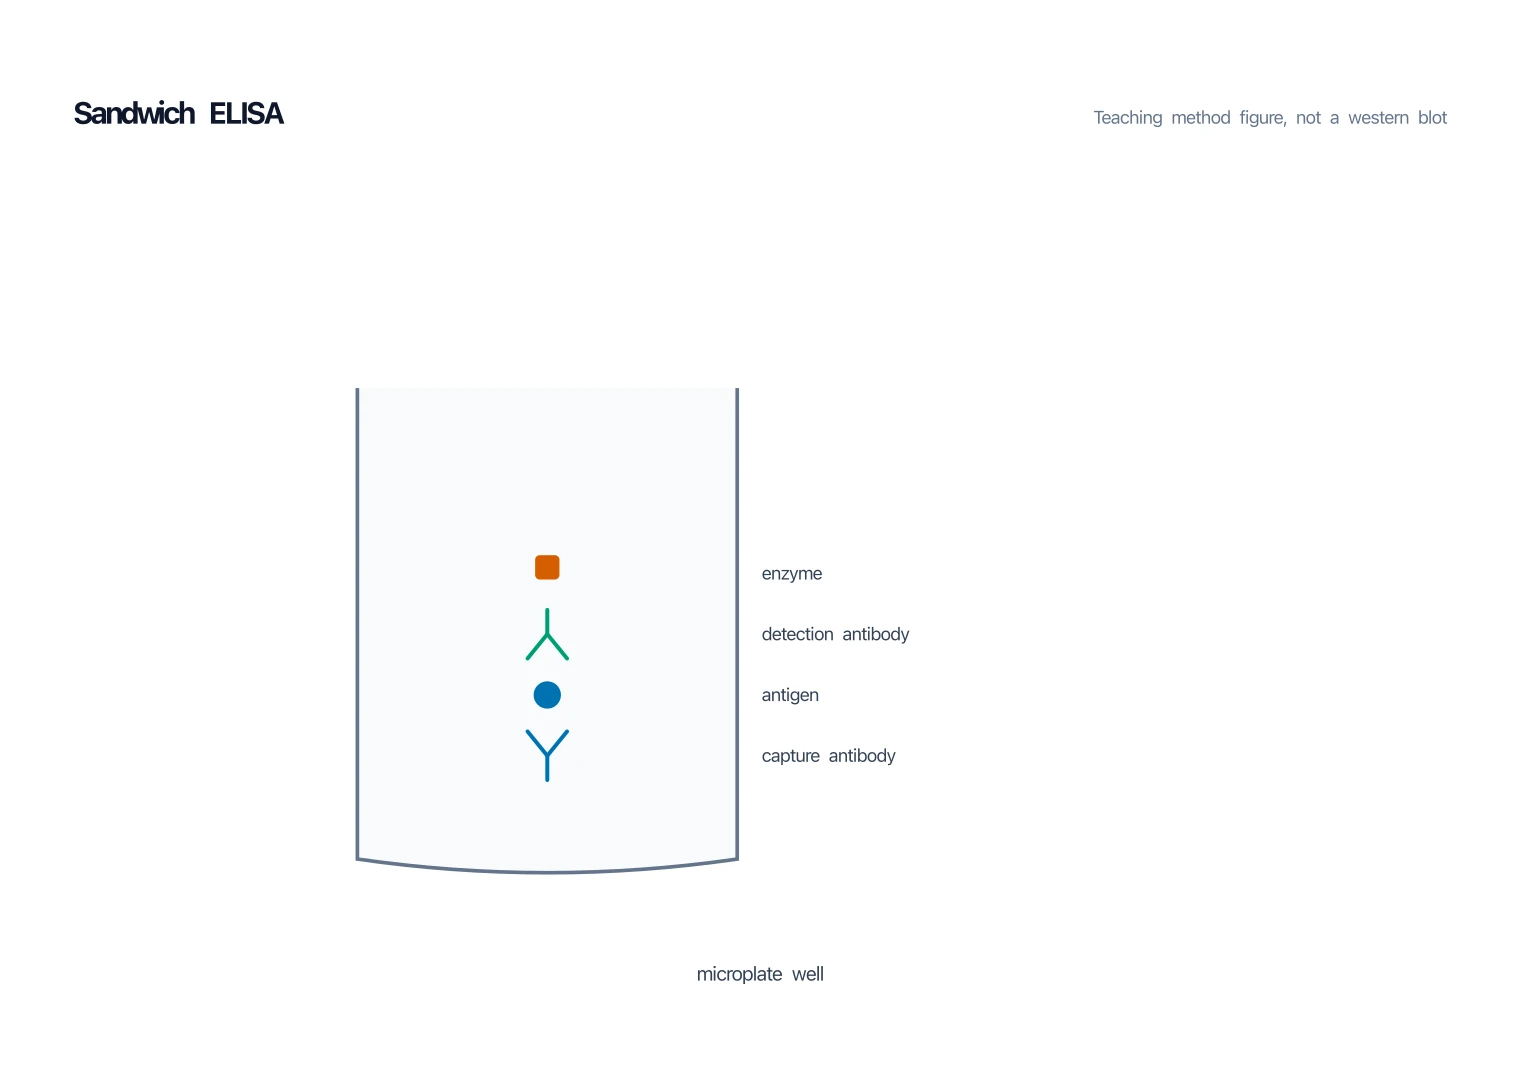
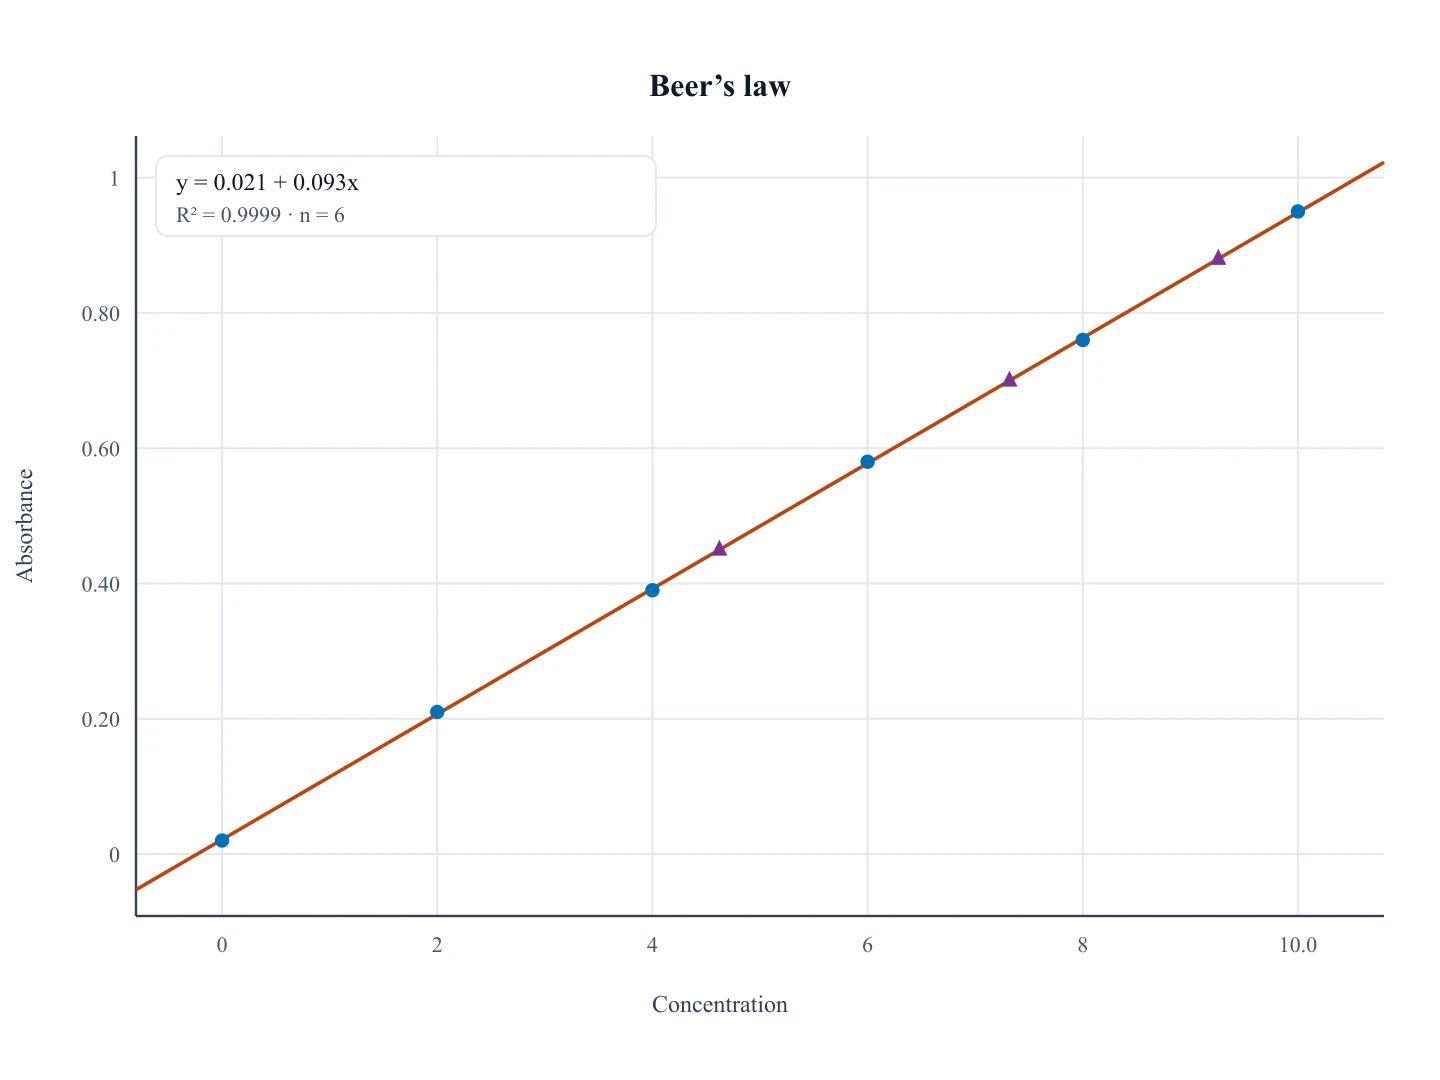
To explain the assay itself, draw the antibody stack with the ELISA diagram generator. To turn standards and readings into a fitted line, use the calibration curve generator or the dose-response curve generator. For an illustrated figure that a plate grid cannot show, try the AI scientific image generator; new accounts start free with 2 image credits, valid for 7 days, no card required. AI images are approximate and need a careful check before you use them.