Gene Therapy Diagram Generator
Create gene therapy diagrams for in vivo AAV, ex vivo lentiviral, CAR-T and CRISPR ex vivo workflows, with fixed labels and every AI flaw noted. Free to start.
Looking for a gene therapy picture? The examples below show how a gene reaches the cell in vivo and ex vivo, and each caption lists what the AI got wrong.
Create Your Gene Therapy Diagram
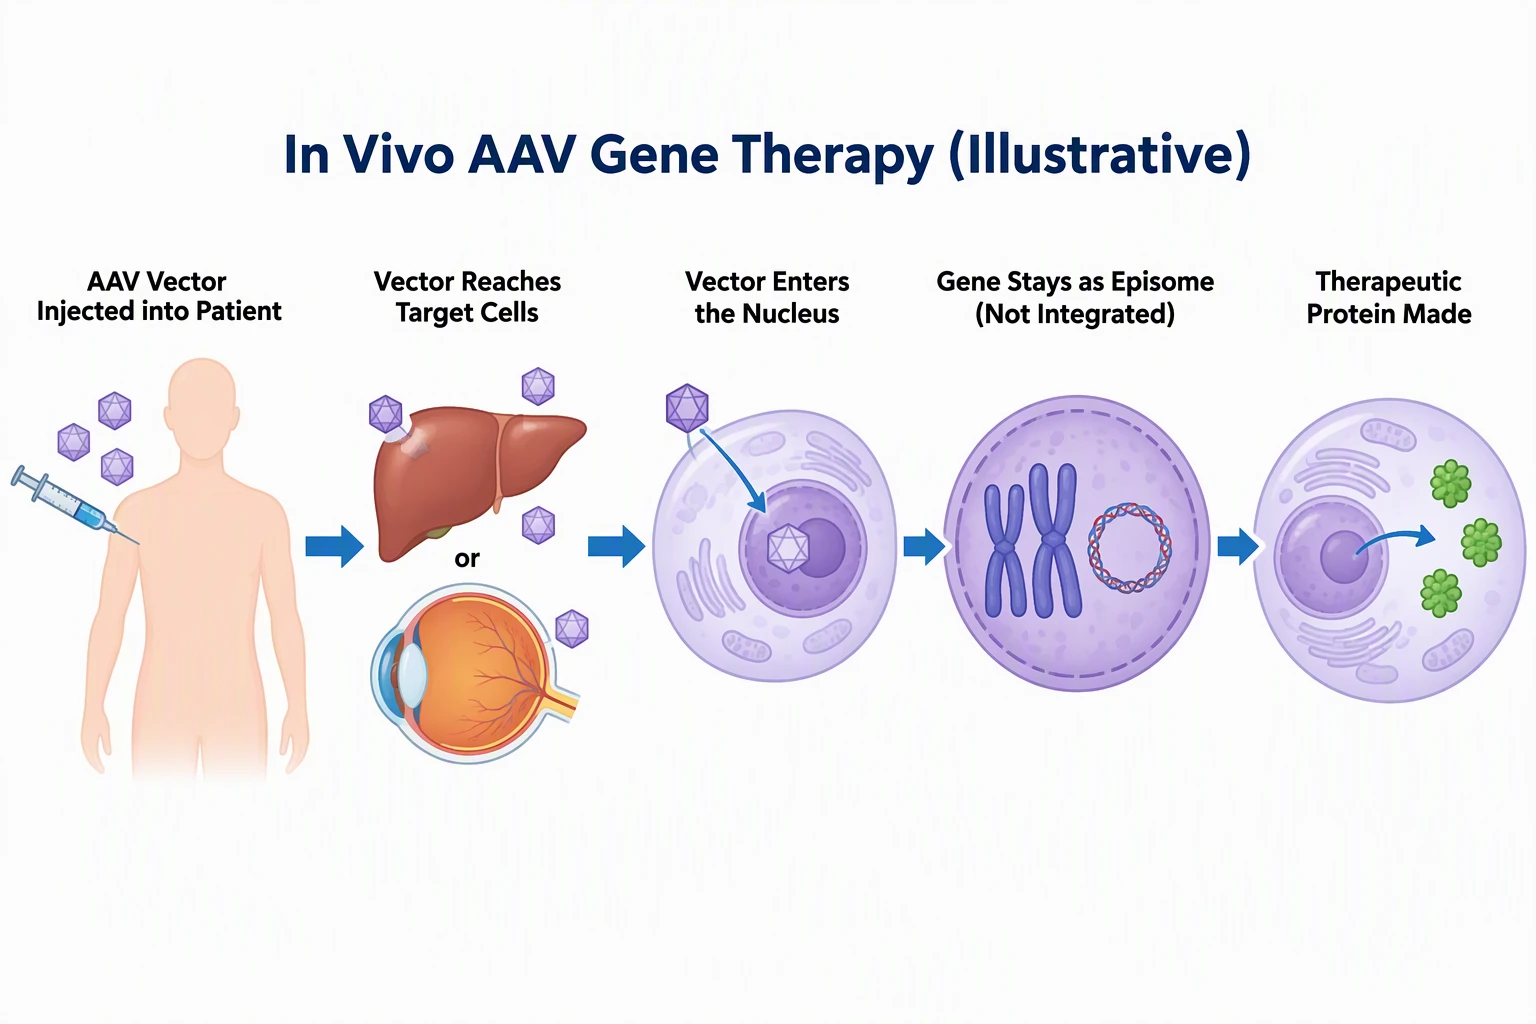 Example: In vivo AAV gene therapyView full size
Free preview on this page · Clean file download needs a
Your gene therapy diagram will appear here
AI diagrams are drafts. Check every label and arrow, and that the gene is shown as episomal, integrated, or edited as you intended. Educational illustration only; have a clinician or scientist review before use. No real patient data.
Gene Therapy Diagram Examples
Four AI diagrams, each compared with official sources and with known flaws noted. Educational illustrations only; a clinician or scientist should review before use.
In vivo AAV gene therapy diagram (AI illustration)
AI-generated from the prompt shown, on the first try, and every label came out spelled as written. The order is injection, target cells (liver or eye), nucleus, episome, protein, and the gene is drawn as a separate small circle beside the chromosomes, not inserted into one. That matches reviews that say recombinant AAV DNA mostly stays episomal in the nucleus (Checked October 2026). Known flaws: it is a stylized sequence and leaves out how the vector gets from the injection site to the cells, uncoating, and second-strand synthesis; an intact capsid is drawn entering the nucleus with no nuclear pore; the liver and eye targets do not match the single shoulder injection (real routes such as intravenous or subretinal delivery are not shown); "or" between the liver and the eye means one therapy targets one tissue, not both; AAV integrates rarely, so "Not Integrated" is the usual case, not an absolute; the empty protein-making cell does not show transcription or translation; the lower third of the image is blank; the body, liver and eye are not to scale. It is generic and does not show any approved product.
Ex vivo lentiviral gene therapy diagram (AI illustration)
AI-generated from the prompt shown, on the first try, and every label came out spelled as written. It follows the ex vivo idea in the FDA explainer (cells removed, modified outside the body, returned) and the steps FDA describes for lentiviral stem cell products such as Lyfgenia: collection, conditioning with chemotherapy, reinfusion (Checked October 2026). The zoom circle shows the gene joining a chromosome, which is the key difference from AAV. Known flaws: collection is drawn as a blood draw with a few loose cells, while real stem cell collection is a longer procedure; "Modified Cells Expanded" shows stacked dishes and does not show the quality checks real products pass before release; the conditioning drip is drawn as a yellow bag and the panel does not say it is high-dose chemotherapy for some products; the patient and chair are cropped at the left edge (first panel) and at the right and bottom edges (last panel); the viral vector is drawn bigger than the cells and holds a DNA double helix, although a lentiviral vector carries RNA that is copied into DNA inside the cell before it integrates; the insertion point on the chromosome is random in real life, but the picture shows one tidy spot; the lower half is blank.
CAR-T cell therapy diagram (AI illustration)
AI-generated on the first try from an earlier version of the preset prompt, which asked for the steps to "Flow in a loop"; the preset now asks for a clockwise sequence with no return arrow. Every label came out spelled as written. We compared the order with the National Cancer Institute CAR T-cell page (Checked October 2026): collect T cells, add the CAR gene, expand, return by infusion, with lymphodepleting chemotherapy before infusion. Known flaws: the arrow from the last panel back to the first comes from our own "loop" wording, not from the biology; the treatment is usually a single infusion for one patient, so read it as a layout, not a cycle; panels are cropped at the edges; apheresis is drawn with one line, while real apheresis uses a draw line and a return line; the killing panel shows the mechanism, not a guaranteed result; the viral vector holds a DNA double helix, although the lentiviral and gamma-retroviral vectors used for CAR-T carry RNA that is copied into DNA in the T cell; the vector and gene are drawn without showing that the CAR gene is delivered by a vector and then expressed as a receptor on the surface; the CAR on every cell in the expansion panel suggests all cells carry it, which real products do not guarantee; manufacturing off site, shipping, and quality testing, which NCI says take about 3 to 5 weeks overall, are not shown; the chemotherapy panel has a silhouette instead of a patient; the tumor cell is a generic shape and the antigen is unnamed. Prompt actually used: An educational diagram of CAR-T cell therapy manufacturing, landscape, title "CAR-T Cell Therapy (Illustrative)". Flow in a loop with labeled steps: "T Cells Collected (Leukapheresis)", then "T Cells Transduced with CAR Gene (Viral Vector)", then "CAR-T Cells Expanded", then "Lymphodepleting Chemotherapy", then "CAR-T Cells Infused into Patient", then "CAR-T Cells Recognize Tumor Antigen and Kill Cancer Cells" showing a T cell with receptors binding a cancer cell.
CRISPR ex vivo gene editing diagram (AI illustration)
AI-generated from the prompt shown, on the first try, and the five step labels came out spelled as written. It matches the FDA description of Casgevy, the first FDA-approved CRISPR/Cas9 therapy: blood stem cells are collected, edited outside the body, the patient has conditioning, and the edited cells are transplanted back (Checked October 2026). Known flaws: it adds two small labels we did not ask for, "Cas9" and "guide RNA" (both correct, but the guide RNA label is lowercase while the rest is title case); the Cas9 scissors icon is a cartoon and does not show the PAM, the cut site, or repair; the Cas9 and guide RNA cloud floats above the dish, so delivery into the cells (for example electroporation) is not shown; stem cell collection is drawn as a simple blood draw, while real collection uses mobilization and apheresis; patients are cropped at the edges; the picture does not say which gene is edited or why; the check mark on the cell stands for quality checks without naming them; conditioning is drawn as a calm drip beside a relaxed patient and does not say it is high-dose chemotherapy for the approved products; the lower fifth of the image is blank. For the CRISPR mechanism itself use the CRISPR Cas9 Diagram Generator.
For how Cas9, guide RNA and DNA repair work, use the CRISPR Cas9 Diagram Generator. For the structure of a virus, try the Virus Diagram Generator, and for immune organs the Lymphatic System Diagram Generator.
What a gene therapy diagram shows
A gene therapy diagram shows how a working gene, or an edit to a gene, gets into the cells that need it. FDA describes gene therapy as a technique that modifies a person's genes to treat or cure disease, by replacing a disease-causing gene with a healthy copy, inactivating a disease-causing gene, or introducing a new or modified gene (Checked October 2026). A useful diagram answers four questions: what is delivered (a gene, an edit), what carries it (a viral vector, an editing system), where the change happens (inside the body or in a dish), and what the cell does afterward. This page drafts those pictures from text with the labels you choose. It is for students, teachers, patient educators, and scientists, and it is not medical advice.
In vivo vs ex vivo gene therapy
- FDA's explainer draws the two major types side by side. In ex vivo gene therapy, cells are modified outside the body and then delivered back to the patient. In in vivo gene therapy, the genetic modification of the cell takes place inside the body (Checked October 2026).
- On a diagram the difference is where the arrows go. In vivo shows the vector entering the patient directly. Ex vivo shows a loop: cells out, change in the lab, cells back, often with conditioning before the return. Put "In Vivo" or "Ex Vivo" in the title so the reader knows which loop they are looking at.
AAV and lentiviral vectors: episomal or integrating
- This is the detail diagrams most often get wrong. Recombinant AAV vectors mostly stay as separate circular DNA in the nucleus (episomal) and rarely integrate into the genome. A Molecular Therapy review says most rAAV DNA typically remains episomal, with low-frequency integration. Because episomal DNA is not copied when a cell divides, AAV suits long-lived cells such as retinal cells, muscle, and neurons, and expression can fade in cells that divide quickly.
- Lentiviral vectors used in cell therapies are different: the gene is designed to be integrated into the host cell genome, so it is passed on when modified cells divide. FDA describes Lyfgenia, a sickle cell disease therapy, as using a lentiviral vector to modify the patient's own blood stem cells, and notes a boxed warning for hematologic malignancy (Checked October 2026). If you draw adenovirus or other vectors, check their behavior in a named source first and label the source.
CAR-T cell therapy: the steps to draw
- The National Cancer Institute describes it this way: T cells are collected from the patient's blood, genetically engineered in a manufacturer's laboratory to make chimeric antigen receptors (CARs) on their surface, grown ("expanded") until there are hundreds of millions, and returned as a single infusion. NCI says the whole process, from blood collection to infusion, takes about 3 to 5 weeks (Checked October 2026).
- Lymphodepleting chemotherapy before the infusion is standard in many protocols, but it is a clinical step that depends on the product, so mark it as "often" if you are not tied to one label. CAR-T is a straight line for one patient, not a repeating loop. FDA lists Kymriah, a CD19-directed genetically modified autologous T-cell immunotherapy, as one example (Checked October 2026).
CRISPR ex vivo editing: where this page stops
Casgevy is the first FDA-approved therapy to use CRISPR/Cas9. FDA says the patient's blood stem cells are collected, edited outside the body, and transplanted back after conditioning with high-dose chemotherapy (Checked October 2026). This page draws that treatment workflow. For what Cas9, guide RNA, the PAM, and DNA repair do, use the CRISPR Cas9 Diagram Generator, which owns that mechanism.
Approved therapies you can use as examples
- FDA lists Zolgensma as an adeno-associated virus vector-based gene therapy for pediatric patients under two years of age with spinal muscular atrophy and bi-allelic SMN1 mutations. FDA approved Casgevy (CRISPR/Cas9) and Lyfgenia (lentiviral vector) for sickle cell disease in December 2023 (Checked October 2026).
- Use the exact product name, the indication, and a link to the FDA page when a diagram names a real therapy. If you only want to teach the idea, leave brand names out, as our four examples do.
How to make a gene therapy diagram you can defend
- Pick one type: in vivo, ex vivo, CAR-T, or editing, and say it in the title.
- Write the steps as short fixed labels in the prompt, in the order from a named source, such as FDA, NCI, or a review.
- State what happens to the gene: stays episomal (AAV), integrates (lentiviral), or is edited (CRISPR). Say it in a label so the picture cannot imply the wrong thing.
- Say where each step happens: inside the body or outside the body.
- Ask for no brand names, no numbers, and nothing beyond the labels you gave.
- Generate, then read every label and every arrow. Check the direction of flow and that the right cells go back to the right patient.
- Add the source and "Educational illustration" as footer text, and have a clinician or scientist review it before patient or publication use.
Sources
Checked October 2026:
- FDA: What is Gene Therapy?
- FDA: FDA Approves First Gene Therapies to Treat Patients with Sickle Cell Disease
- FDA: Zolgensma
- FDA: Kymriah (tisagenlecleucel)
- National Cancer Institute: CAR T Cells: Engineering Patients' Immune Cells to Treat Their Cancers
- Molecular Therapy: Evaluating the state of the science for adeno-associated virus integration
- Recombinant Adeno-associated Virus Transduction and Integration (review)
What the AI examples got wrong
All four pictures were generated on the first try from the prompts shown (the CAR-T caption gives the earlier prompt it was made with), and every label was spelled as asked. The workflow order and episomal versus integrating forms held up; the one biology error is DNA drawn inside the lentiviral and CAR-T vector particles (lentiviral and gamma-retroviral vectors carry RNA). In detail: the AAV gene sits beside the chromosomes, the lentiviral gene joins a chromosome, ex vivo cells leave and return, and CAR-T runs collect, engineer, expand, infuse. Beyond that one error, what went wrong is simplification: a loop arrow on the CAR-T picture that came from our own "loop" wording, cut-off patient figures, large empty areas, a lowercase "guide RNA" label, no quality-control or manufacturing steps, and no timing or dose. Each caption lists these. Other things to watch for in your own results are an AAV gene drawn inside a chromosome, a lentiviral gene left floating, in vivo and ex vivo mixed up, arrows pointing the wrong way, misspelled labels, and invented steps.
Educational use only
These are educational illustrations. They are not medical advice and do not describe any one patient's treatment. A clinician or scientist should review each diagram before it is used with patients or in a publication or grant.
Privacy
Do not enter patient names, record numbers, or real patient data. Describe the therapy in general terms.
Free trial and downloads
Start free with 2 image credits, valid for 7 days, no card required. Free accounts download PNG or JPG.
Frequently Asked Questions
Related Biology Tools
 Biology
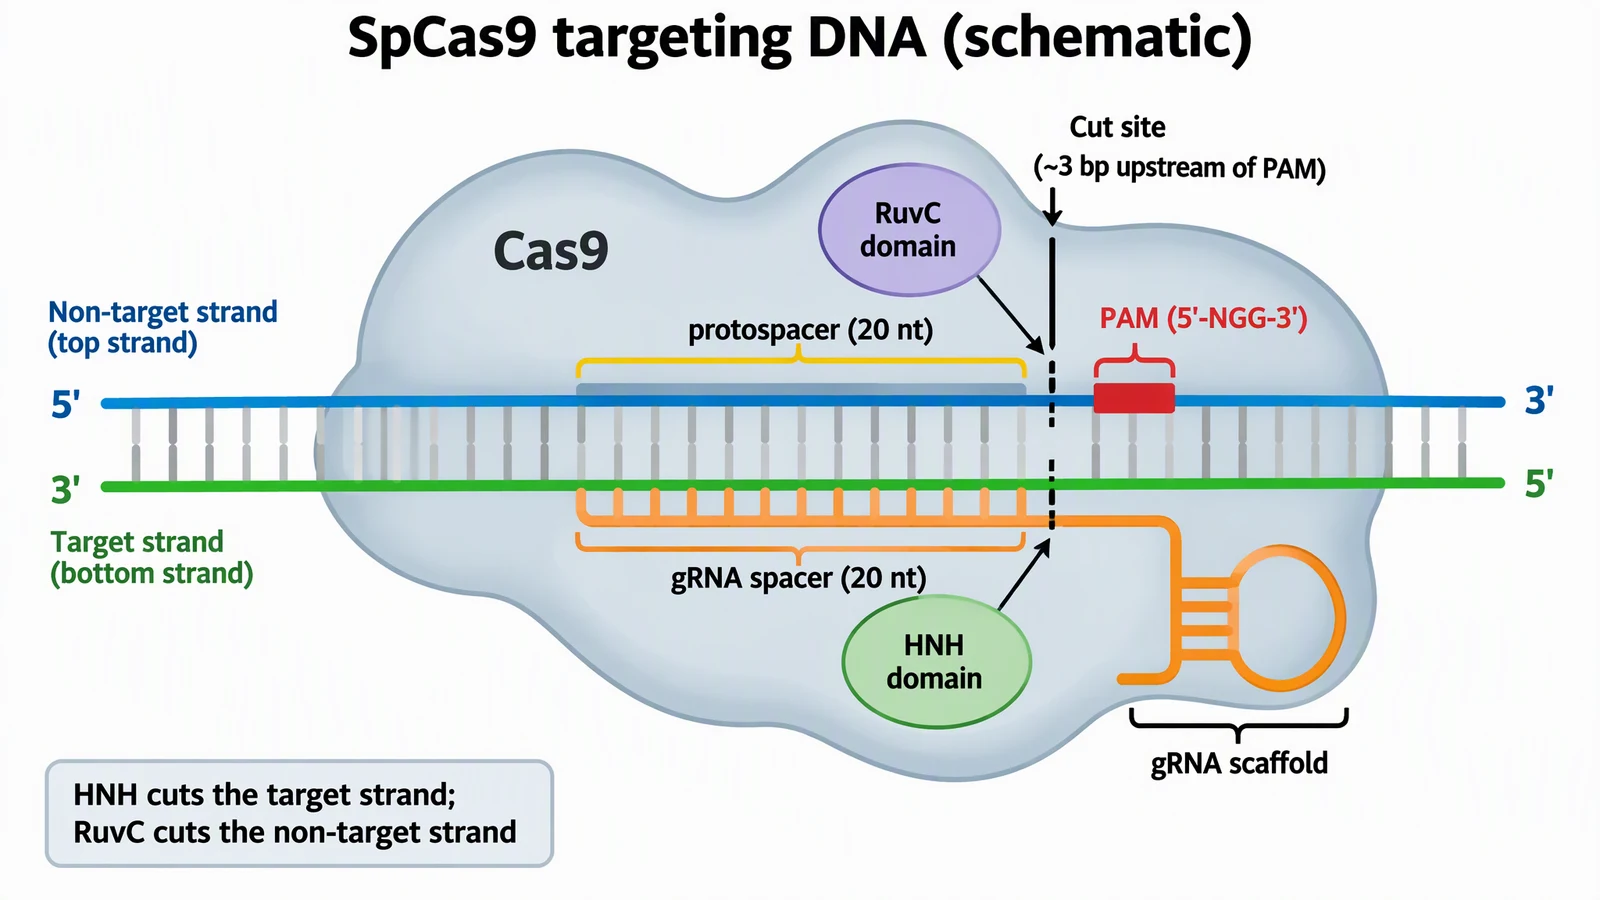
CRISPR Cas9 Diagram Generator
Guide RNA, PAM, cut site, NHEJ vs HDR, and knockout workflow diagrams.
 Biology
Virus Diagram Generator
Labeled virus structure, bacteriophage, and enveloped virus diagrams.
 Biology
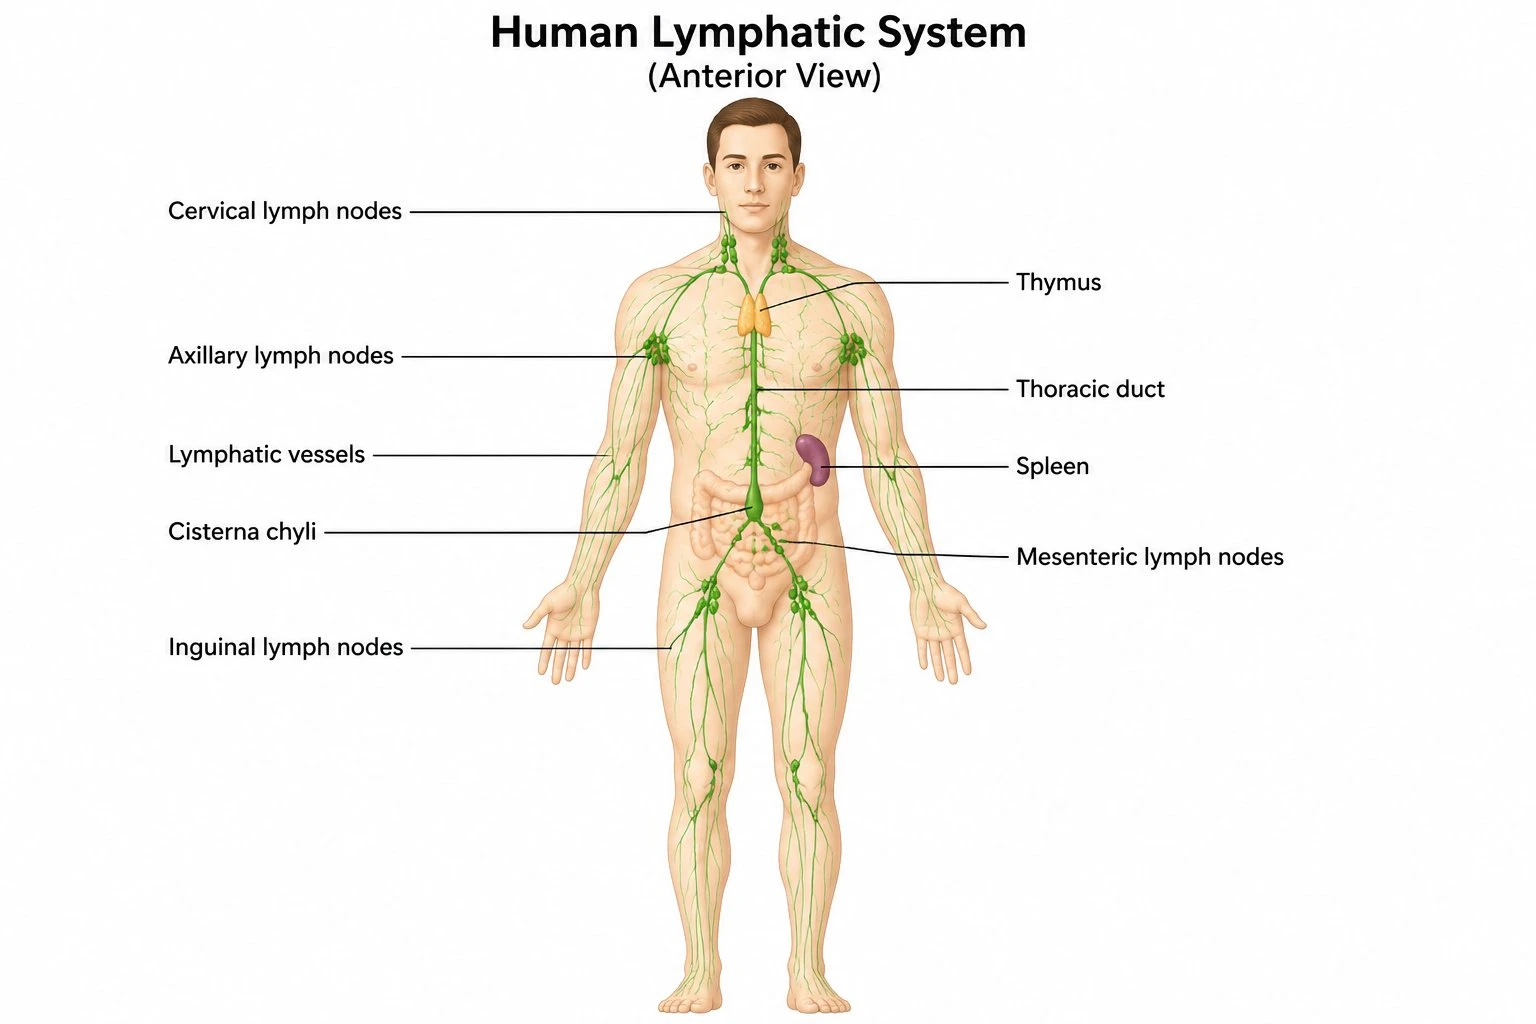
Lymphatic System Diagram Generator
Labeled lymphatic system and immune organ diagrams for study and teaching.