Business and Strategy Diagram Templates
Business diagrams turn a messy problem into something a team can discuss: a process boundary, a ranked list of risks, a decision between options. This hub collects the strategy, quality and planning diagram templates on ConceptViz.
Process and quality diagrams such as SIPOC, value stream maps and fishbone charts help you find waste and root causes. Decision and risk diagrams, including issue trees, Pugh matrices, risk heat maps and tornado charts, help you compare options on explicit criteria. Growth and economics diagrams cover flywheels and production possibilities.
Patent drawings and claim charts and social work tools such as ecomaps and genograms sit in their own groups.
25 pages in this collection. Jump to: Process and quality · Decisions and risk · Growth and economics · Patents and intellectual property · Social work and planning
Process and quality
Map a process and find where it breaks.
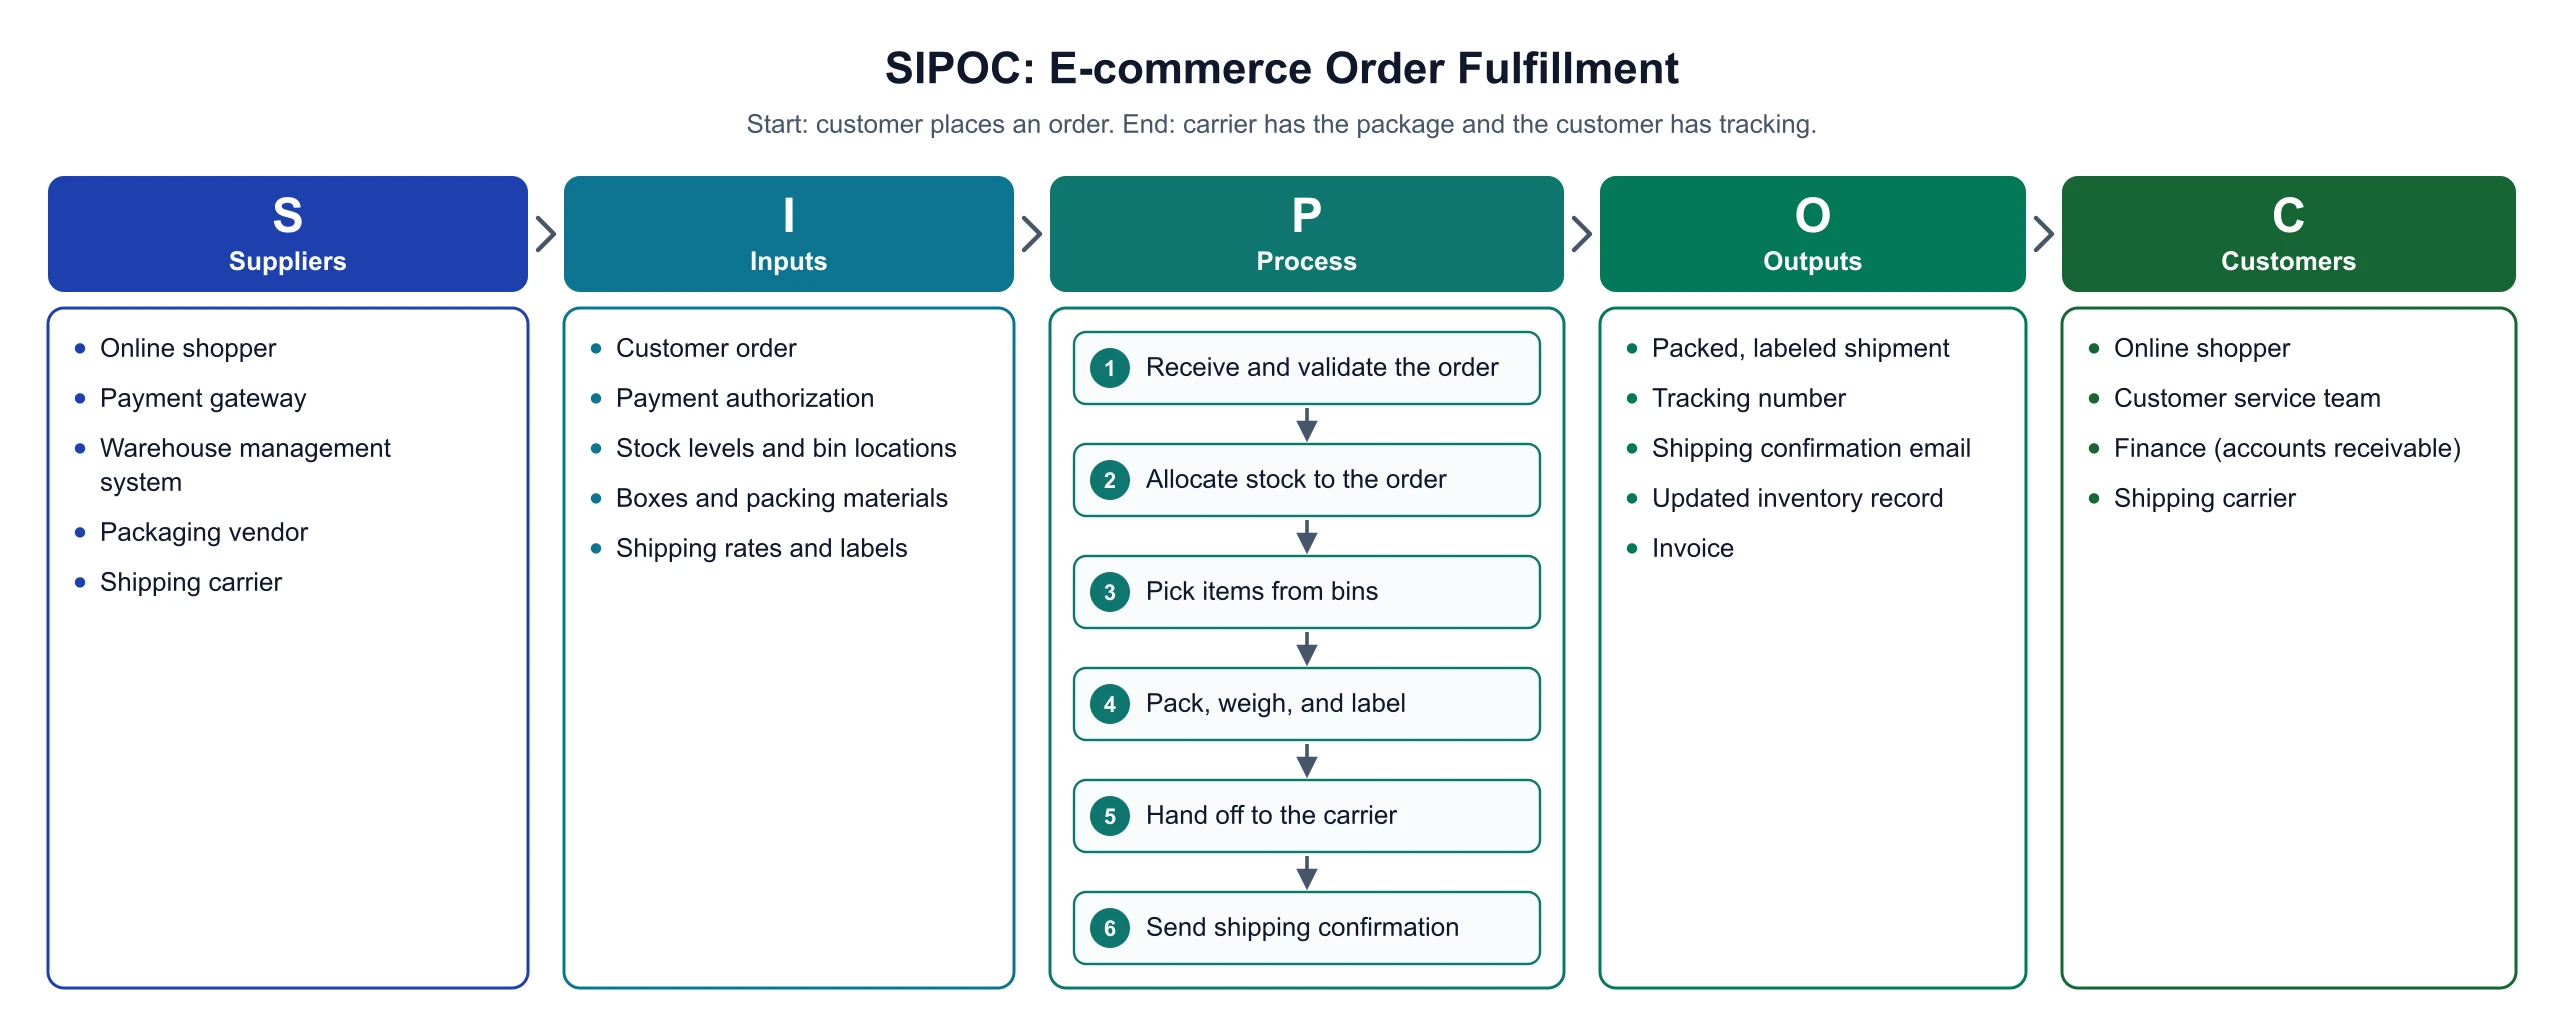 SIPOC Diagram MakerFill in suppliers, inputs, process steps, outputs, and customers and download an exact SIPOC diagram or blank template as SVG or PNG.
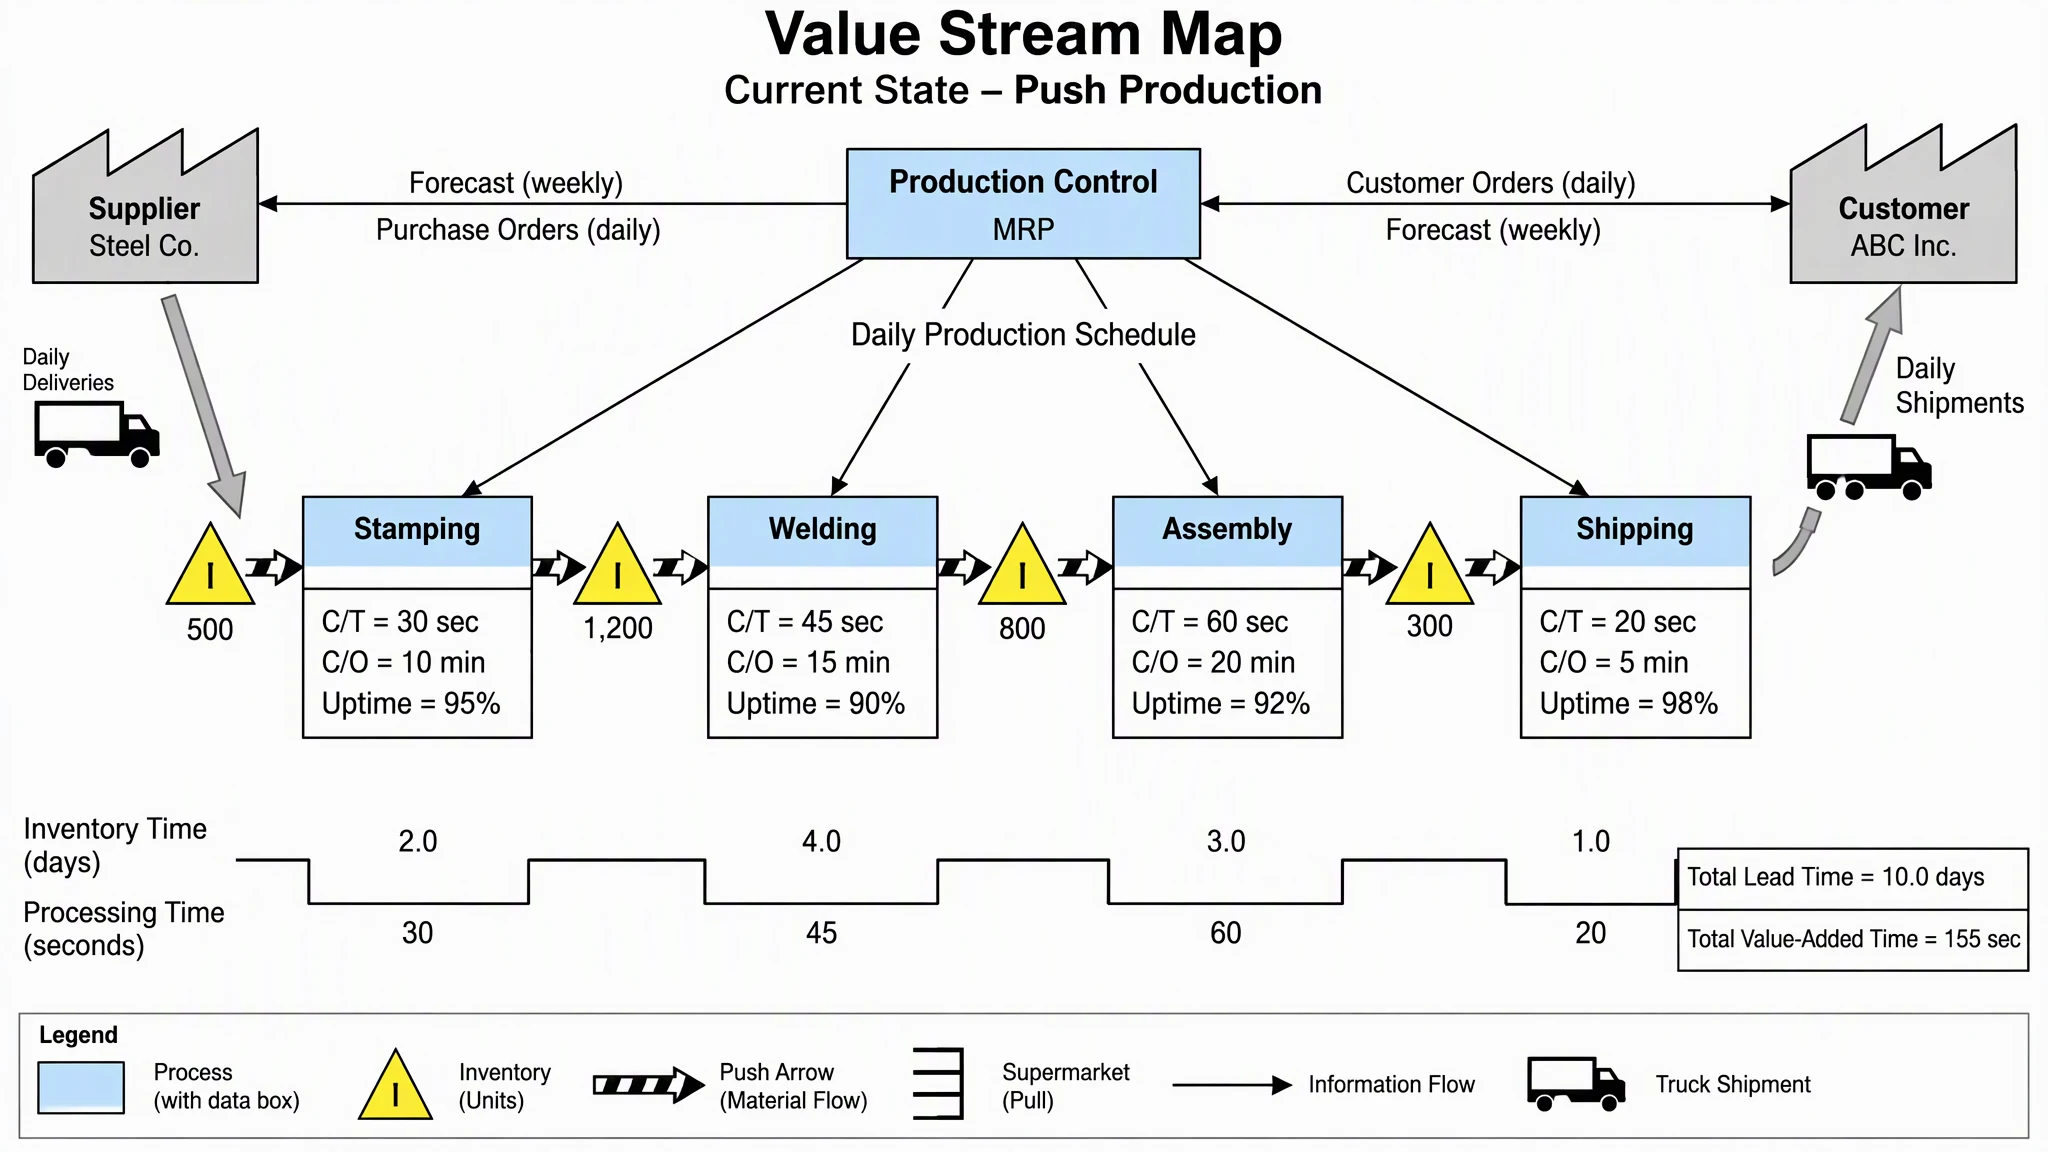 Value Stream Map MakerMake a value stream map with process boxes, data boxes, inventory triangles, push or pull arrows, and a lead-time timeline.
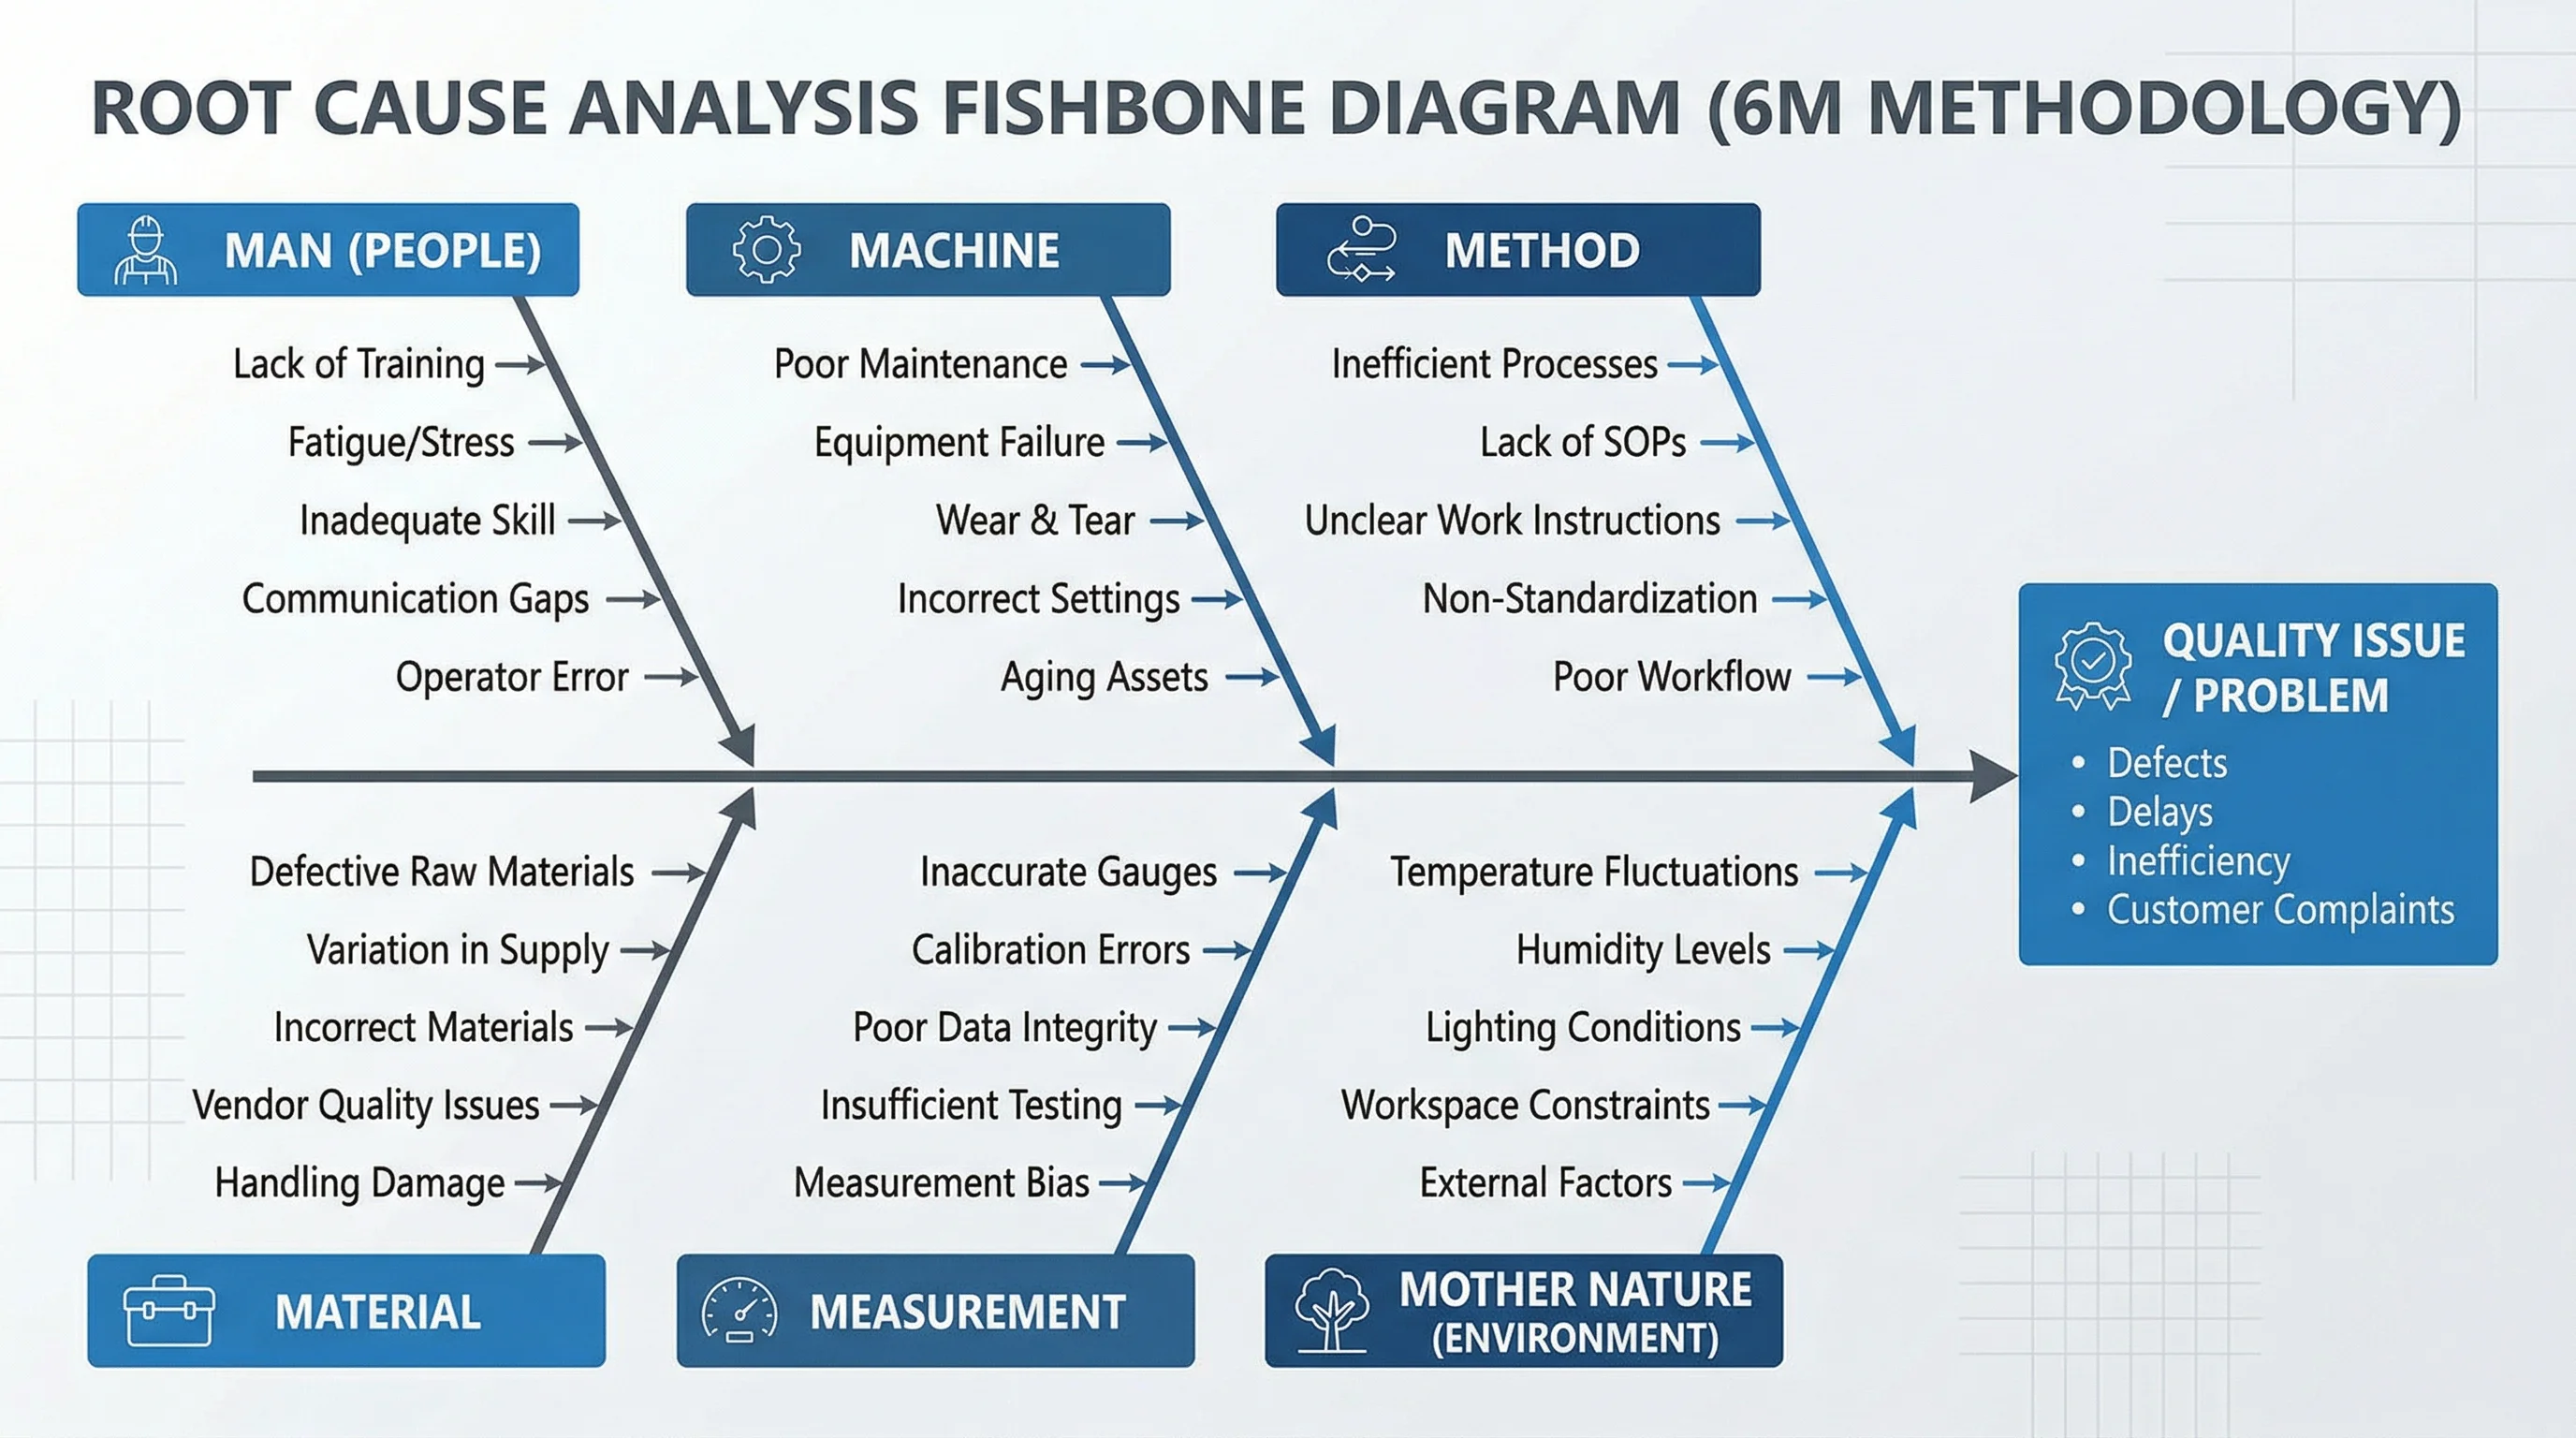 Fishbone Diagram GeneratorCreate fishbone (Ishikawa) diagrams for root cause analysis and quality management.
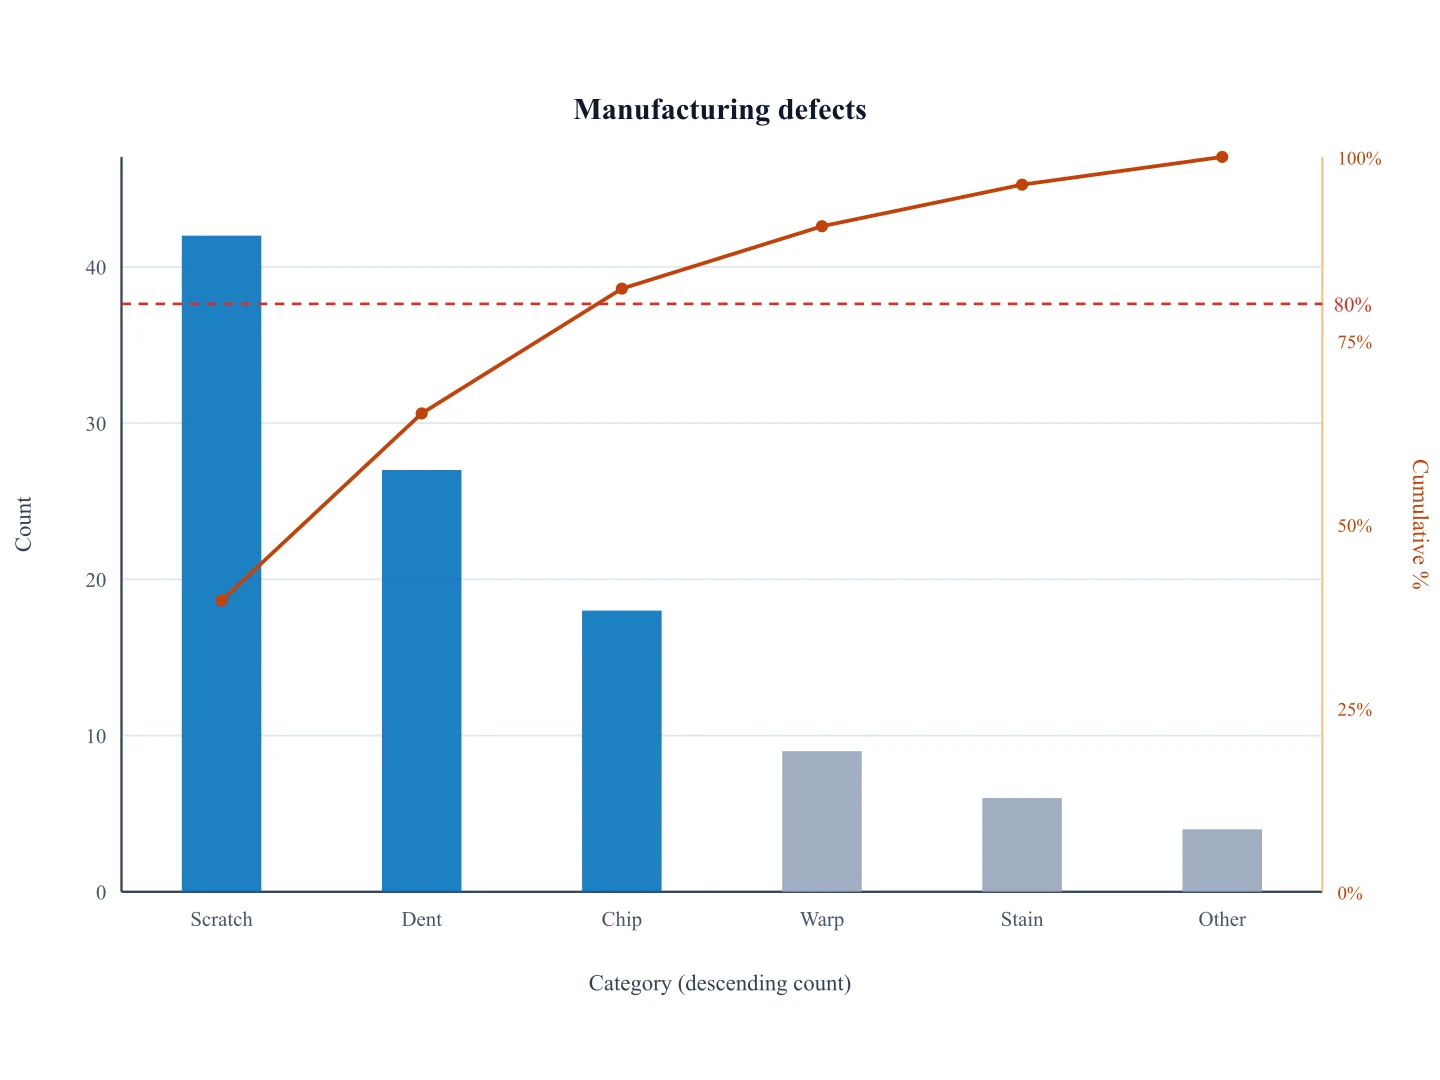 Pareto Chart GeneratorPaste categories and counts to draw an exact 80/20 Pareto chart and download SVG.
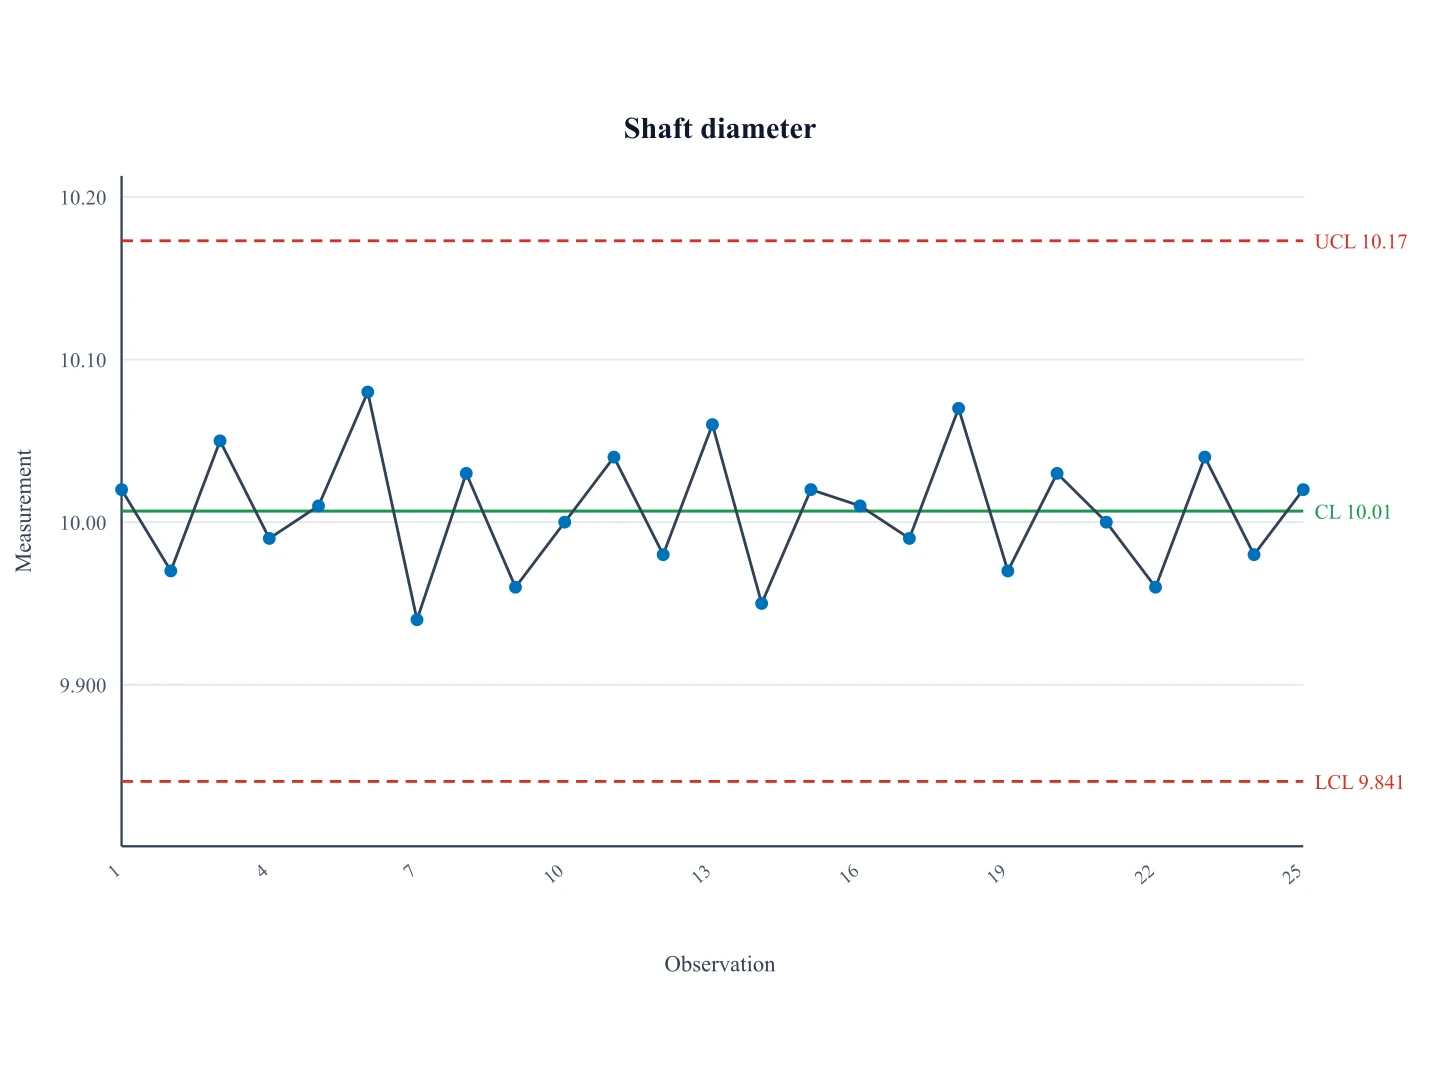 Control Chart GeneratorPaste sequential measurements to draw a Shewhart I-chart with CL, UCL, and LCL.
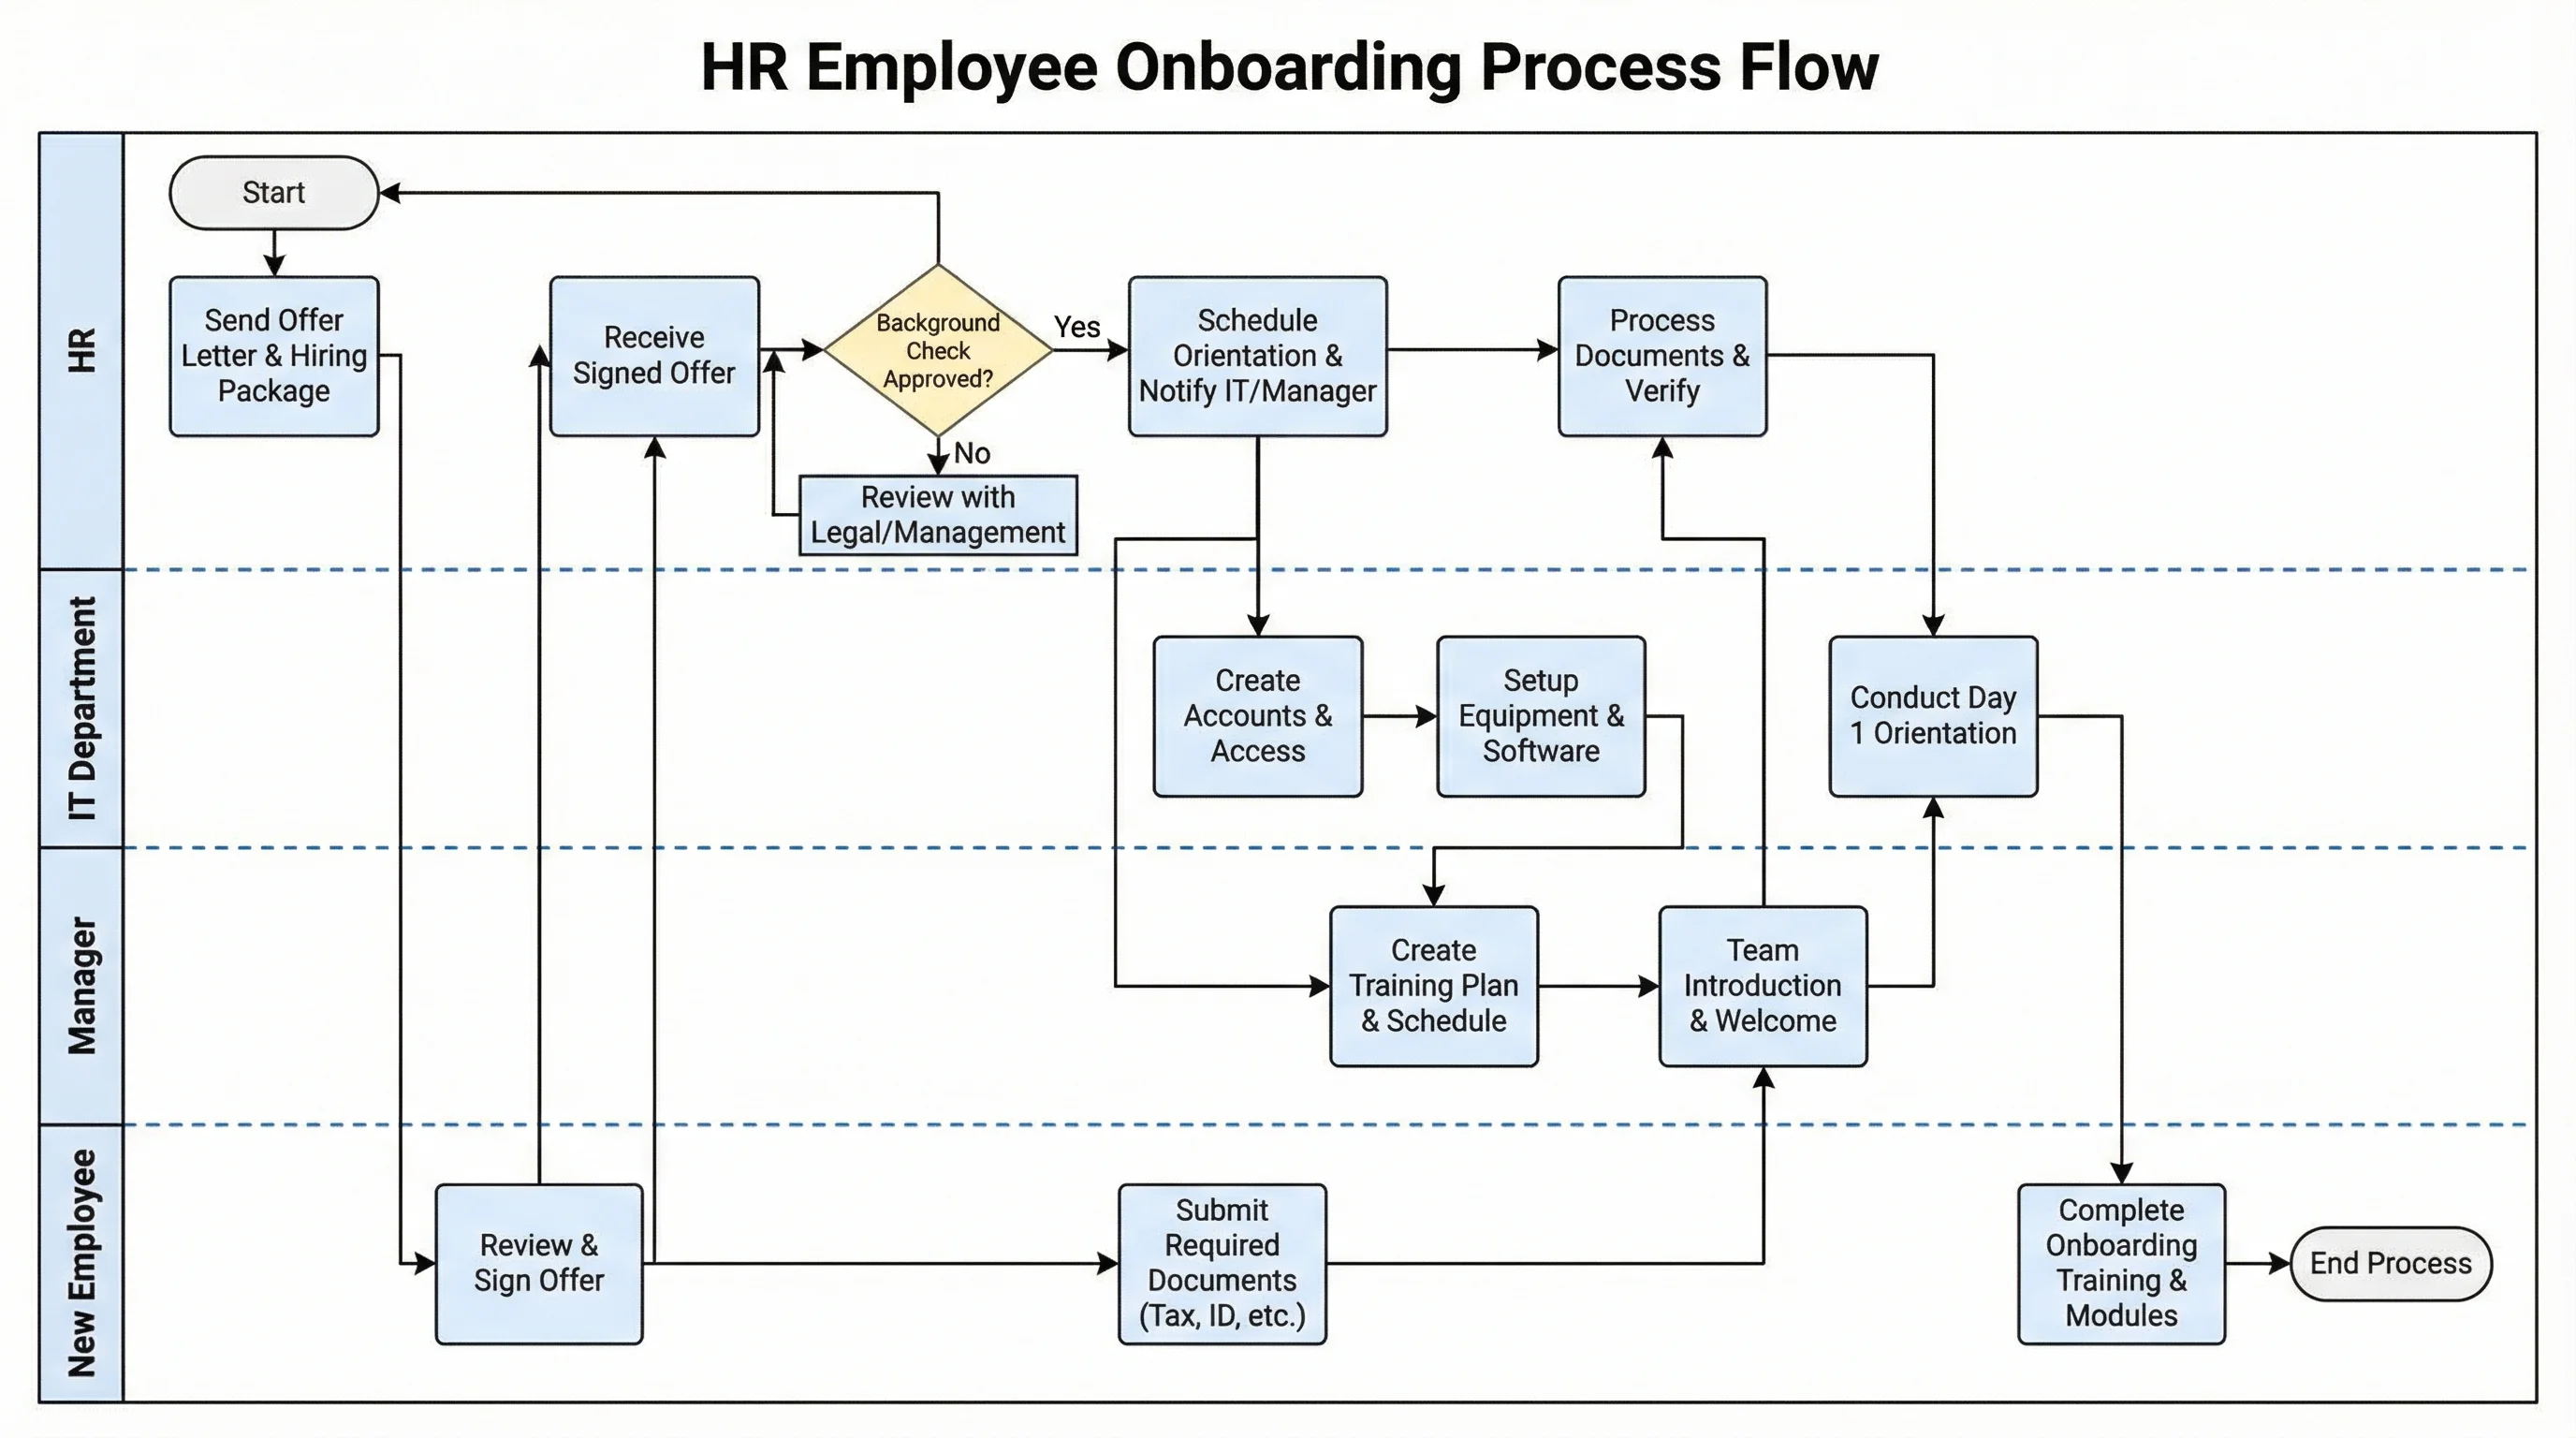 Swimlane Diagram GeneratorCreate professional swimlane diagrams and cross-functional flowcharts online.
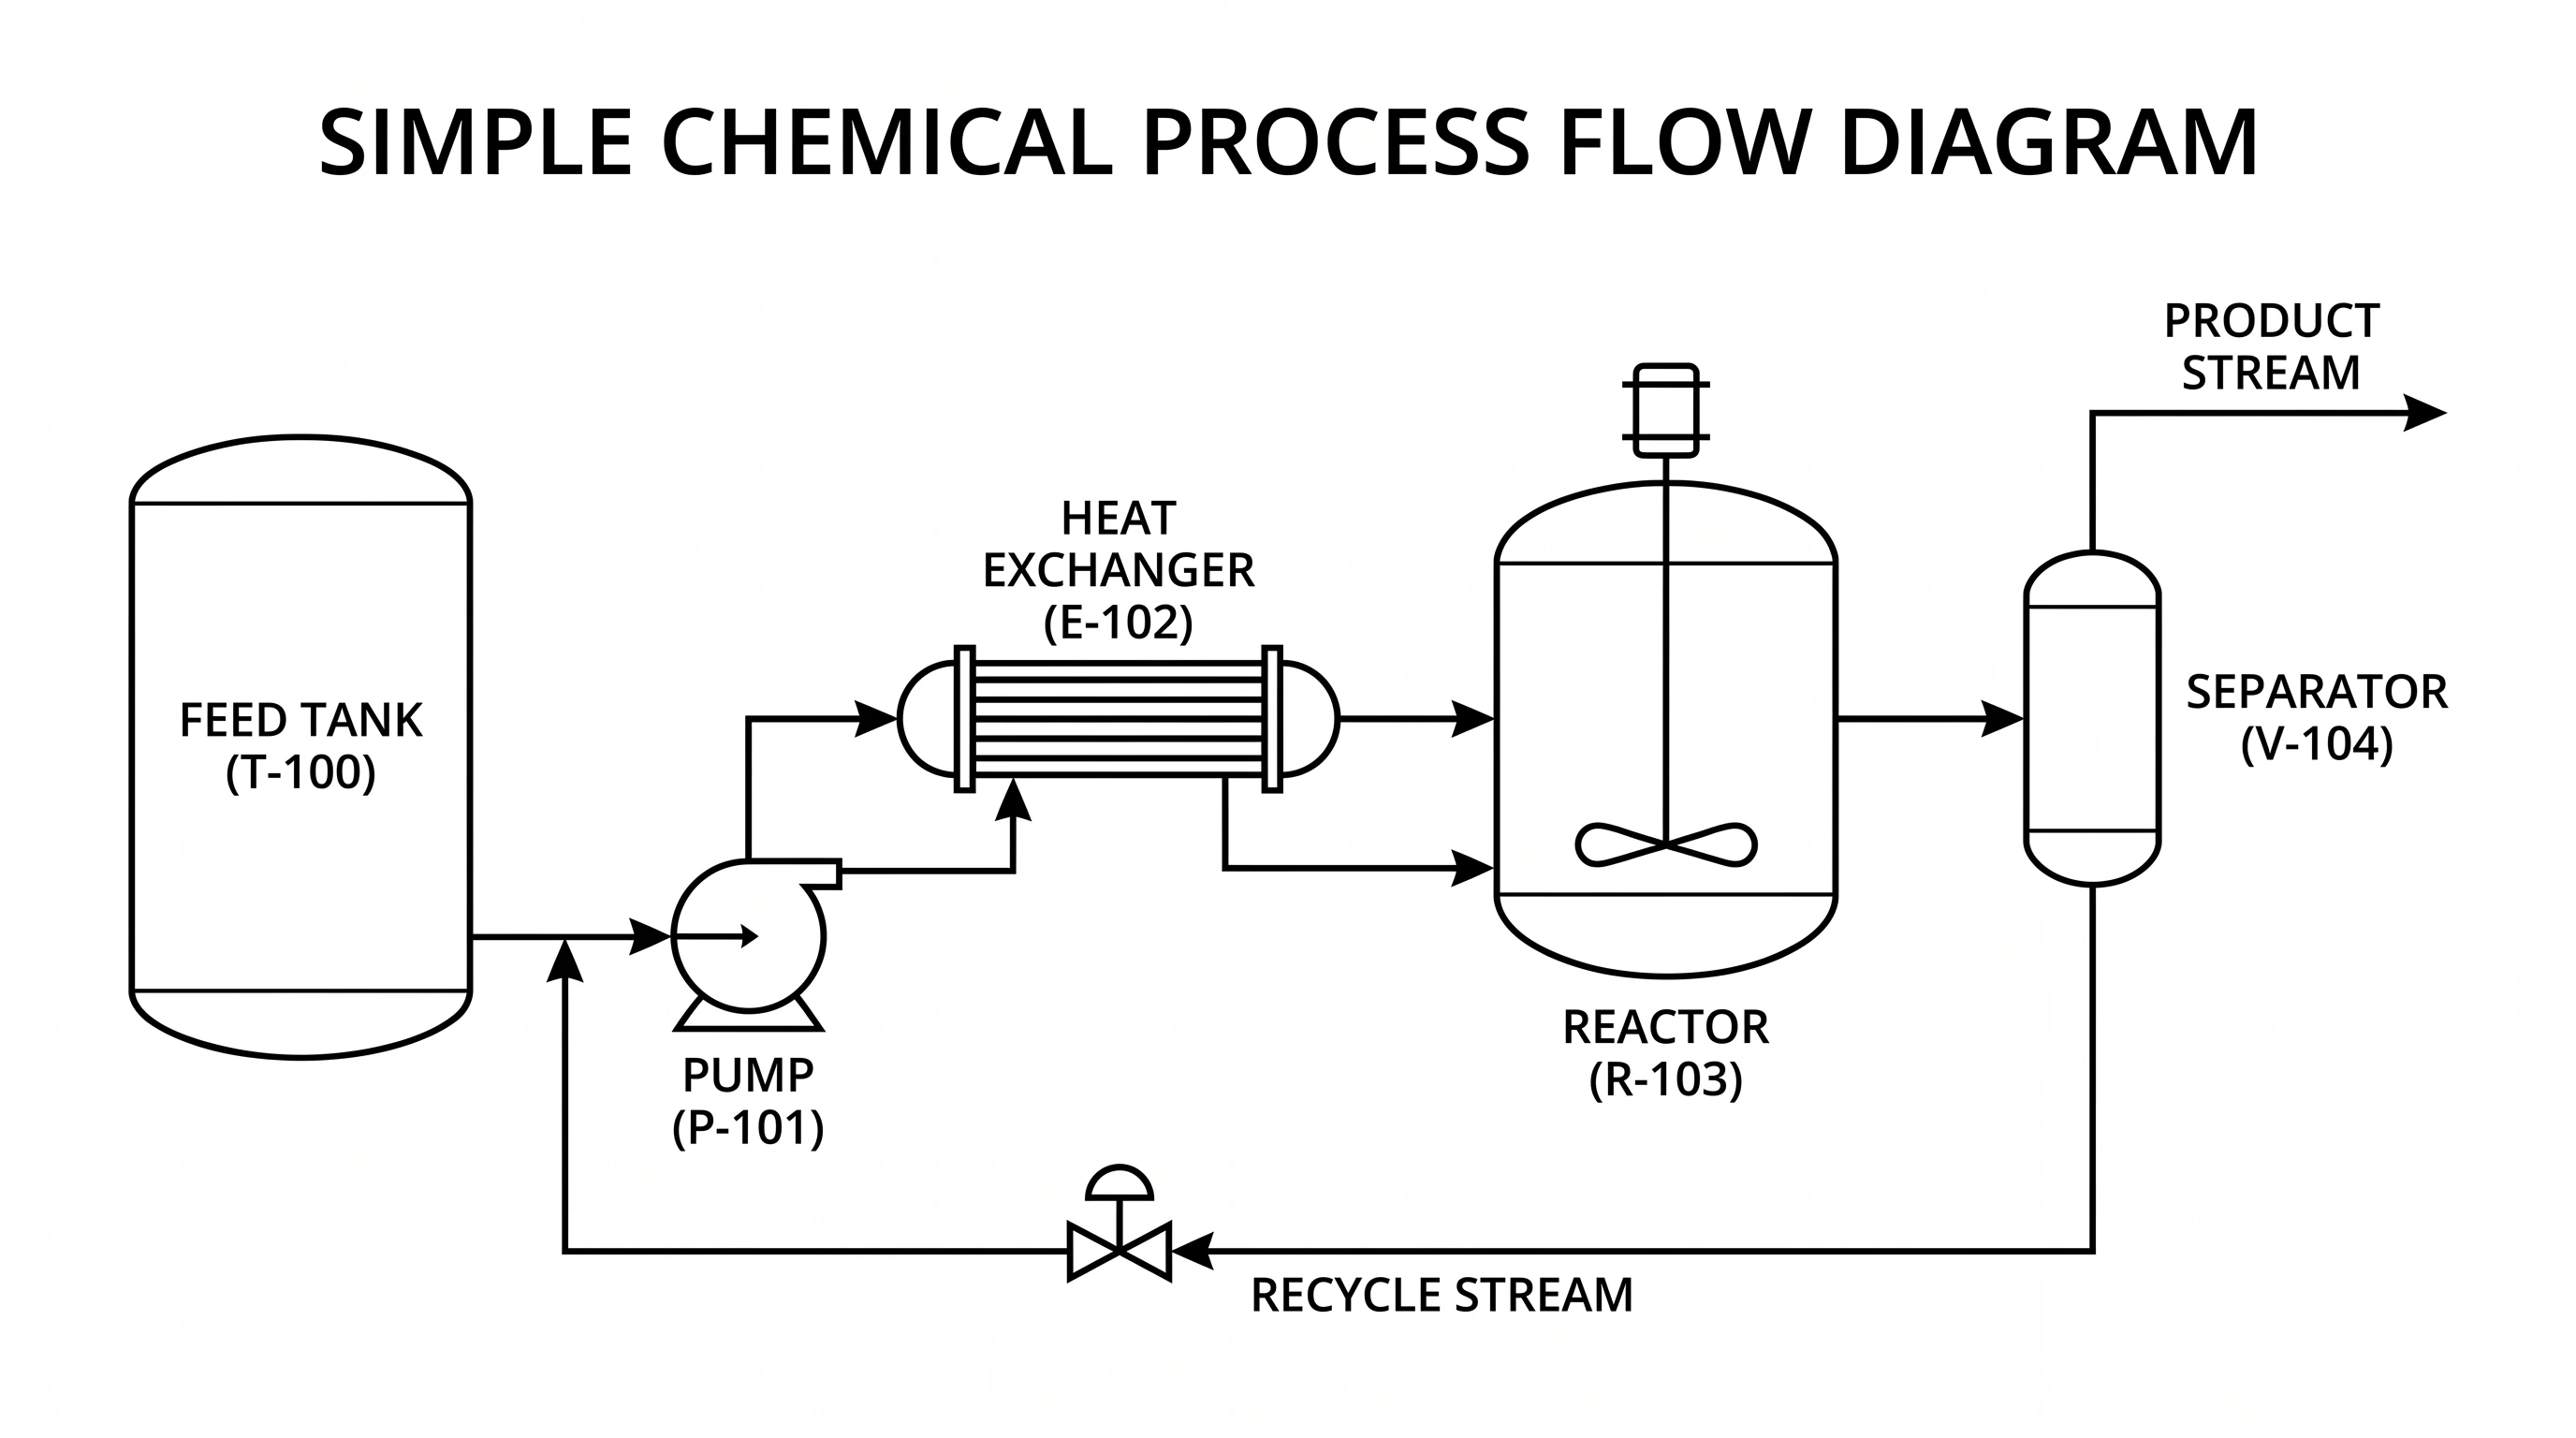 Process Flow Diagram GeneratorCreate process flow diagrams (PFDs) with AI — major equipment (tanks, pumps, reactors, columns, heat exchangers) connected by labeled material-flow streams.
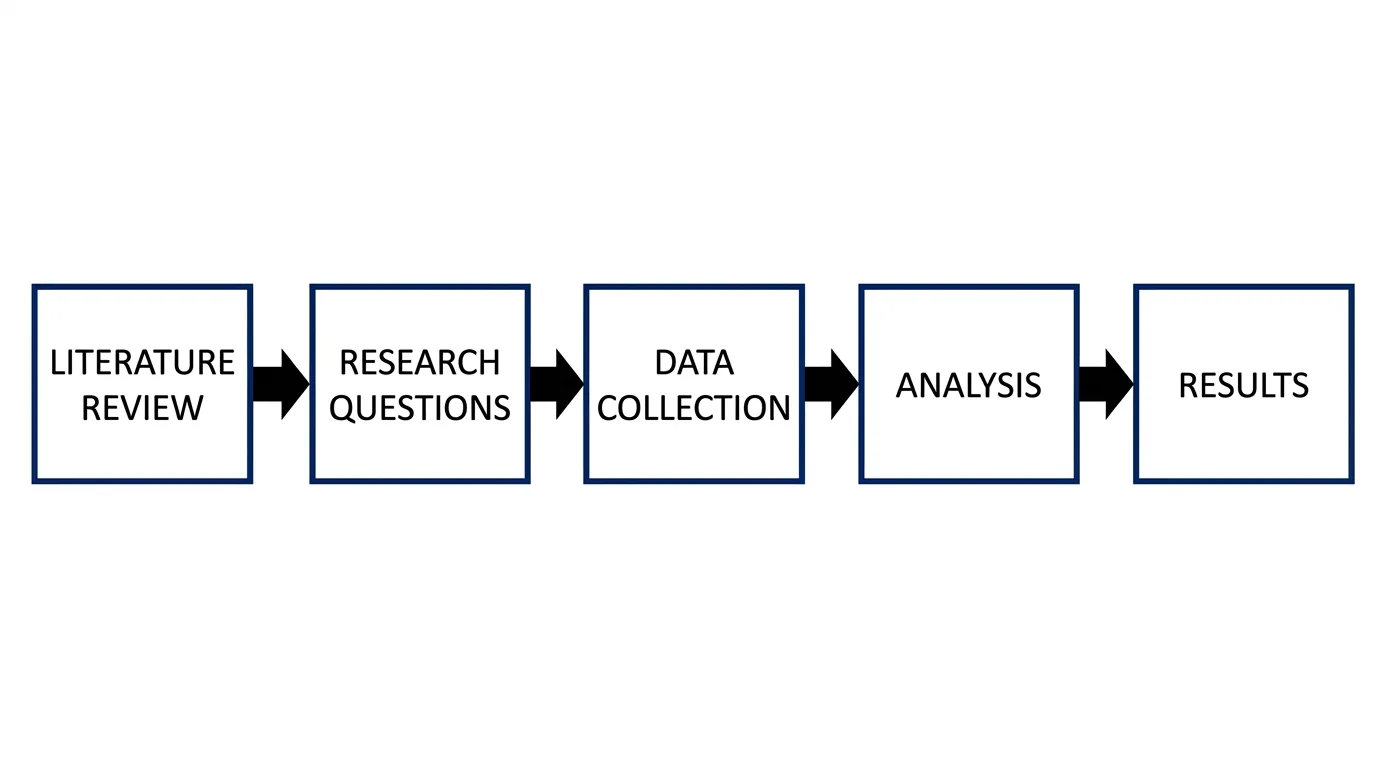 Workflow Diagram GeneratorCreate professional workflow and process diagrams for research protocols, clinical trials, and project management.
Decisions and risk
Compare options and size the downside.
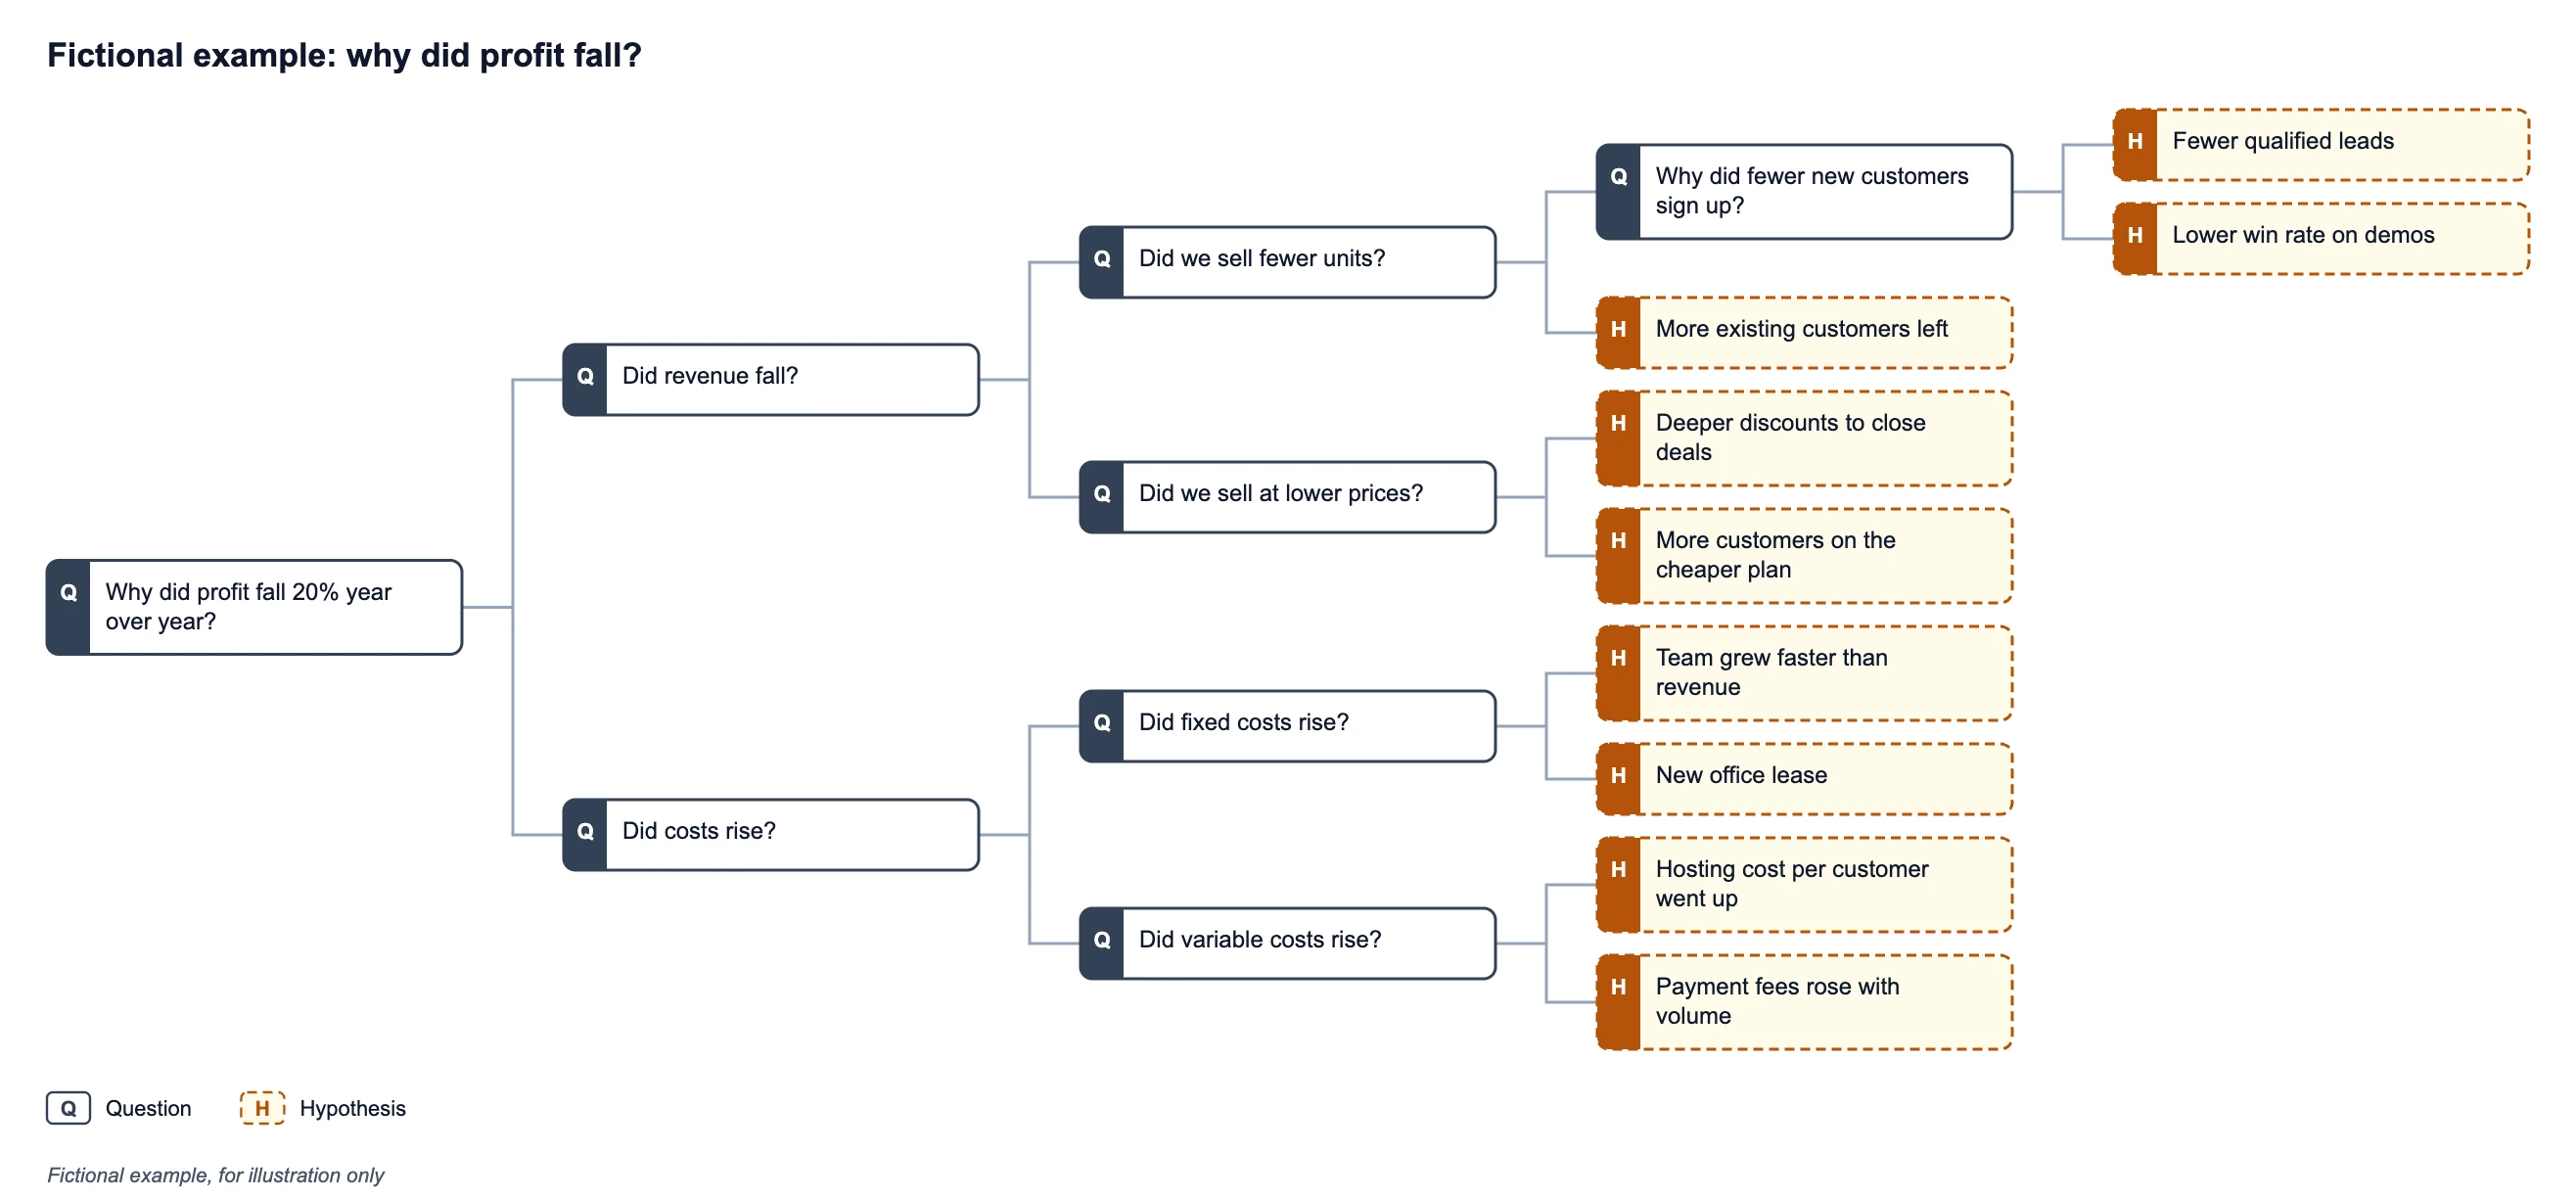 Issue Tree GeneratorBreak a problem into branches, mark hypotheses, add numbers for a driver tree, and export the issue tree as SVG, PNG, CSV or an outline.
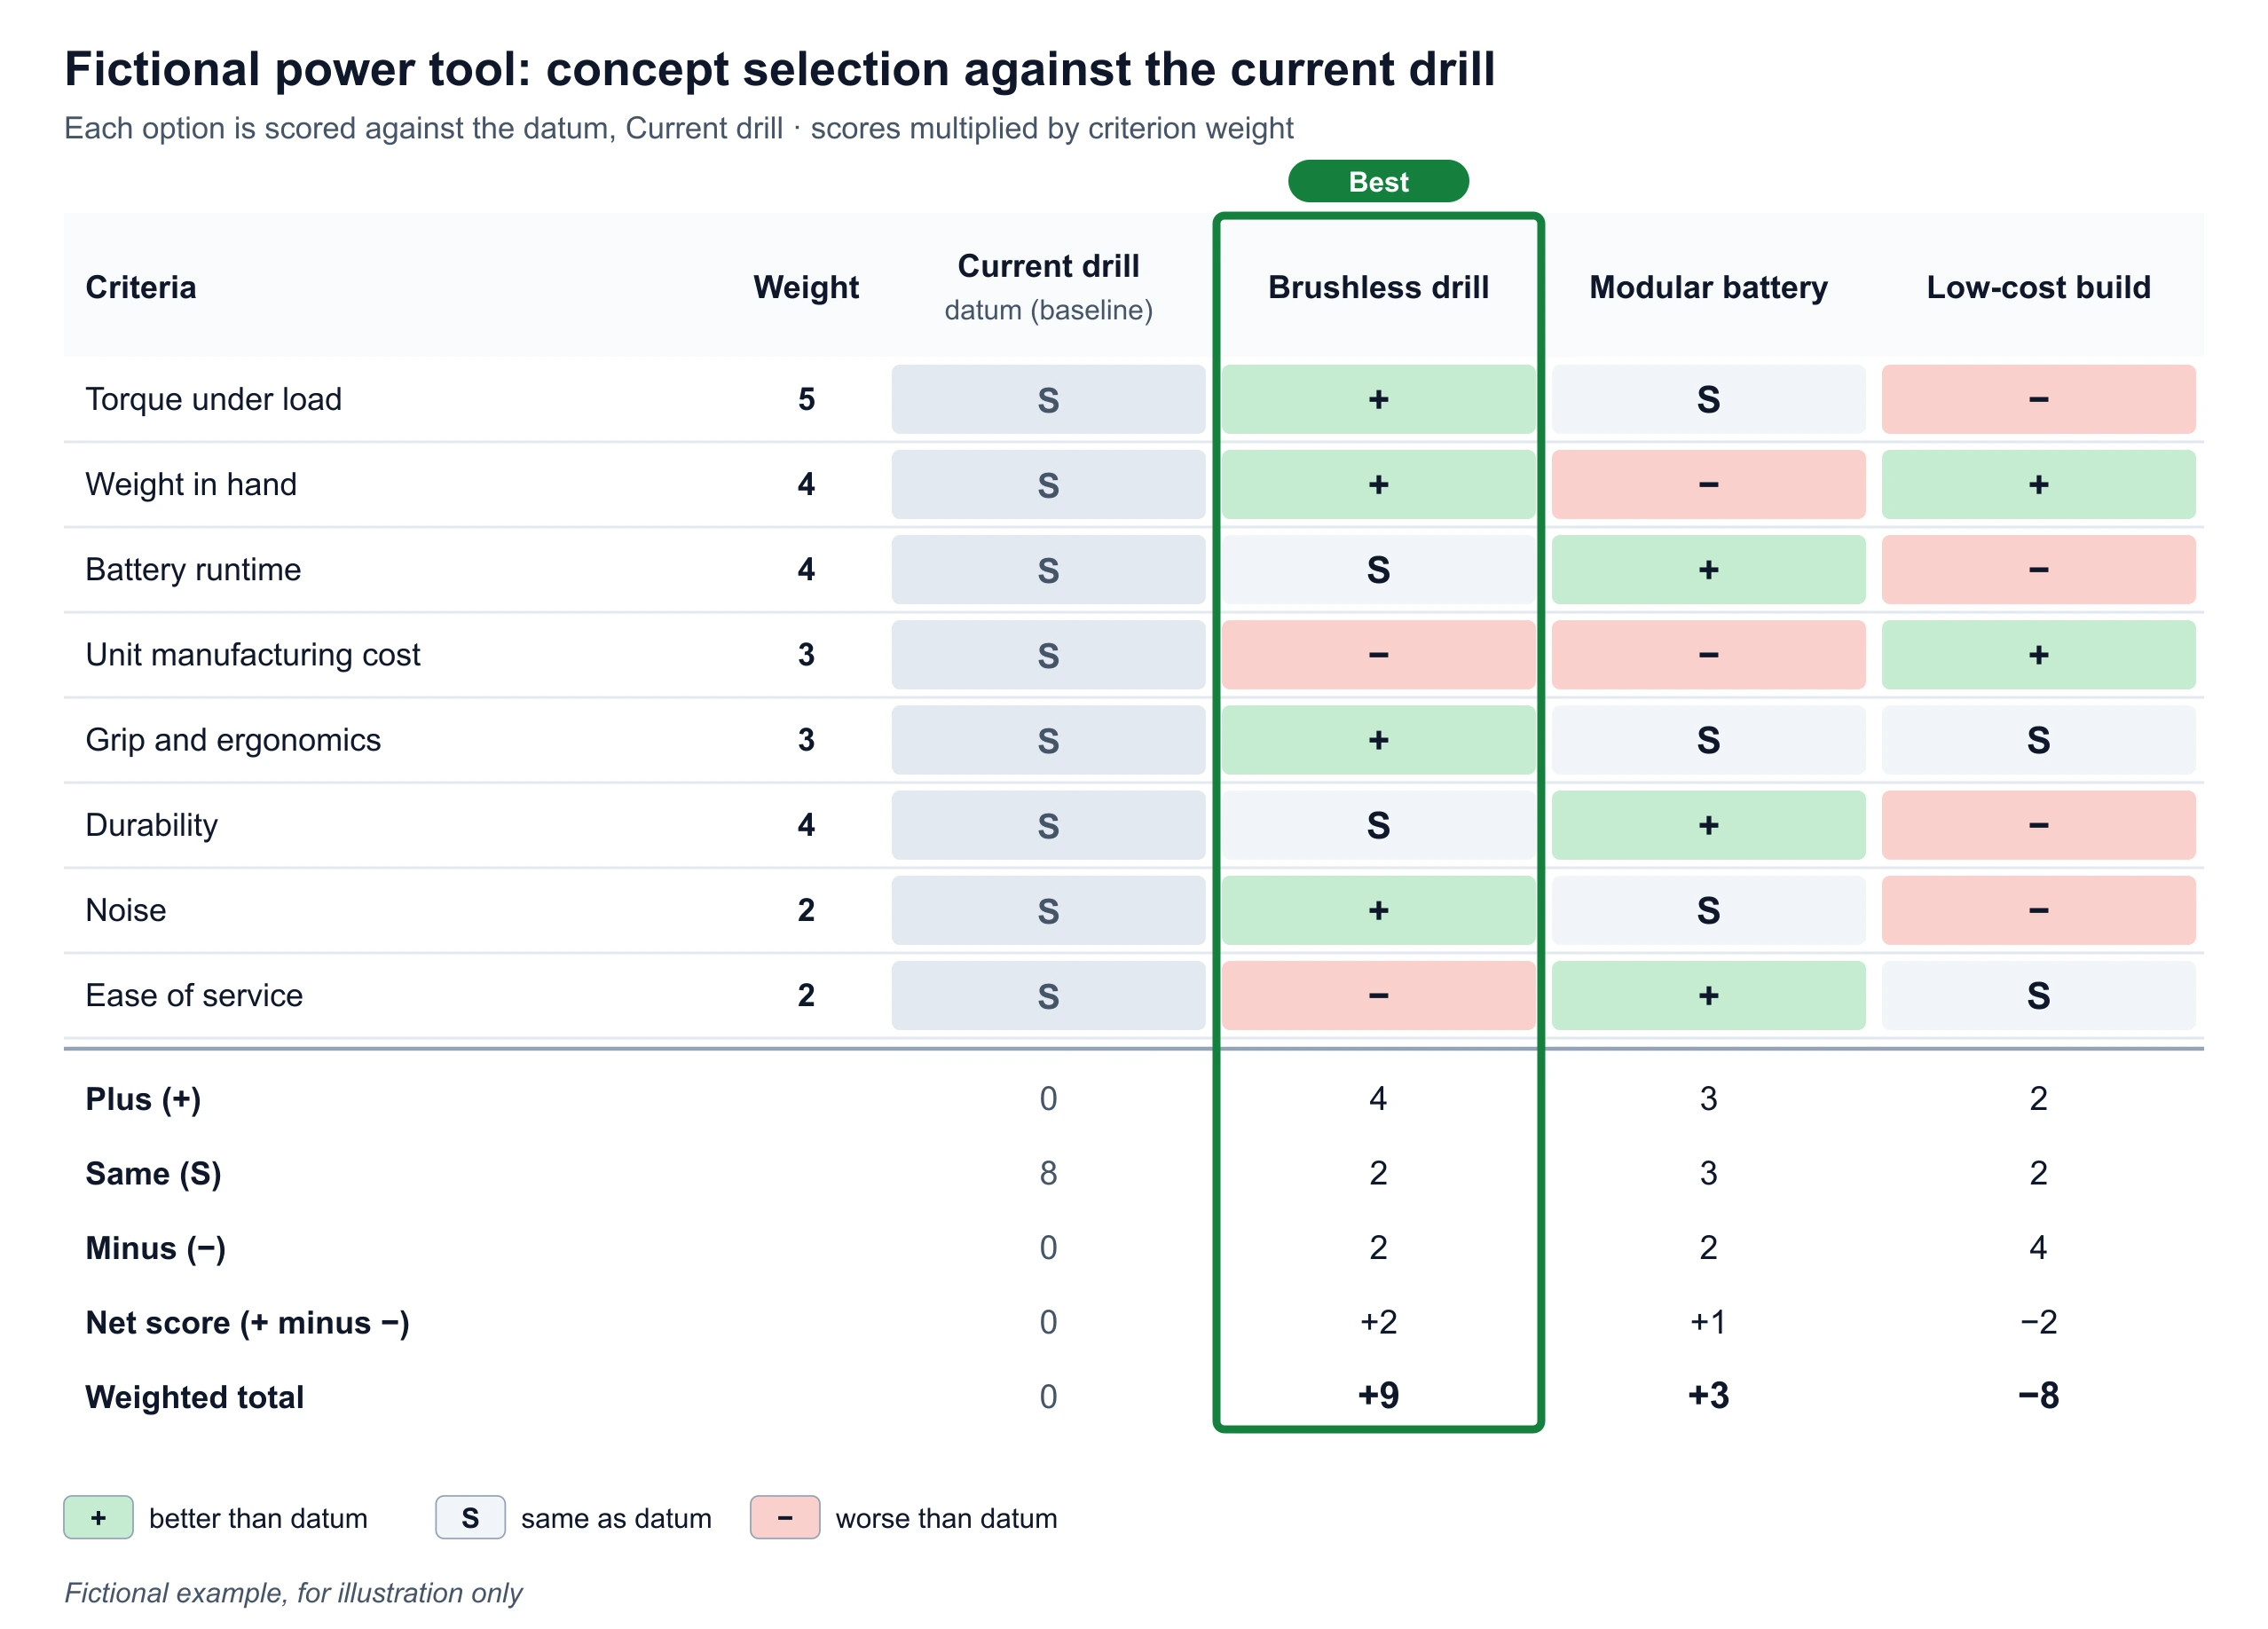 Pugh Matrix GeneratorScore options against a datum with +, S and −, add weights, and export the Pugh matrix with net and weighted totals as SVG, PNG or CSV.
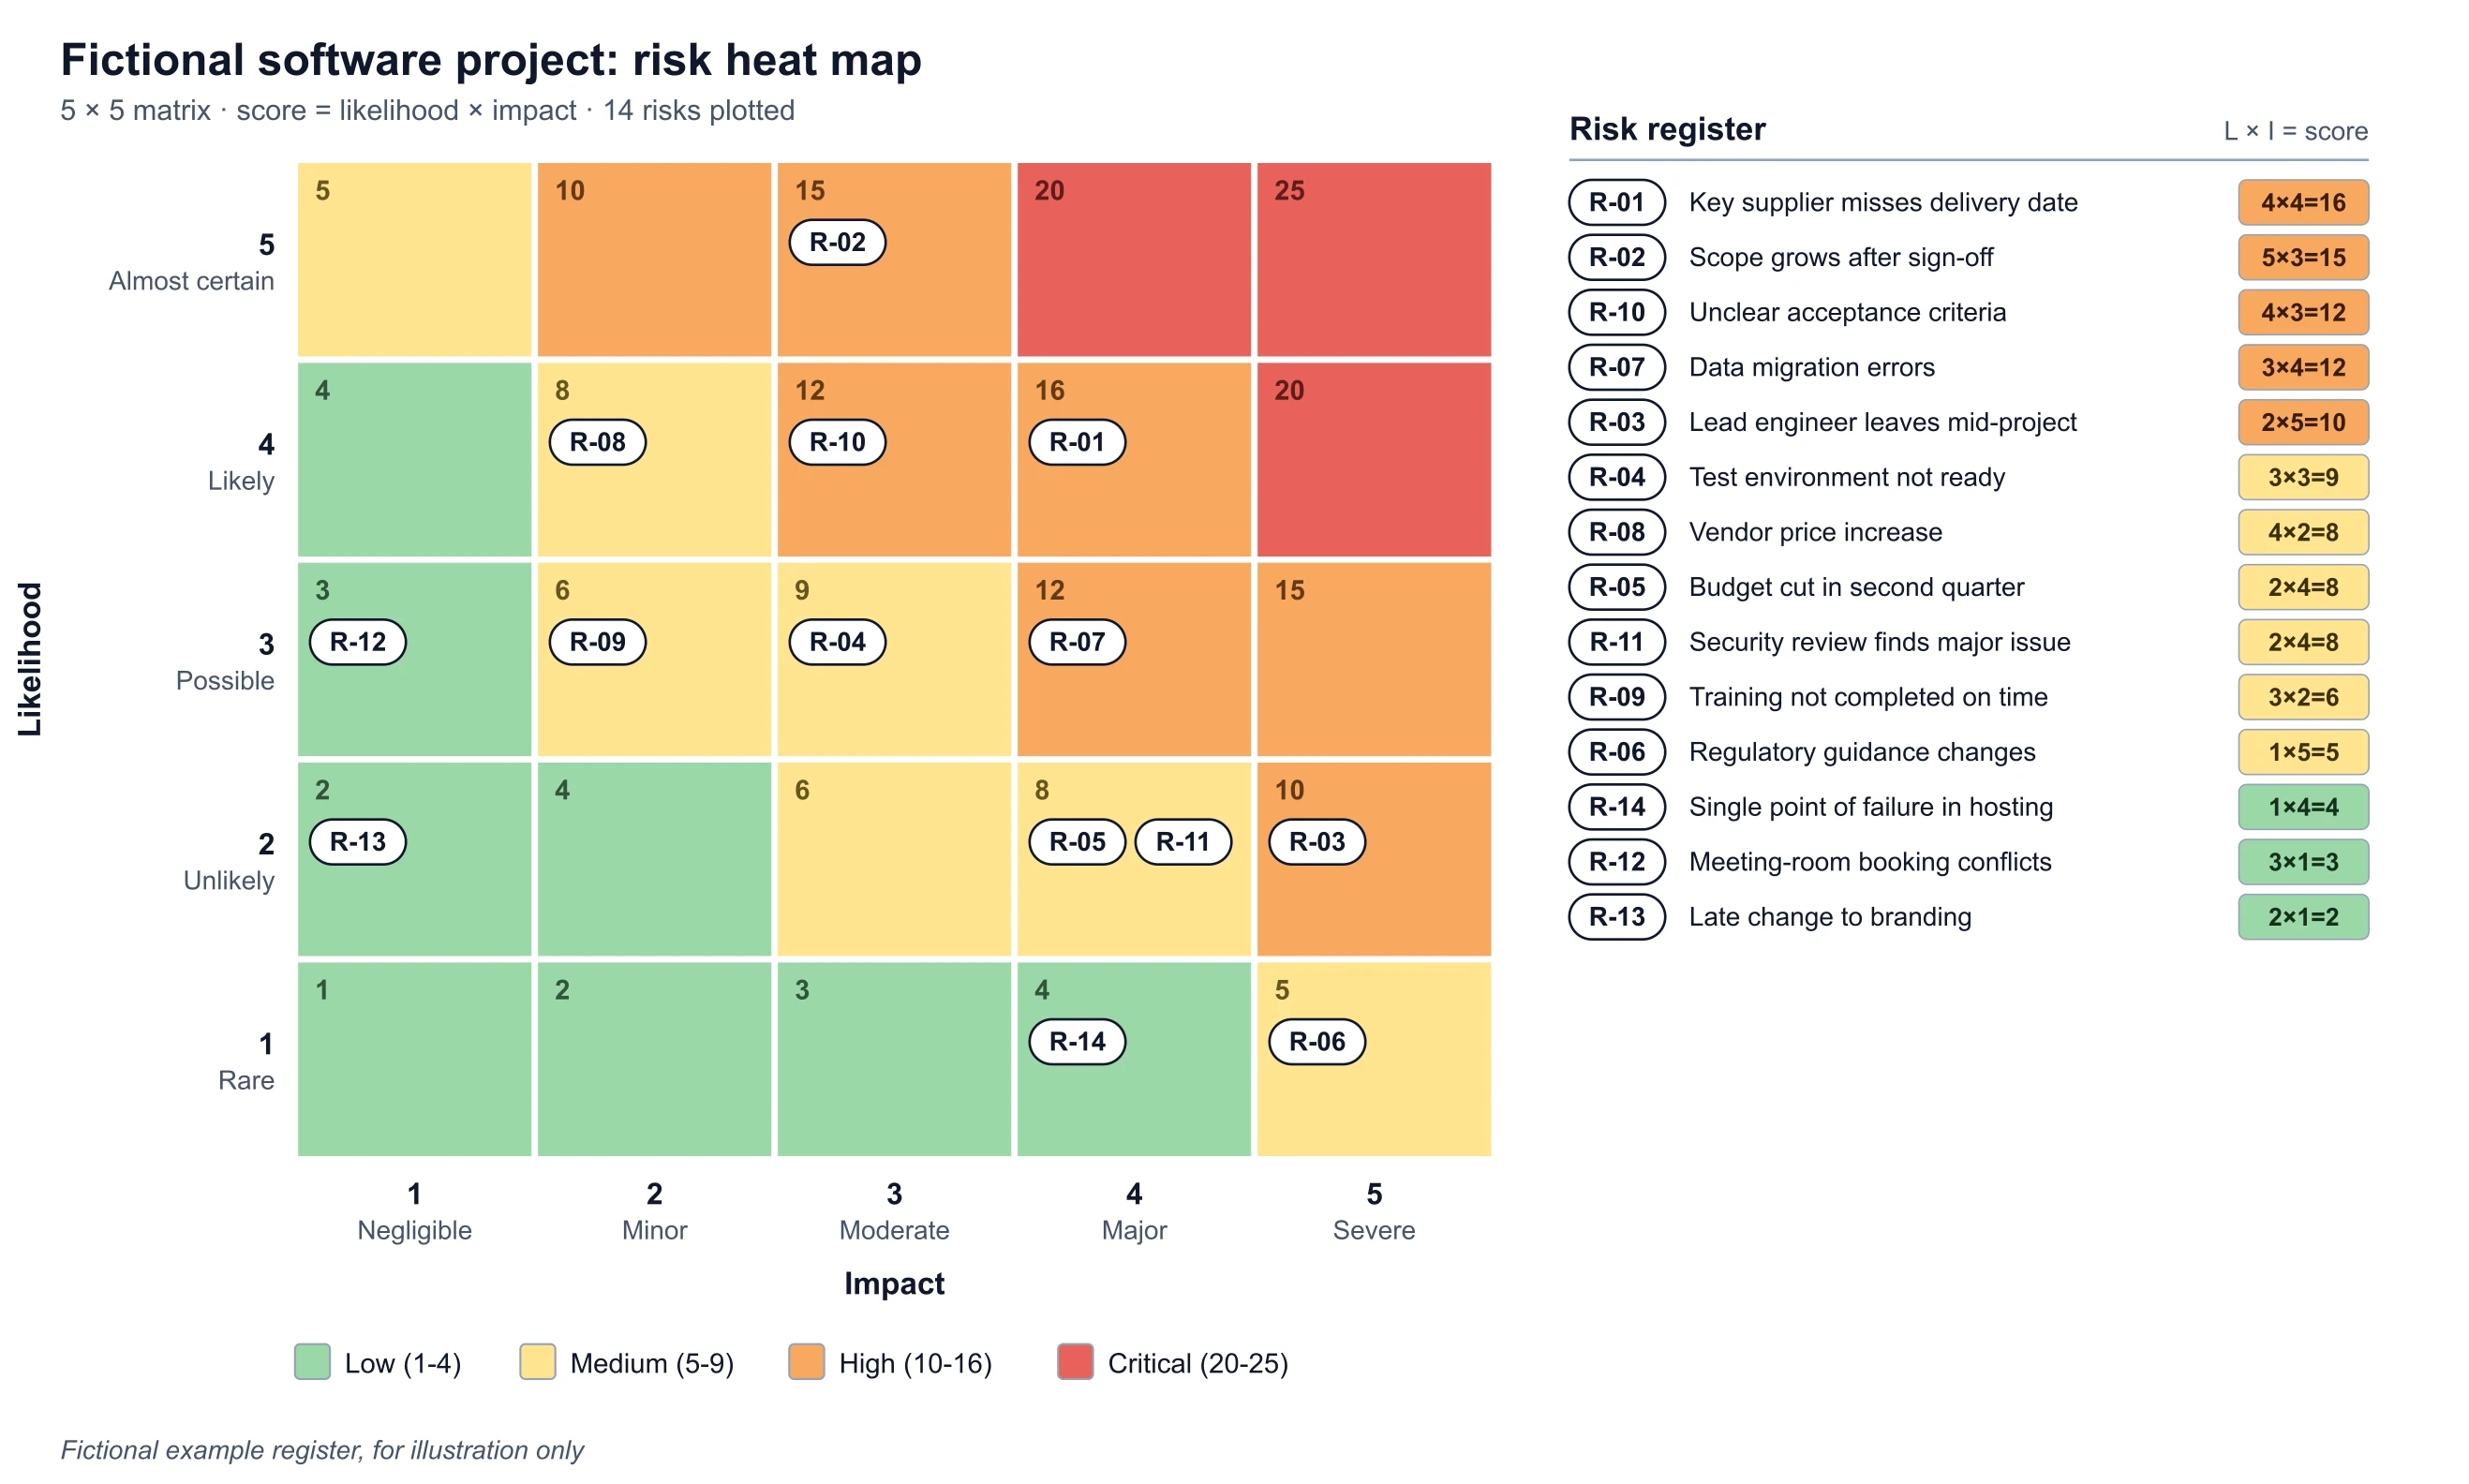 Risk Heat Map MakerPlot risks on a 3x3, 4x4 or 5x5 likelihood and impact matrix, score each risk, and export the heat map as SVG, PNG or CSV.
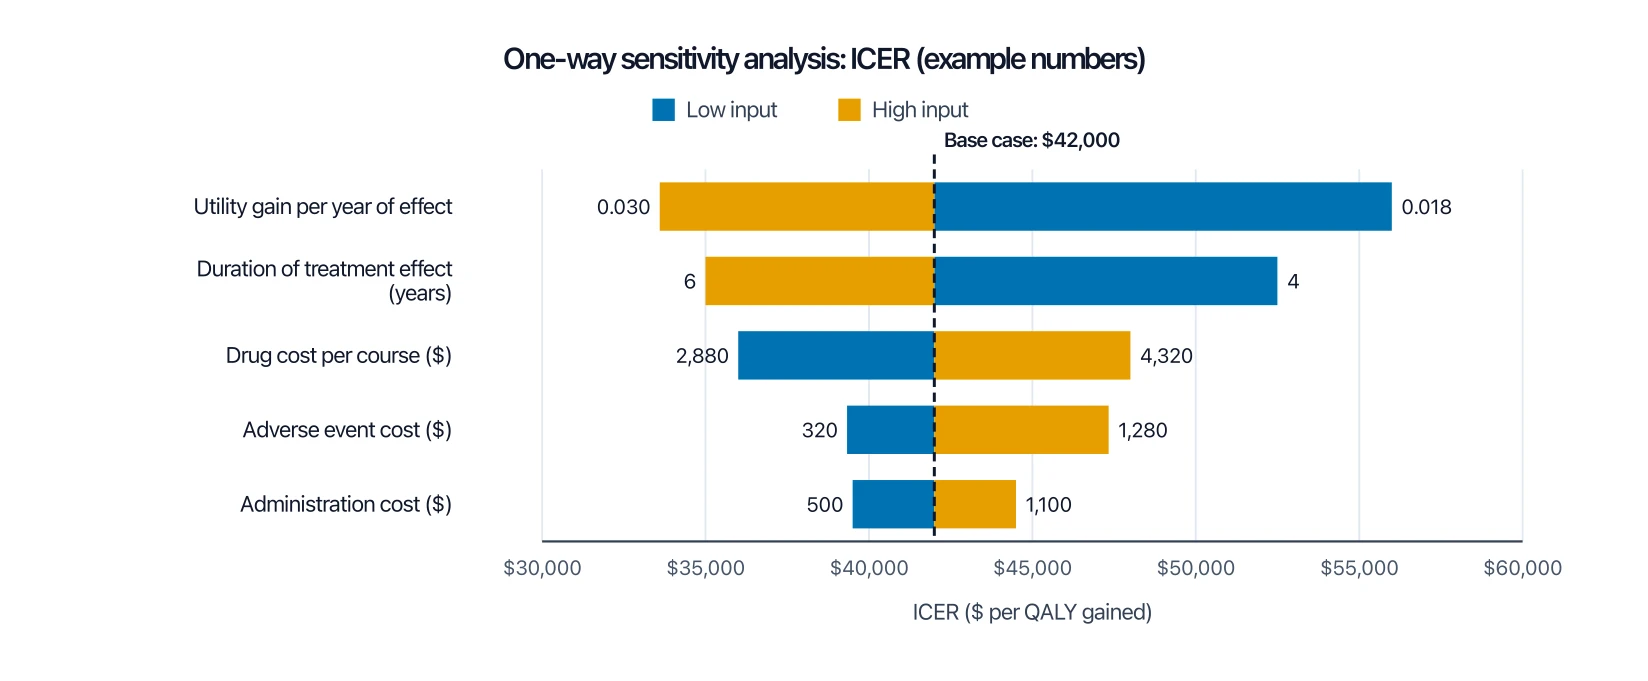 Tornado Diagram GeneratorBuild a tornado diagram for one-way sensitivity analysis: paste low and high results, bars sort by swing, export SVG or PNG.
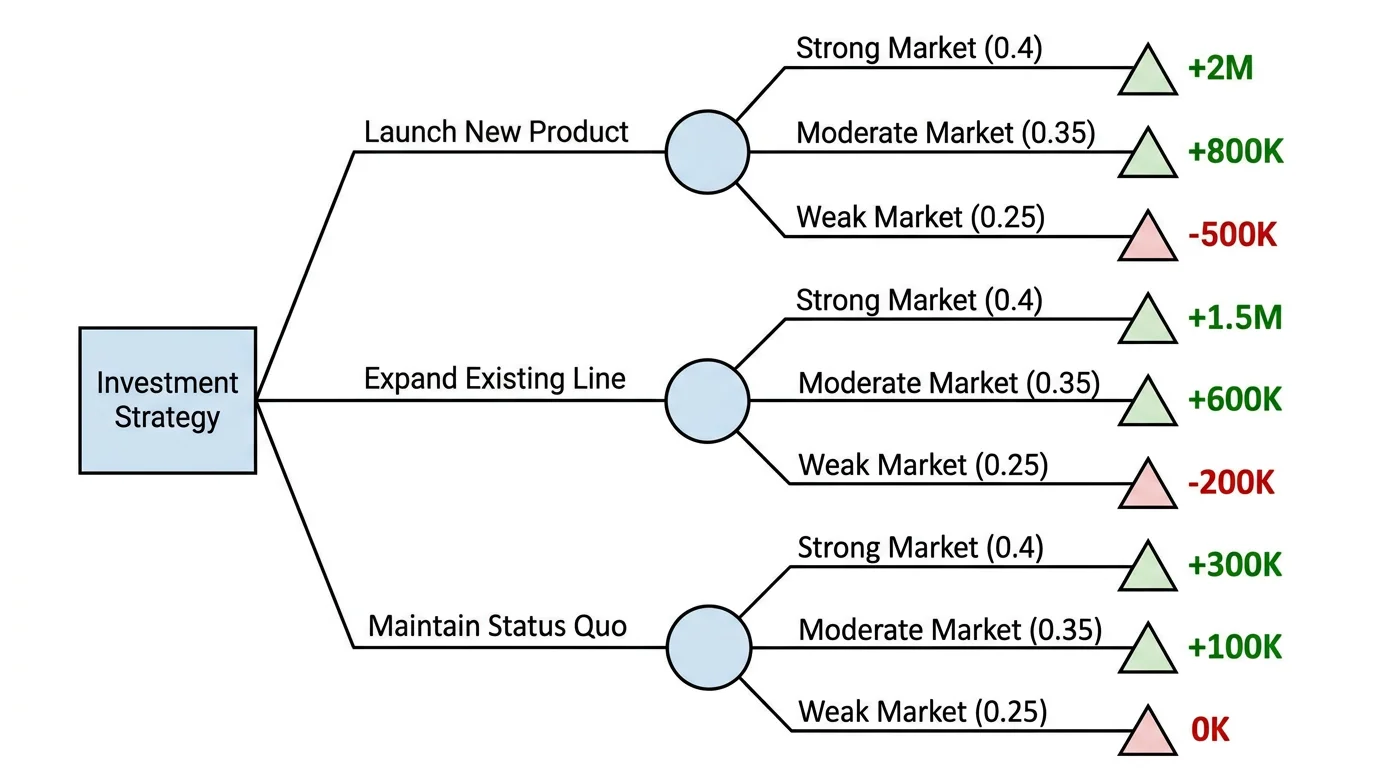 Decision Tree GeneratorCreate decision trees for business analysis, machine learning, and problem solving with branching logic.
Growth and economics
Strategy loops and economic models.
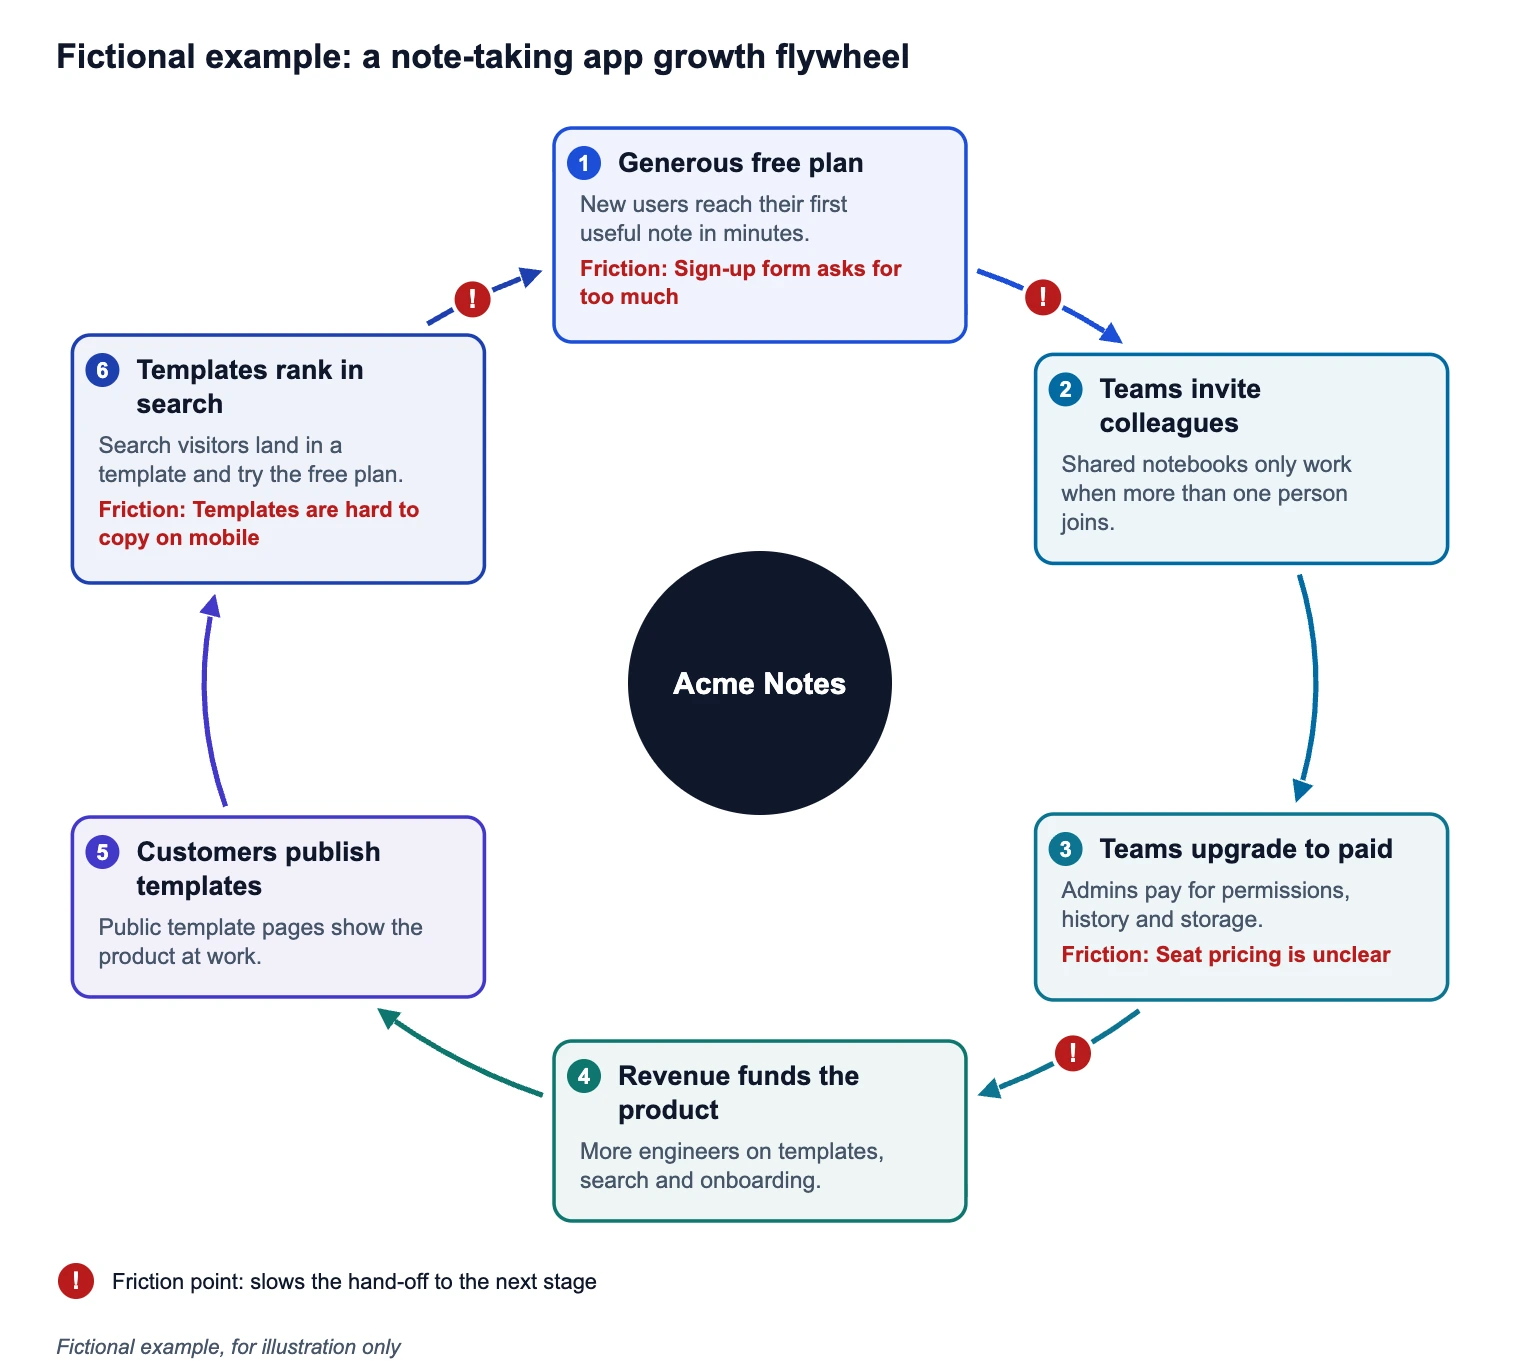 Flywheel Diagram MakerList 3 to 8 stages that feed each other, mark friction points, and export the flywheel diagram as SVG, PNG, CSV or text.
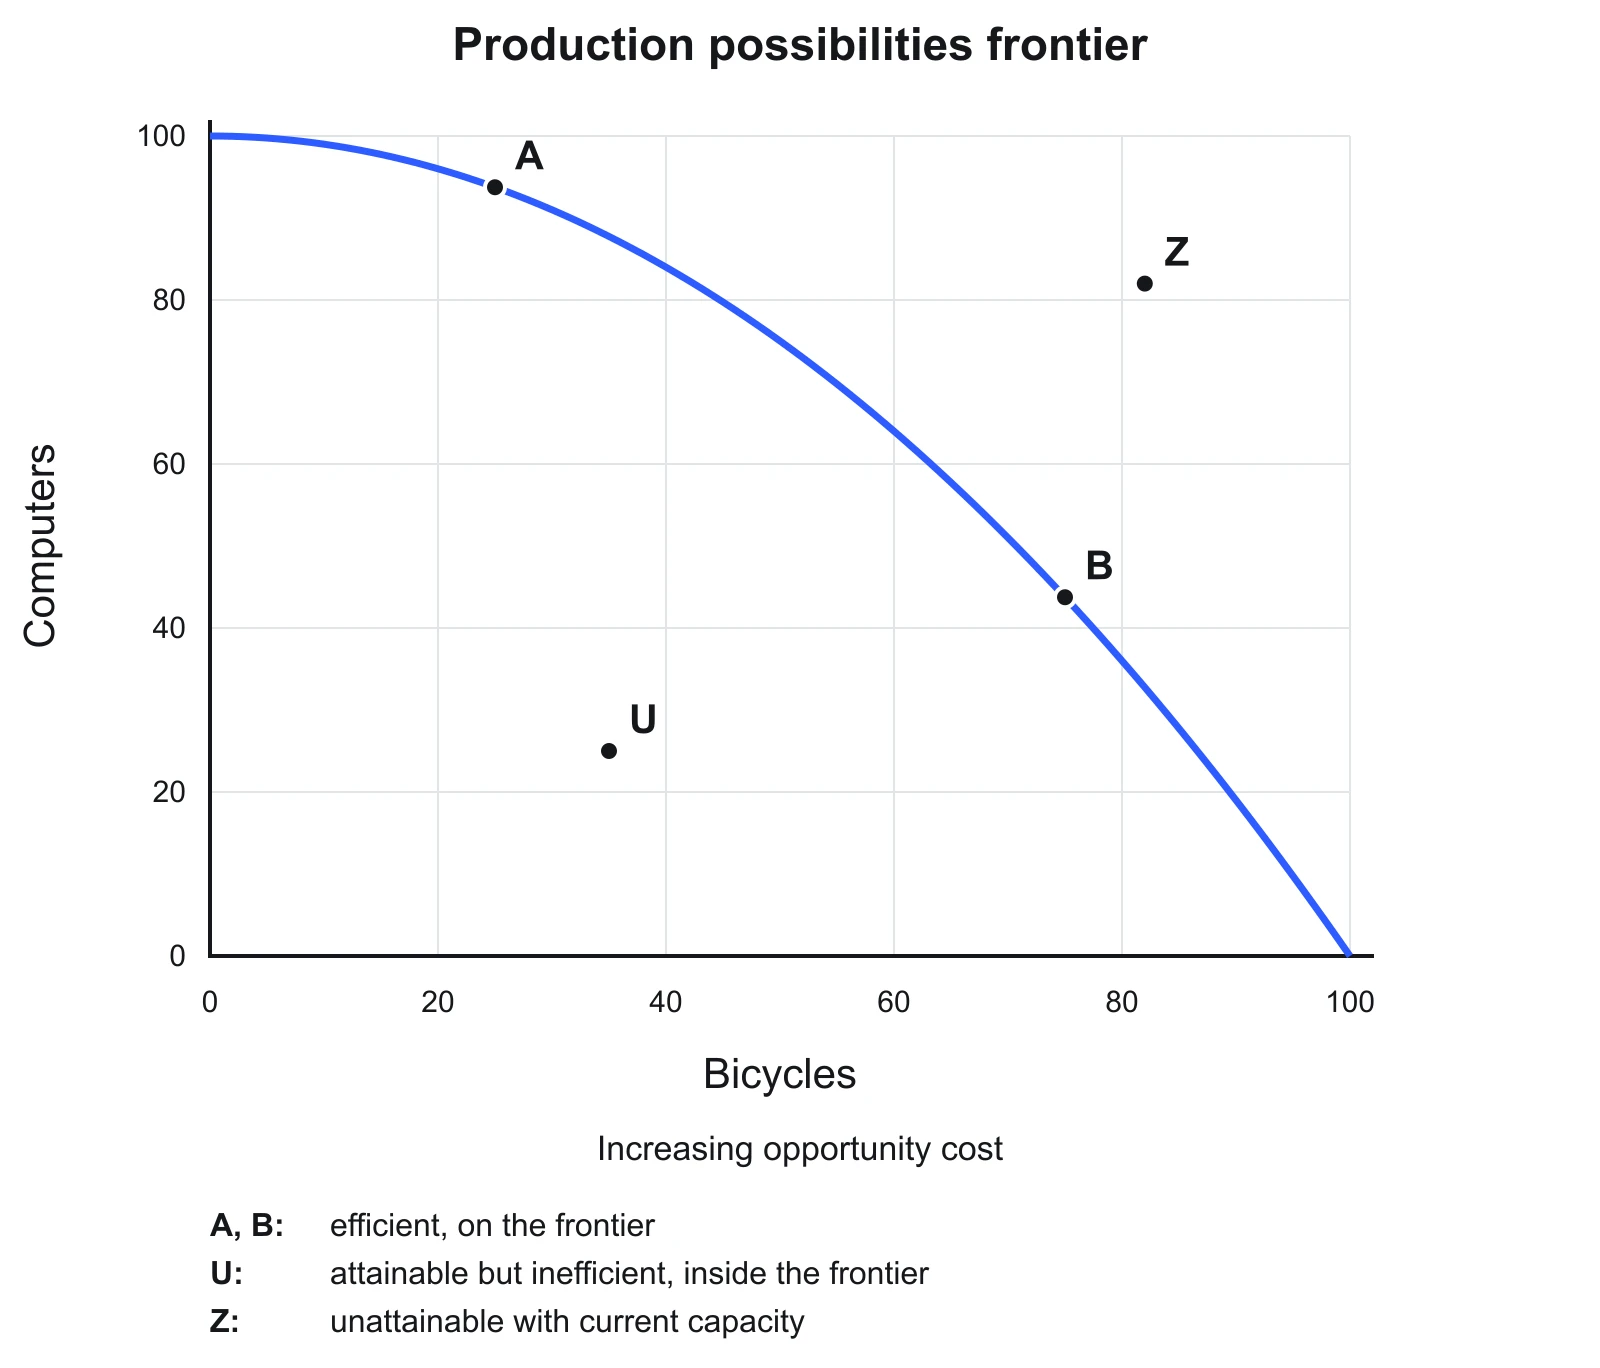 Production Possibilities Curve GeneratorDraw a PPC or PPF with increasing or constant opportunity cost, capacity shifts, and free SVG or PNG export.
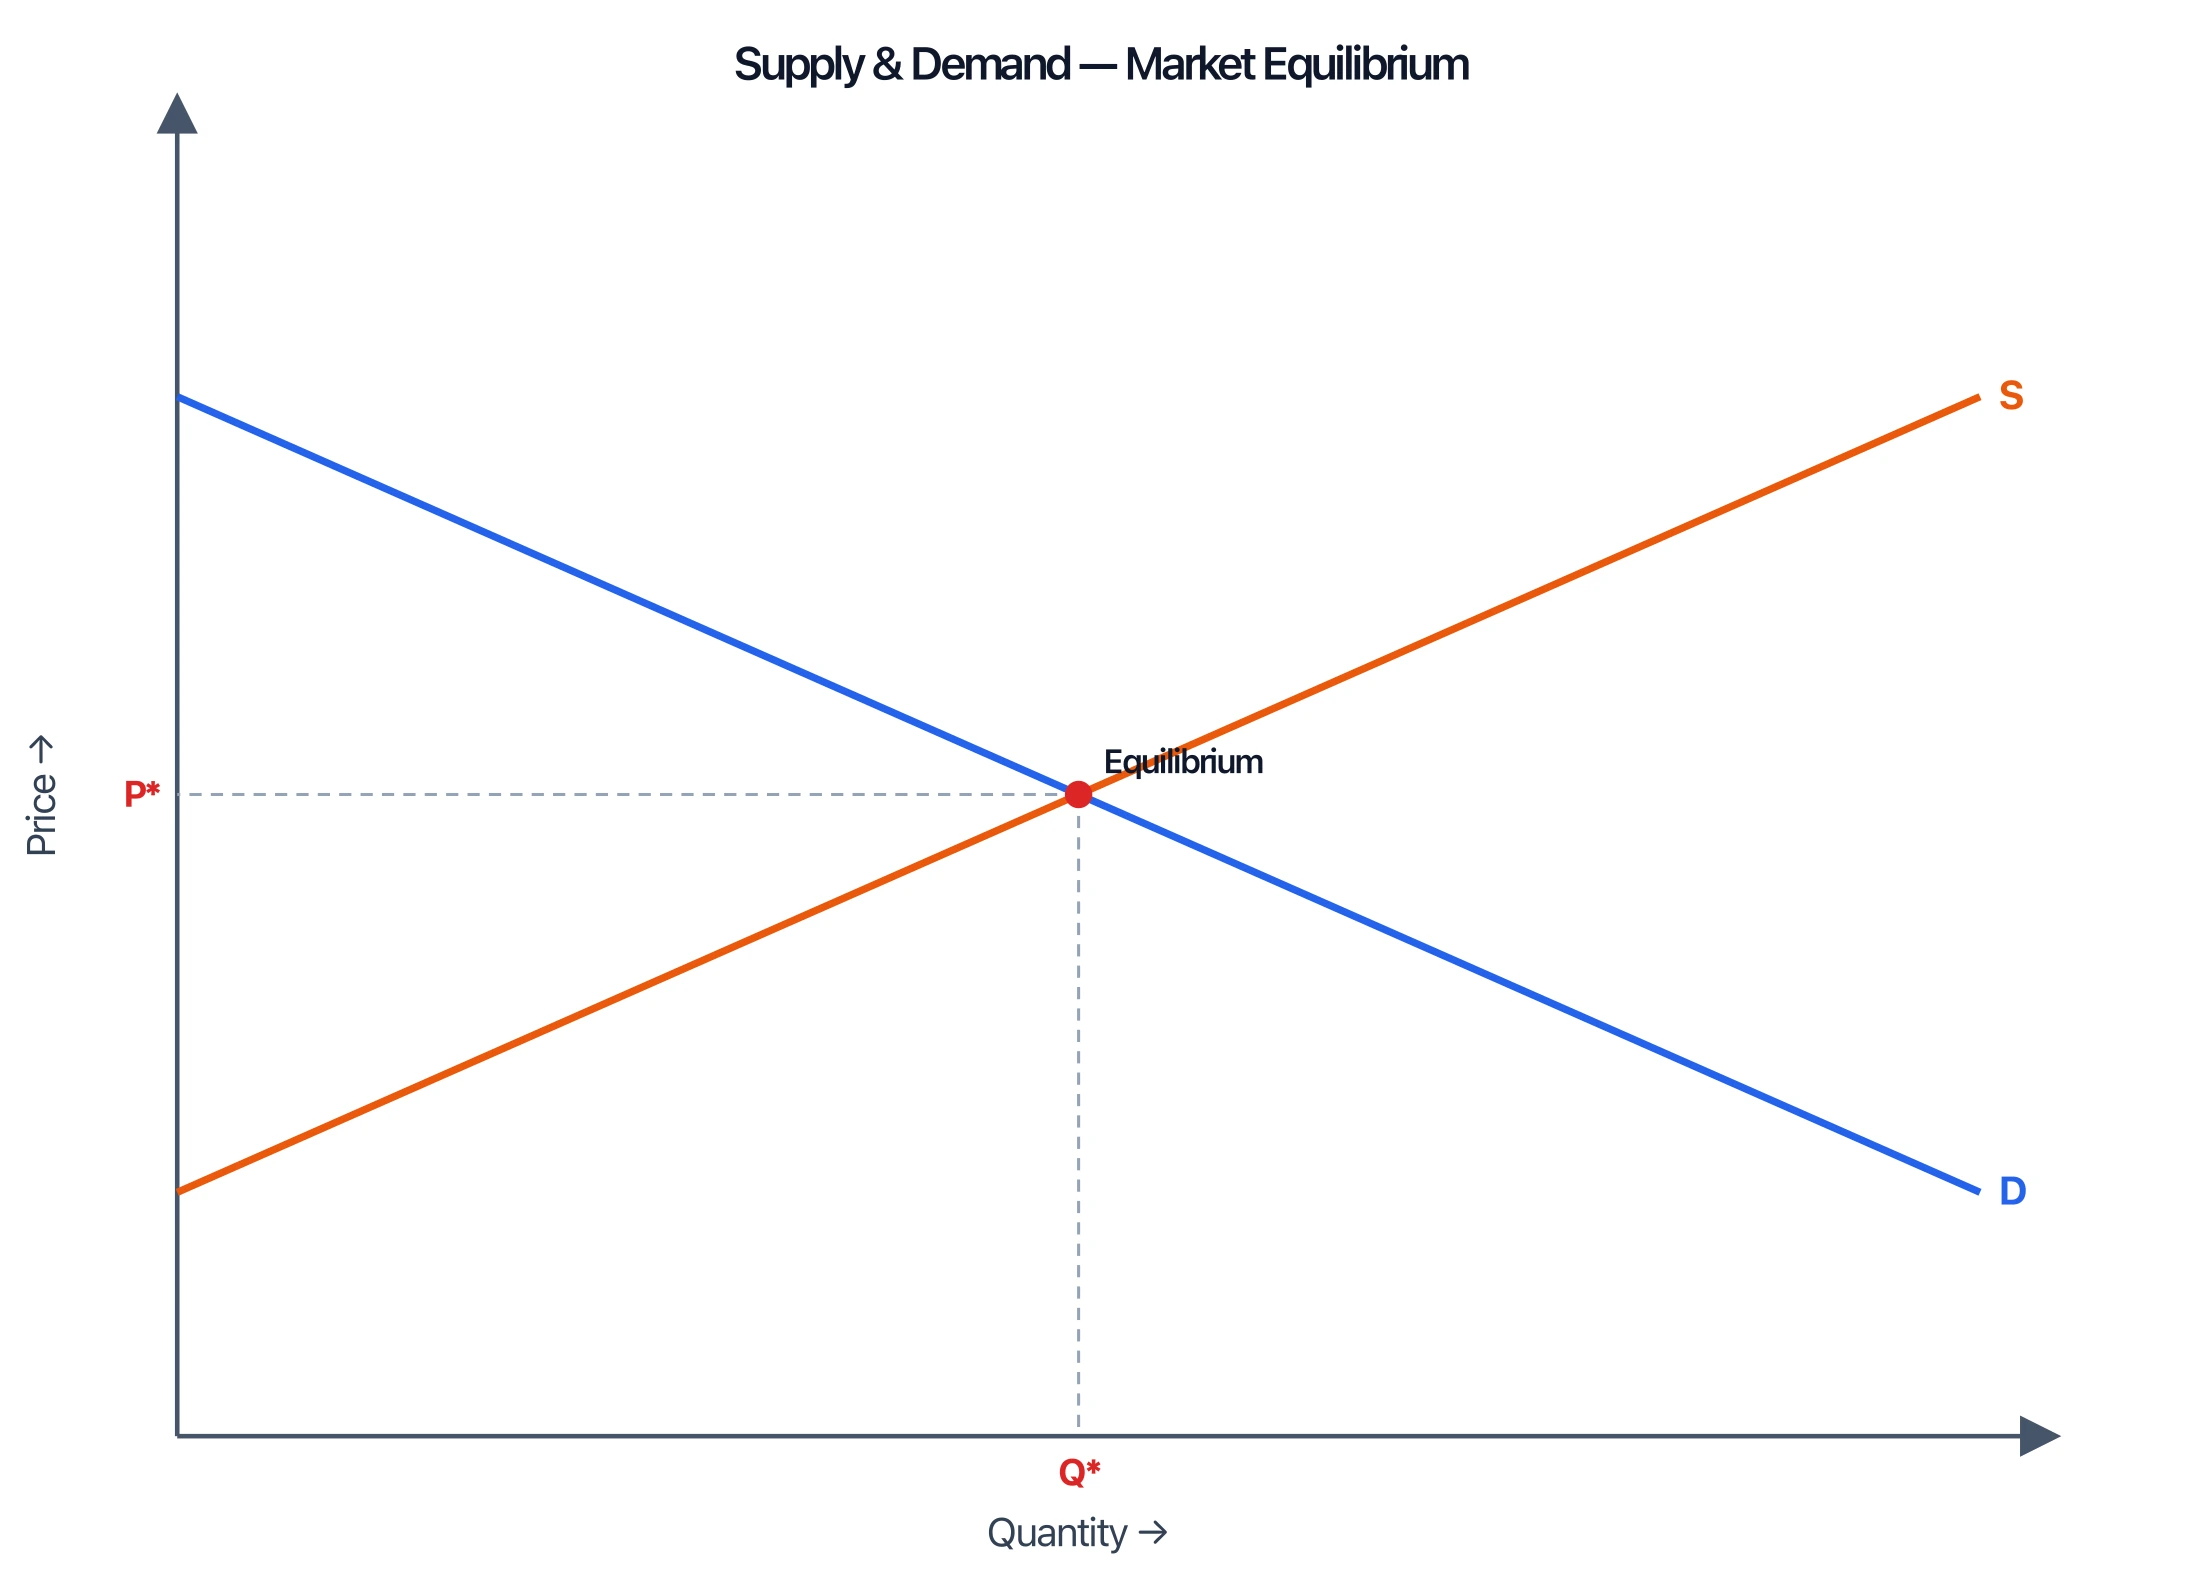 Supply and Demand Graph MakerPlot demand and supply curves, find the market equilibrium (P* and Q*), shift curves to show changes, and add a price ceiling or floor with the shortage or surplus.
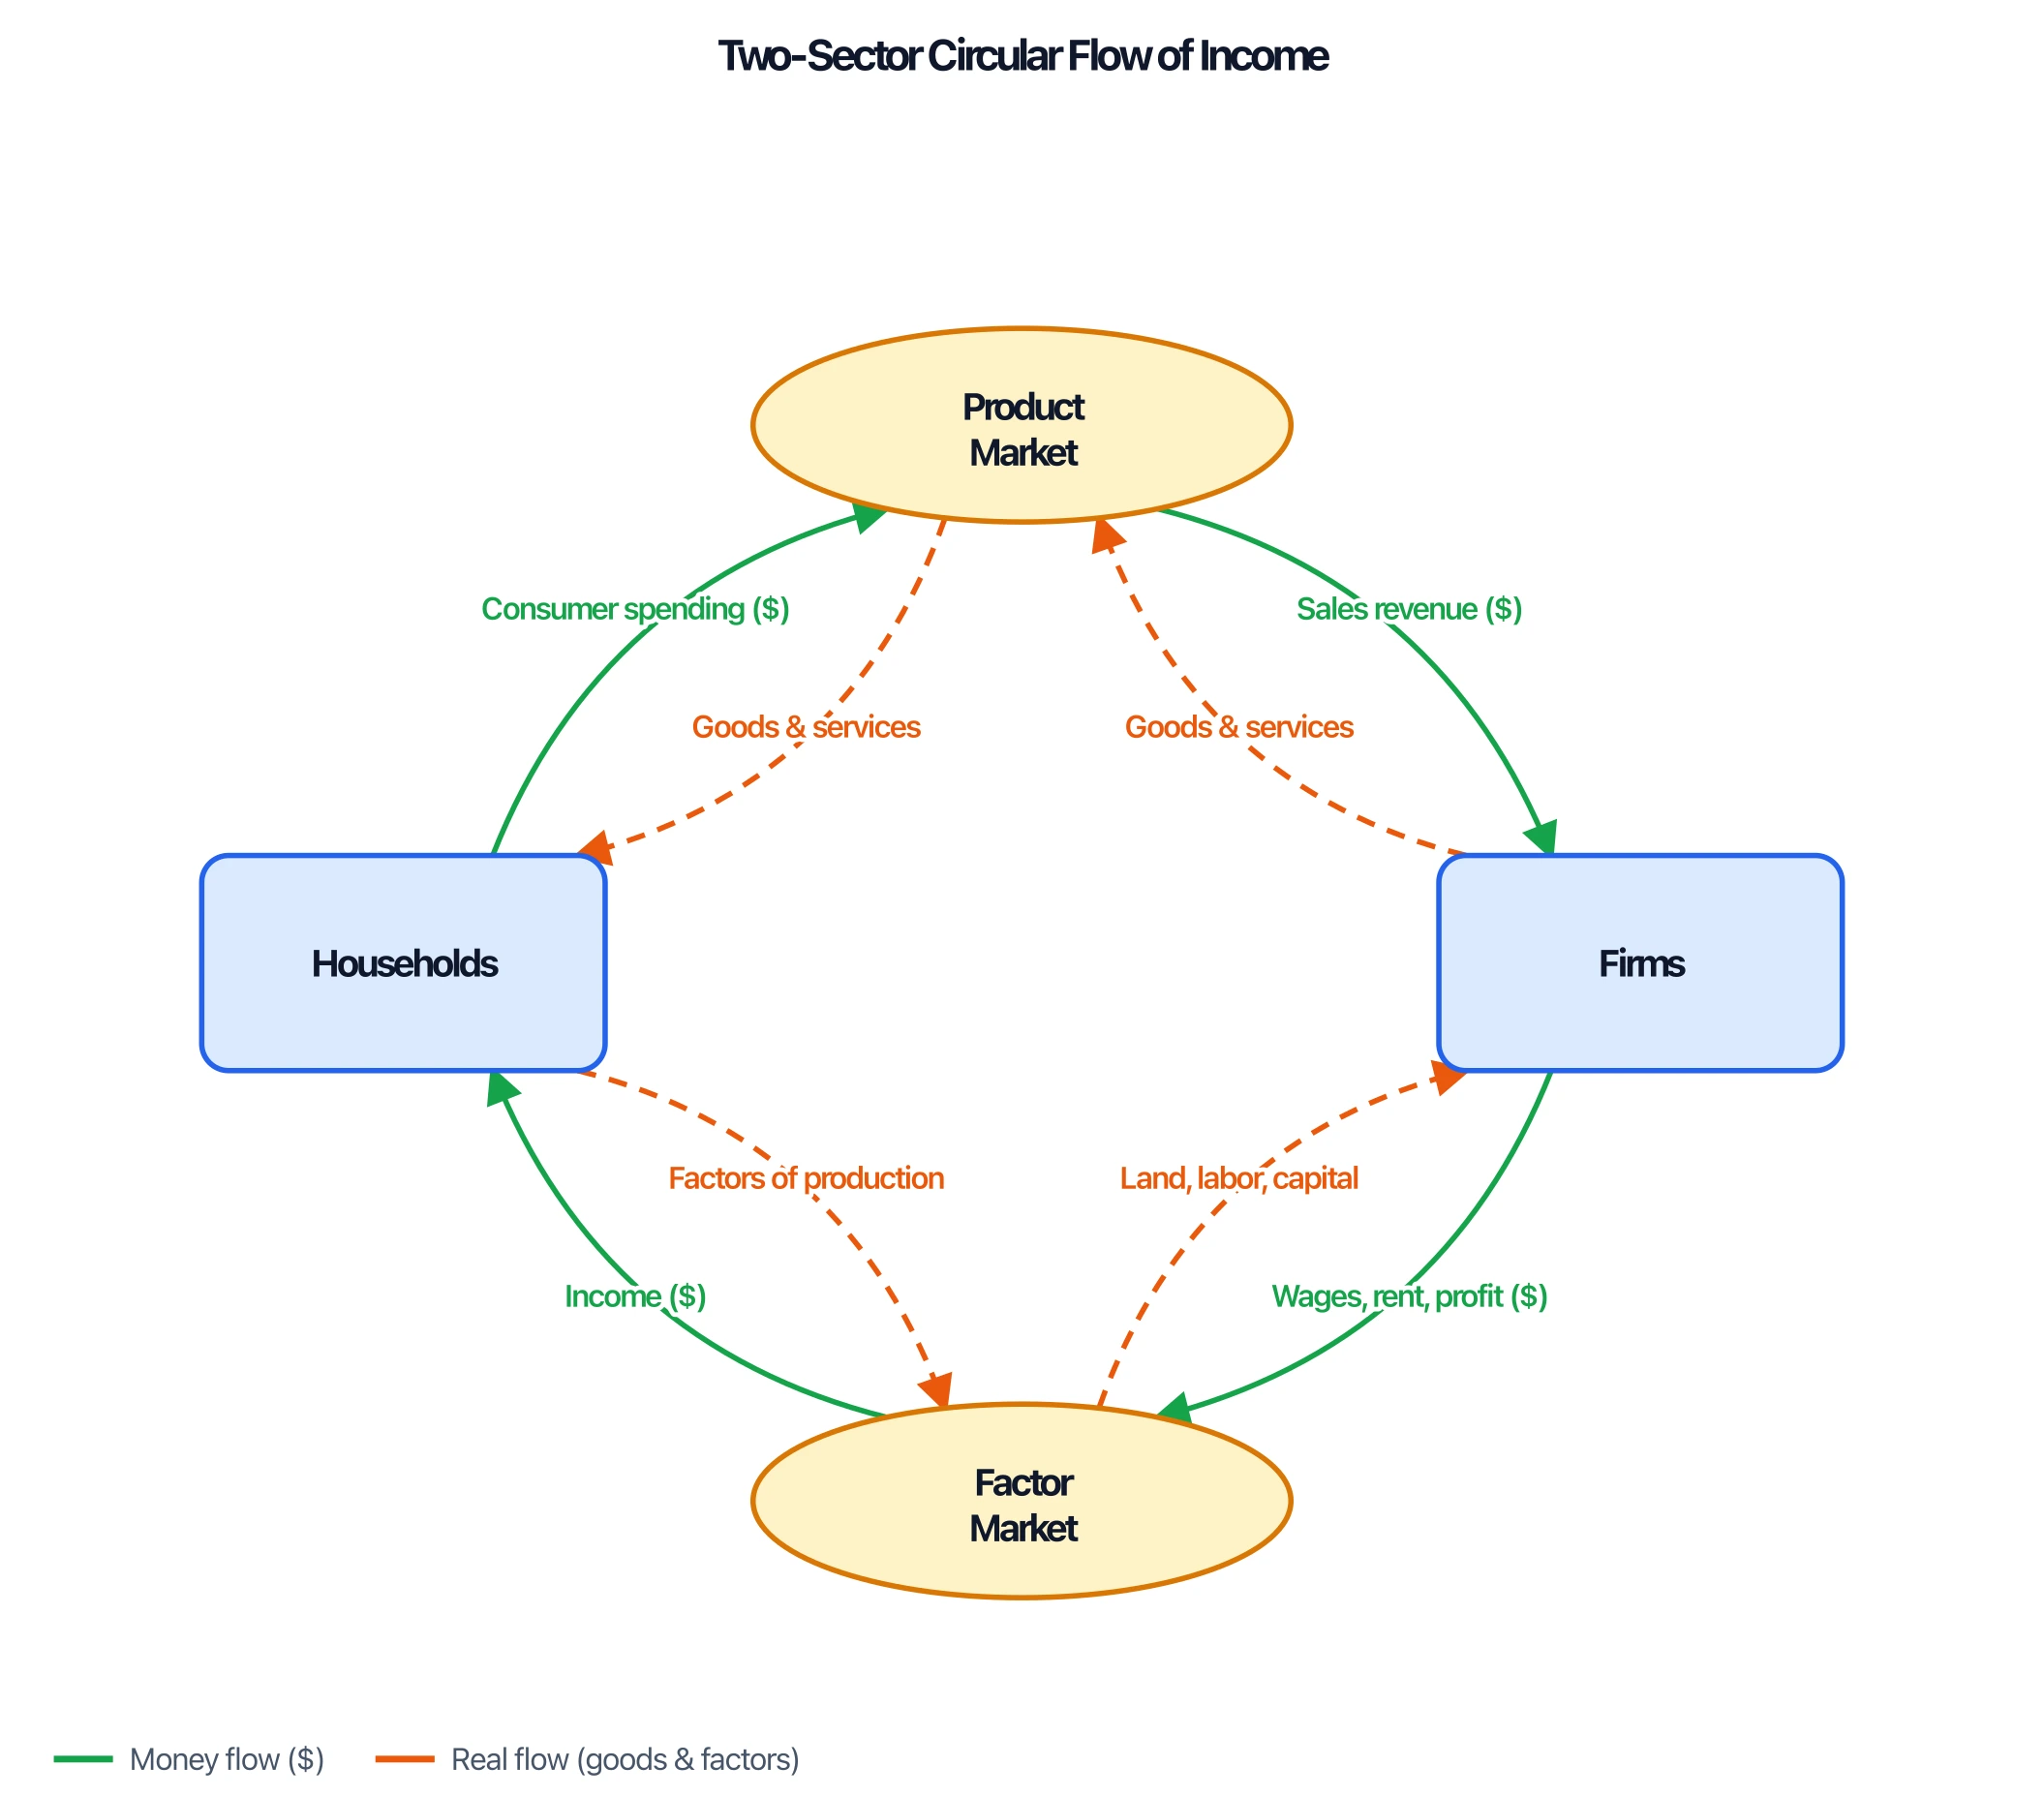 Circular Flow Diagram GeneratorMake the circular flow of income diagram — 2-, 3-, or 4-sector models with money and real flows in the correct directions, editable labels, and free SVG/PNG export.
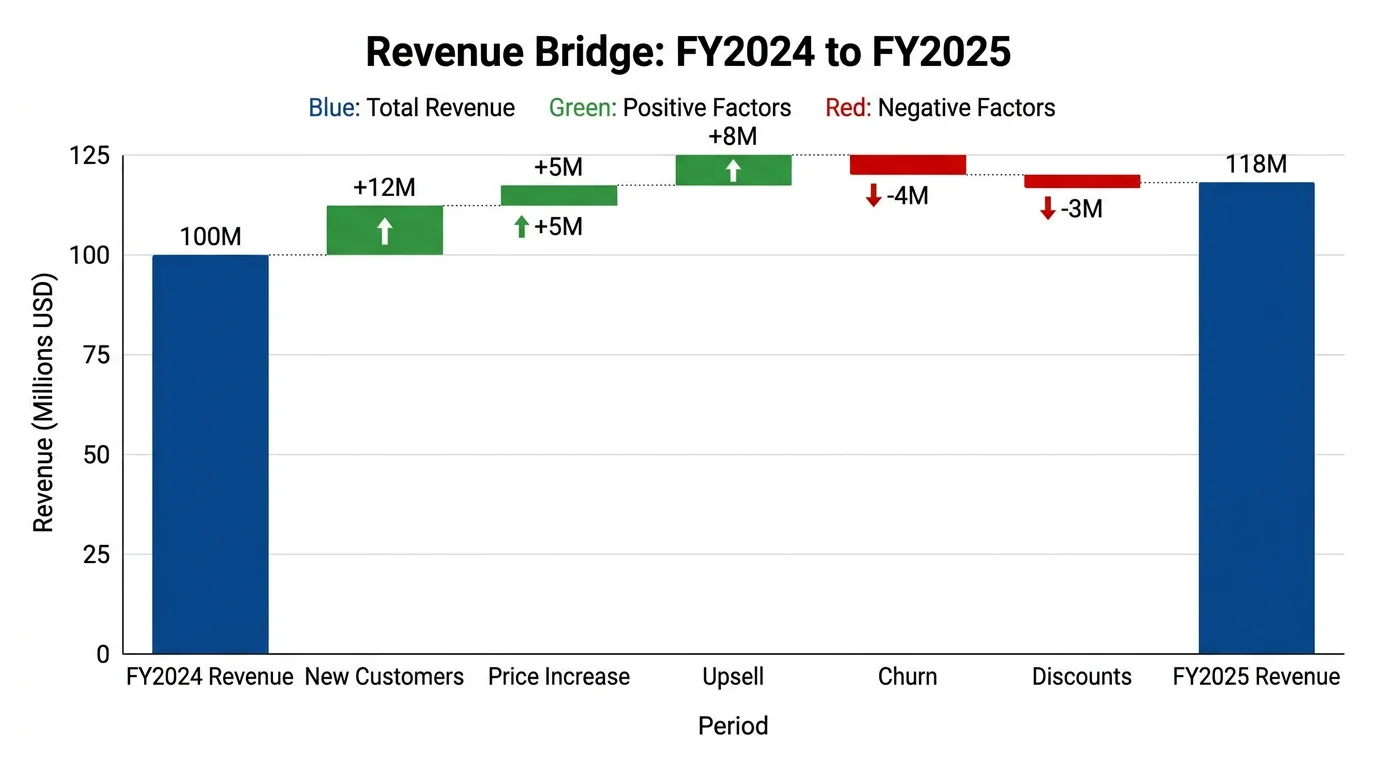 Waterfall Chart GeneratorCreate waterfall charts (bridge charts) for financial analysis showing incremental changes and running totals.
Patents and intellectual property
Drawings and charts for filings and freedom to operate.
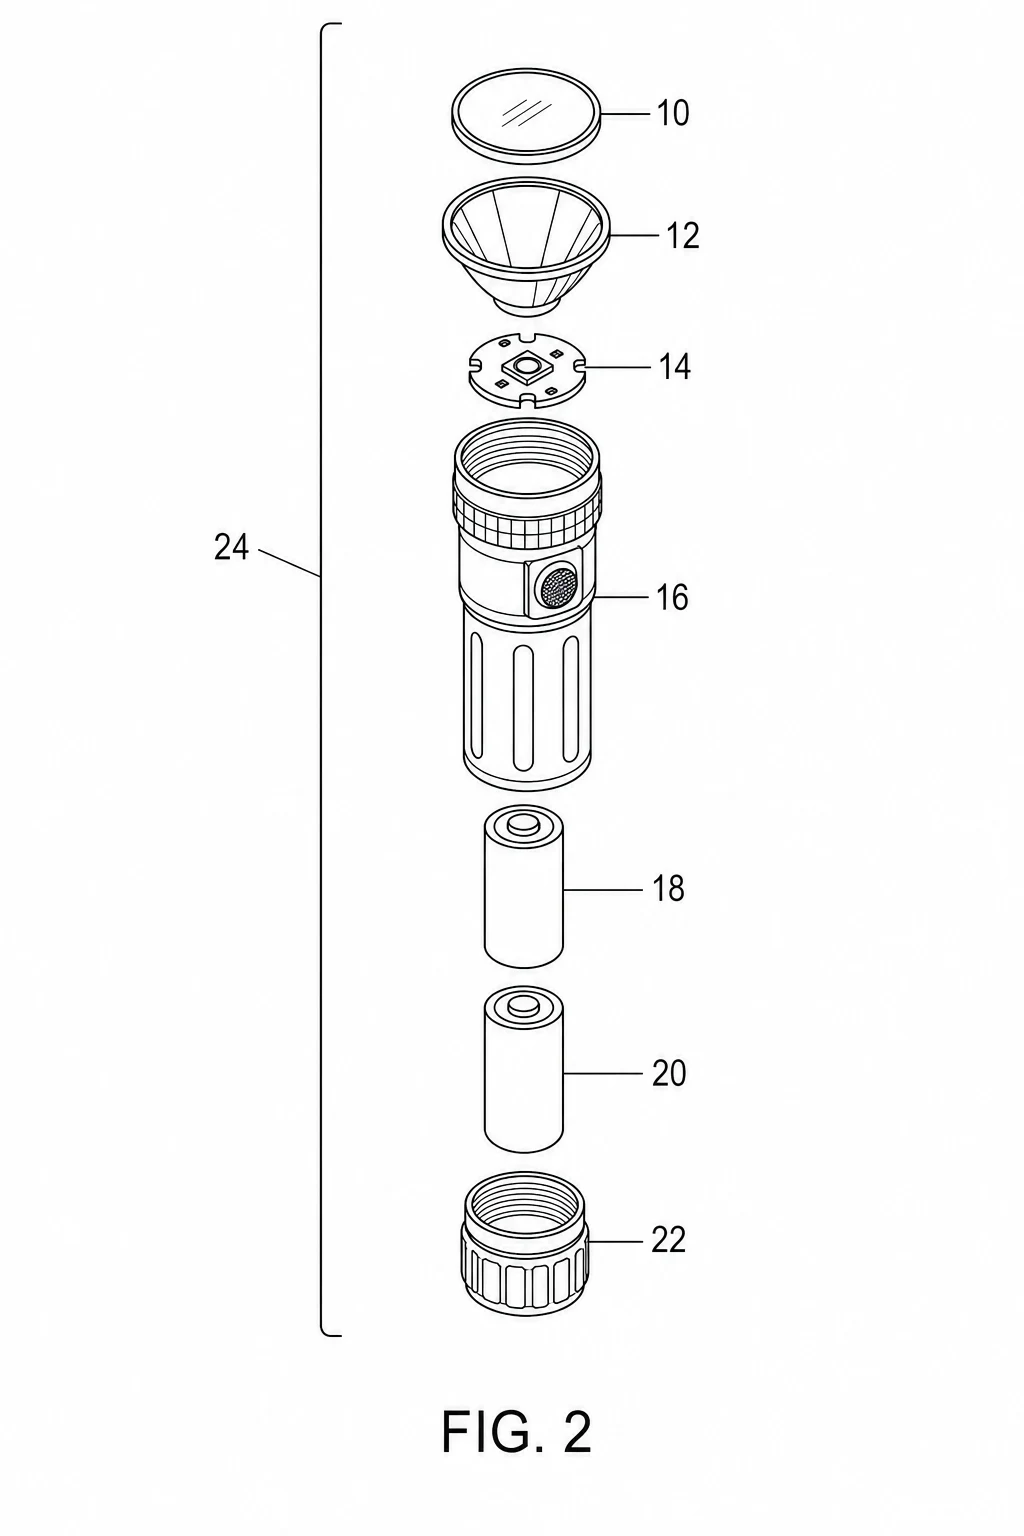
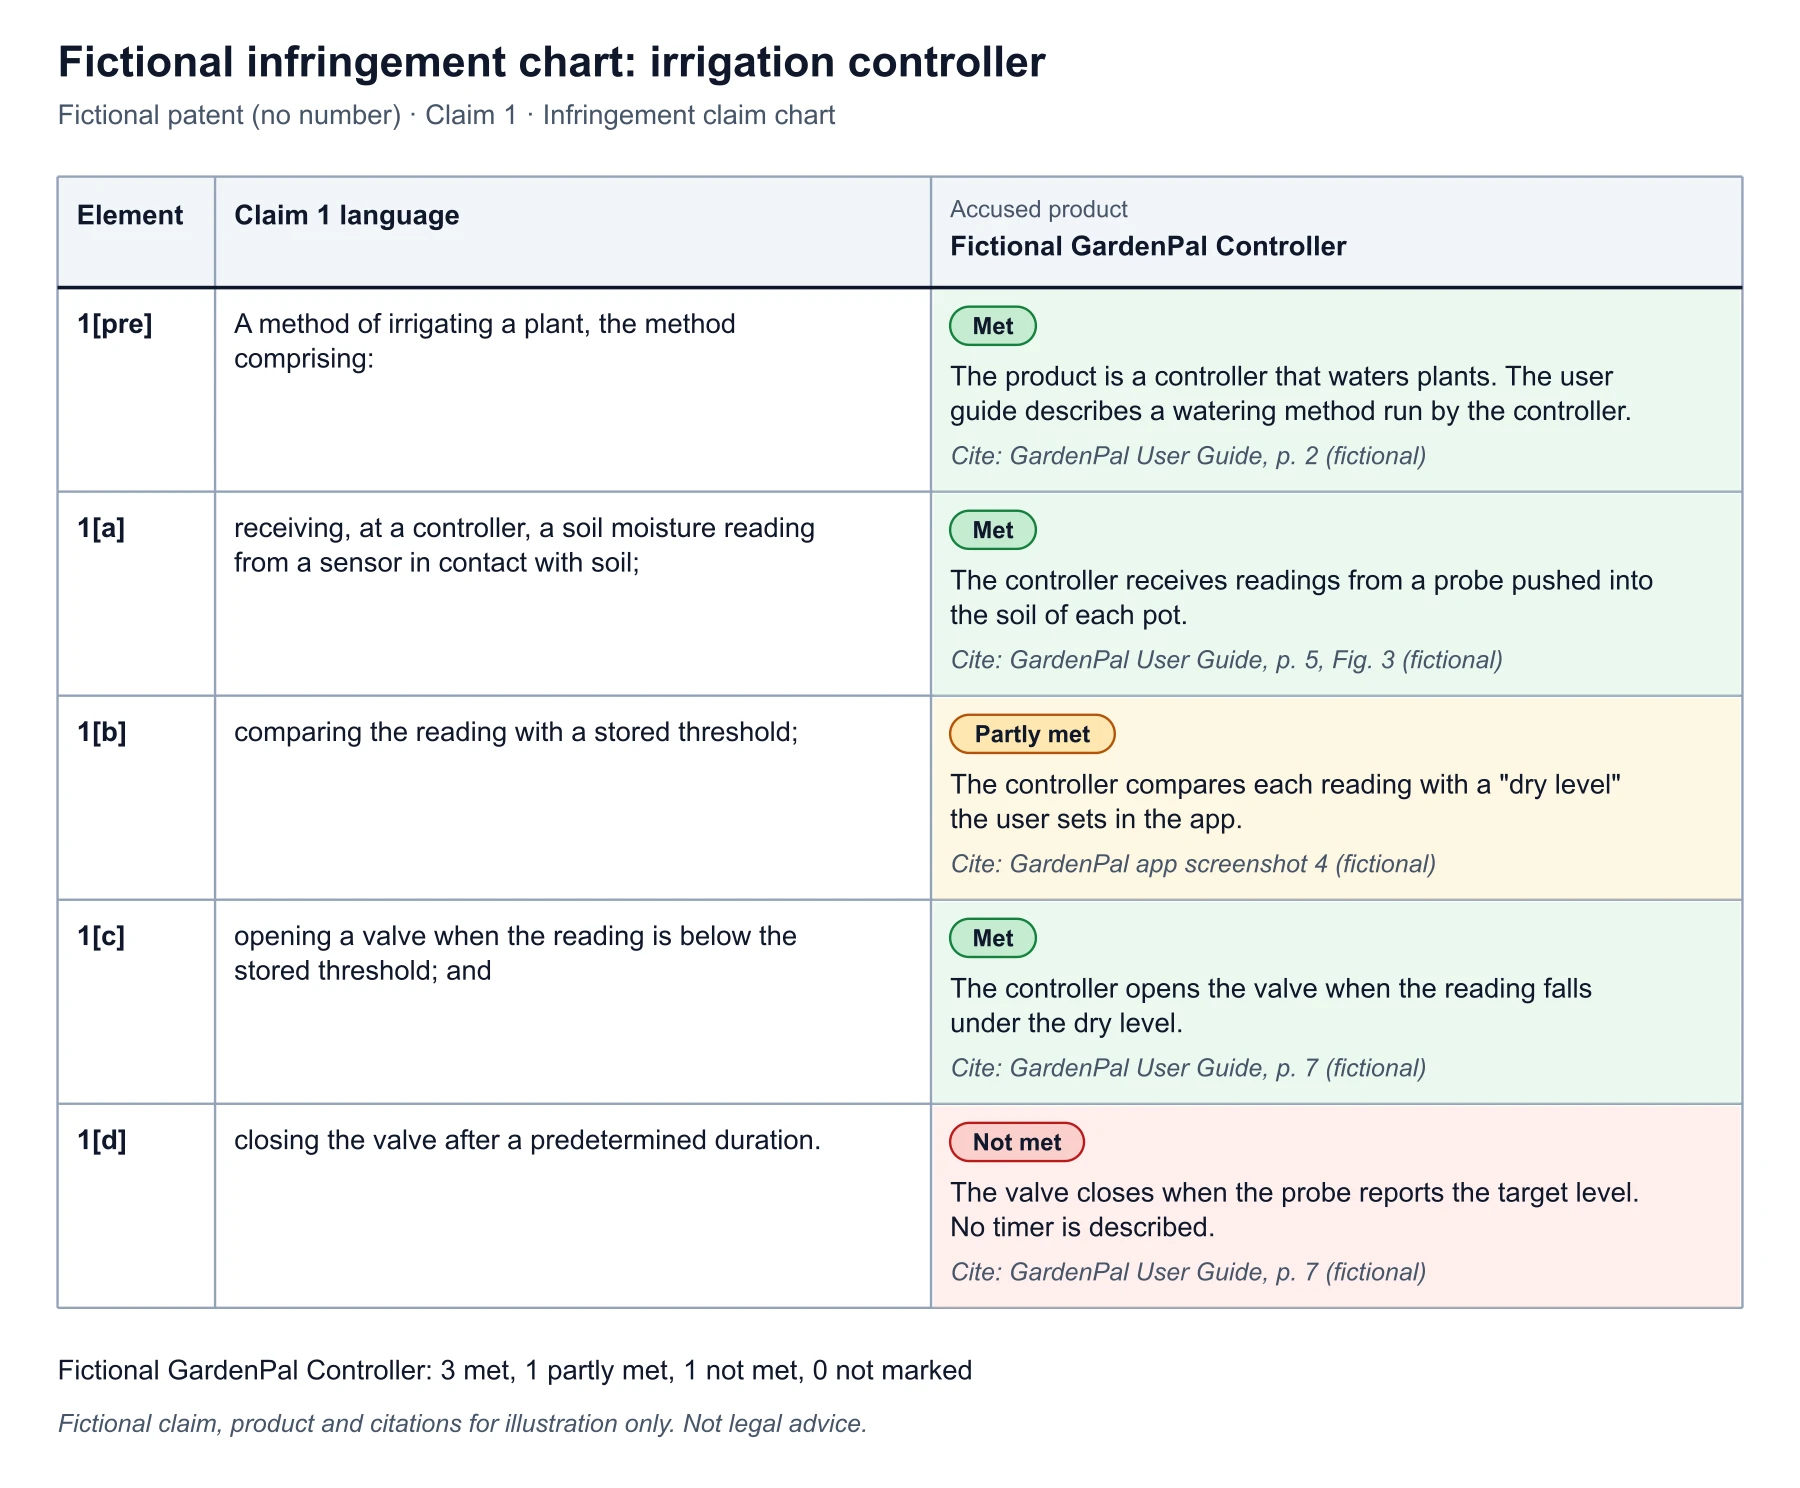
Looking for something else? Browse all diagram and chart tools.
Social work and planning
Relationship maps and project plans.