Pugh Matrix Generator with Weights
Pick a datum, list your options and criteria, and score each option as better (+), same (S) or worse (−). Totals update as you type, with optional weights, then export SVG, PNG or CSV.
Pugh matrix
Score every option against the datum, one criterion at a time. Up to 6 options and 15 criteria.
| Criterion | Weight | Brushless drill | Modular battery | Low-cost build | Delete |
|---|---|---|---|---|---|
CSV: first column is the criterion, an optional weight column, then one column per option. Name the datum column Name (datum). Scores: +, S, -, ++, -- or 1, 0, -1, 2, -2. Comma, semicolon or tab separated.
Best: Brushless drill (+9 weighted)
What is a Pugh matrix?
A Pugh matrix, also called a Pugh chart or Pugh concept selection, is a table for choosing between design or solution options. The criteria run down the side and the options run across the top. One option is picked as the datum, the baseline, and every other option is scored as better (+), the same (S) or worse (−) than the datum on each criterion. Counting the marks shows which options beat the baseline and where each one is weak.
Because every score is relative to one known baseline, it works well early in a design, when you can say that one concept is lighter or cheaper than the current one but cannot yet put exact numbers on all of them. This generator draws the matrix as you type, totals each column, outlines the best option and exports the result.
How to make a Pugh matrix
- 1
Name the decision and choose the datum
The datum is the option everything else is compared with: usually the current product, process or vendor, or the concept the team already likes best. Type it in the Datum box. Every other option is judged only against it.
- 2
Add the options
List the candidate concepts as columns. Three to five is typical; more than six makes the sheet hard to read. Give each a short, distinct name.
- 3
List the criteria
One row per thing that matters, written so that "better" is clear: "Battery runtime", not "Battery". Take them from requirements, customer needs or a QFD, and keep them independent so one benefit is not counted twice.
- 4
Score every option against the datum
For each cell, ask whether the option is better (+), about the same (S) or worse (−) than the datum on that criterion. The datum column stays S by definition. Score one criterion across all options at a time, so the same yardstick is used.
- 5
Read the totals, then challenge them
The matrix counts the pluses, sames and minuses for each option and shows a net score. Switch weighting on to multiply each score by its criterion weight. Treat the result as a conversation starter: ask why the leader wins, and whether a strong idea from another option could be combined with it.
- 6
Iterate
Pick a new datum from the strongest option, drop options that are clearly behind, add improved or hybrid concepts, and score again. Pugh described this as converging on a design over several rounds rather than choosing in one pass.
Scoring and totals: +, S, − and weights
The classic count has three totals per option: how many criteria are better than the datum, how many are the same, and how many are worse. The net score is pluses minus minuses. If the criteria are not equally important, switch on weighting: each score is multiplied by its weight and the products are added into a weighted total. An option is outlined as best only when its total is above zero, that is, when it beats the datum overall; equal top totals are marked as tied.
| Scale | Counted as | When to use it |
|---|---|---|
| + / S / − | +1 / 0 / −1 | The classic Pugh scale. Fast to agree on in a workshop and hard to over-read. Start here. |
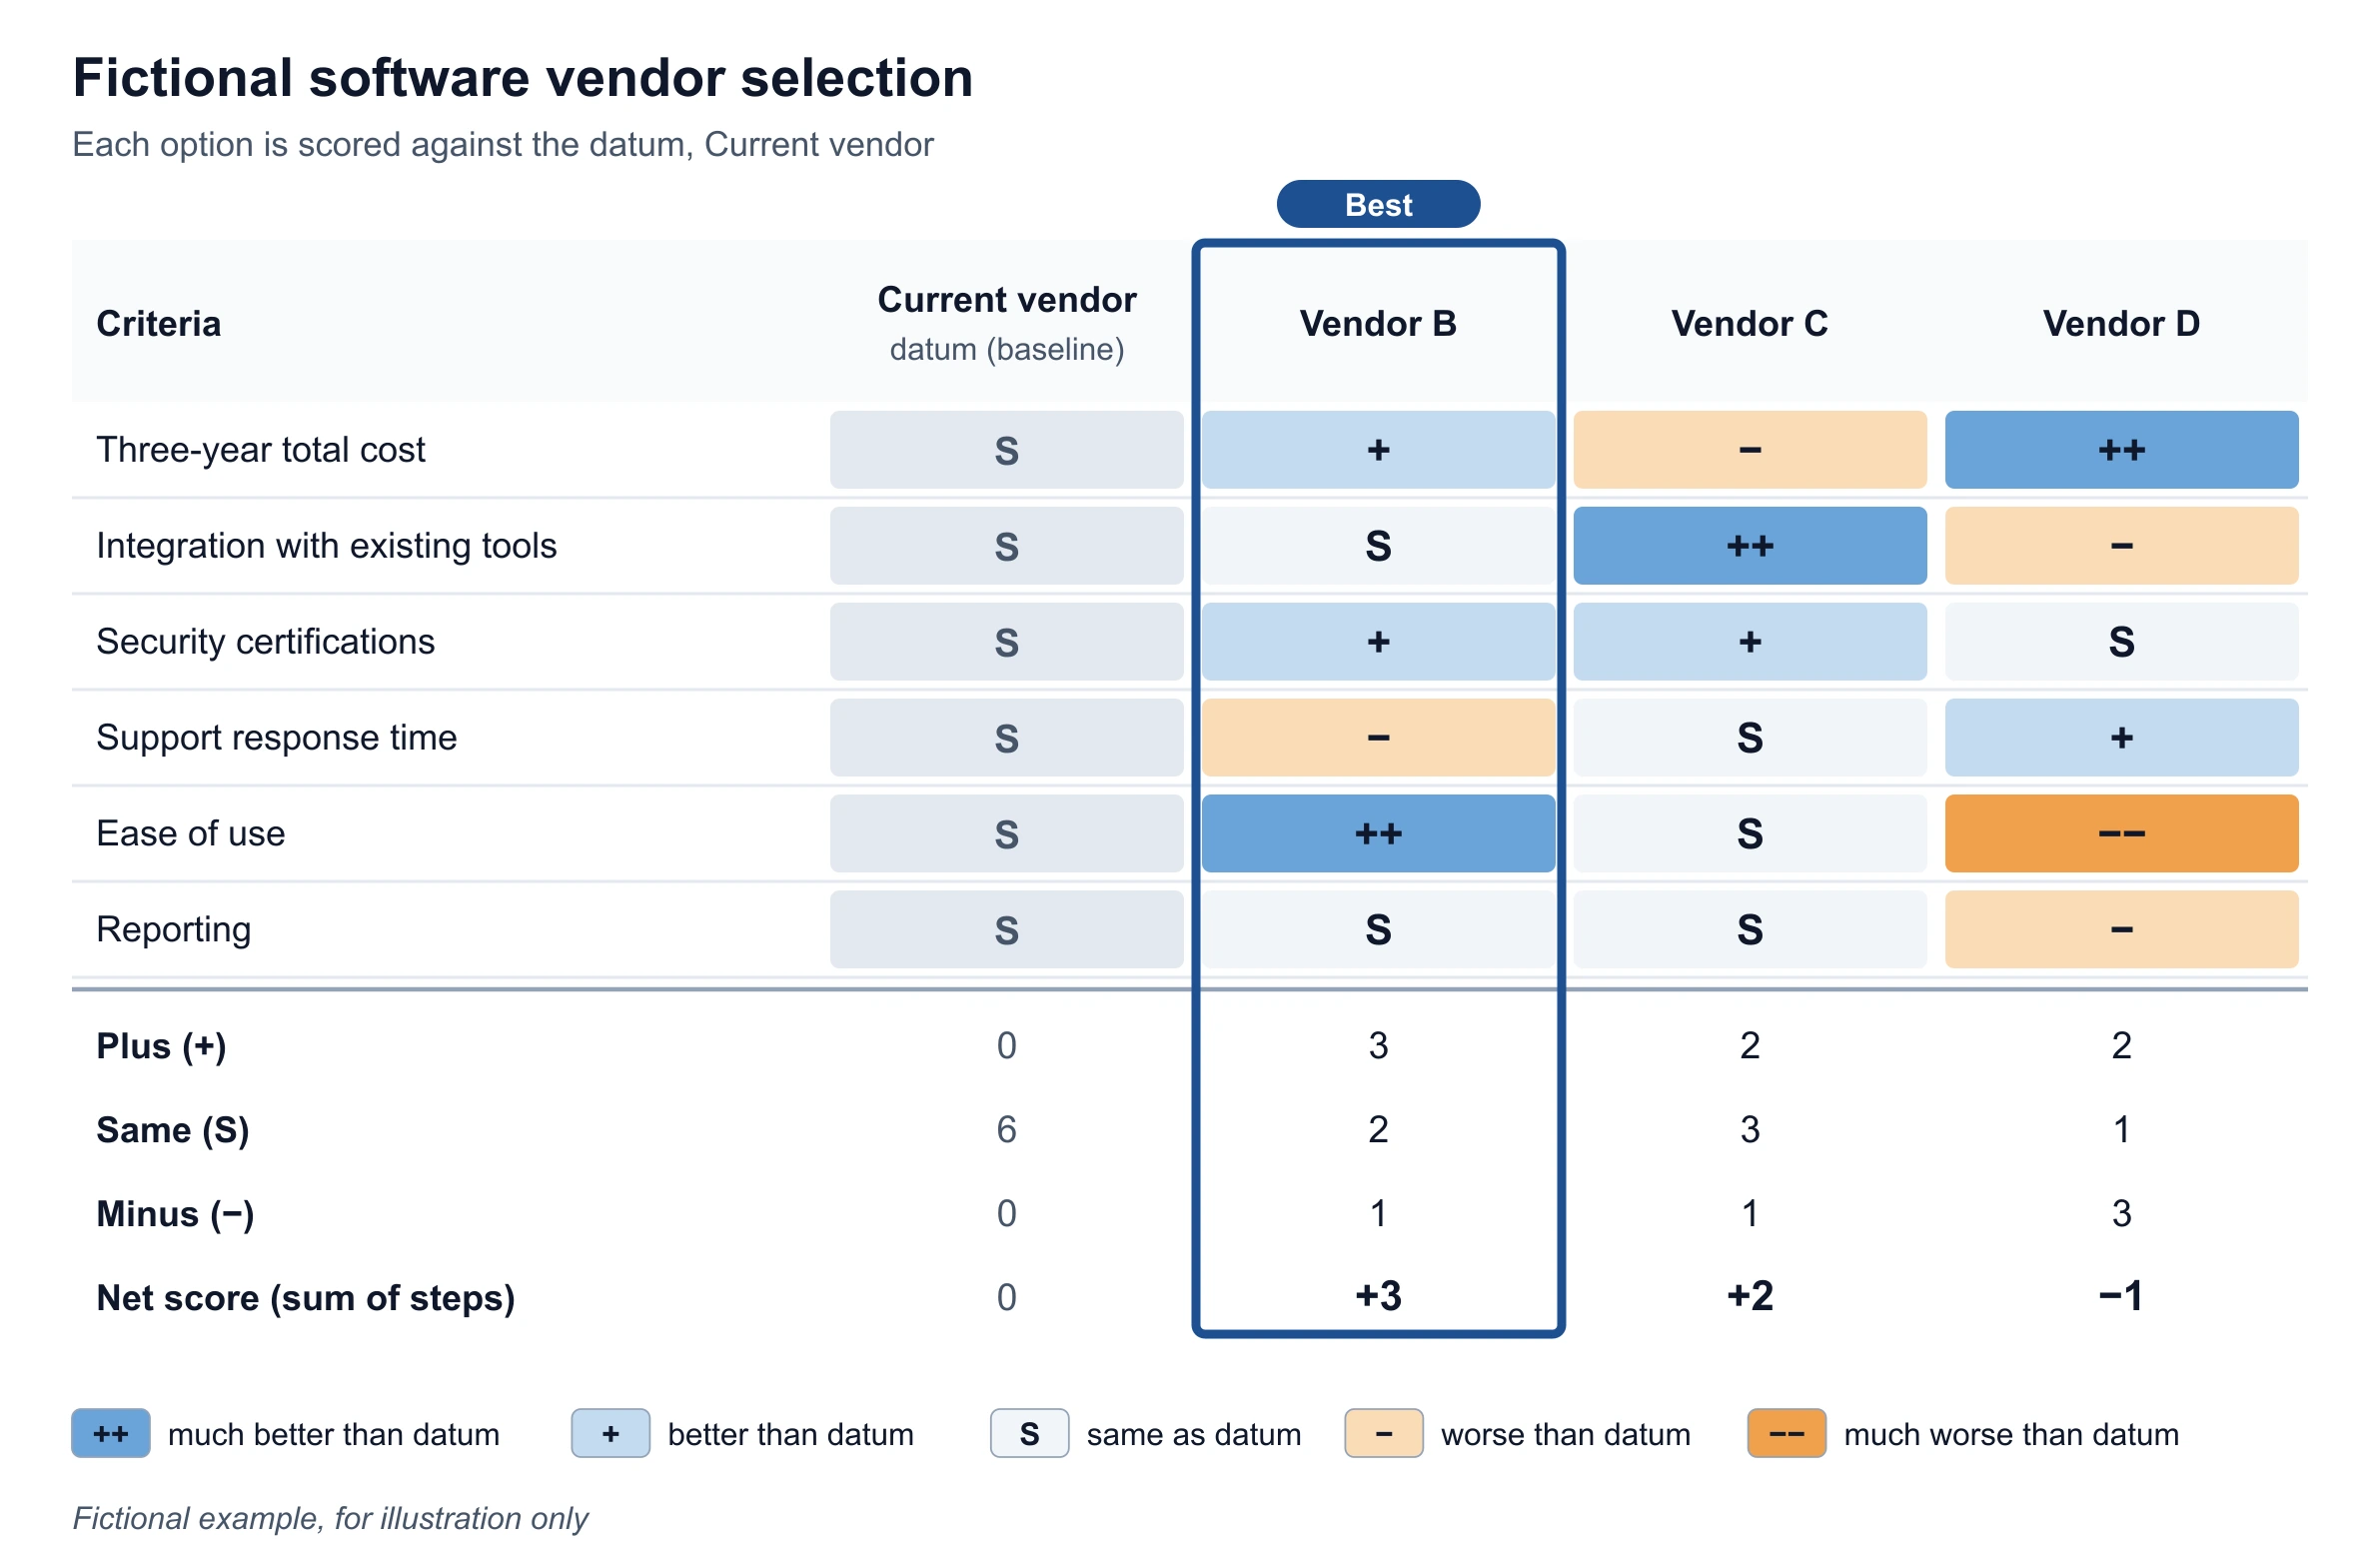
| ++ / + / S / − / −− | +2 / +1 / 0 / −1 / −2 | When a few criteria are clearly much better or much worse and the three-step scale hides it. Agree what "much" means before scoring. |
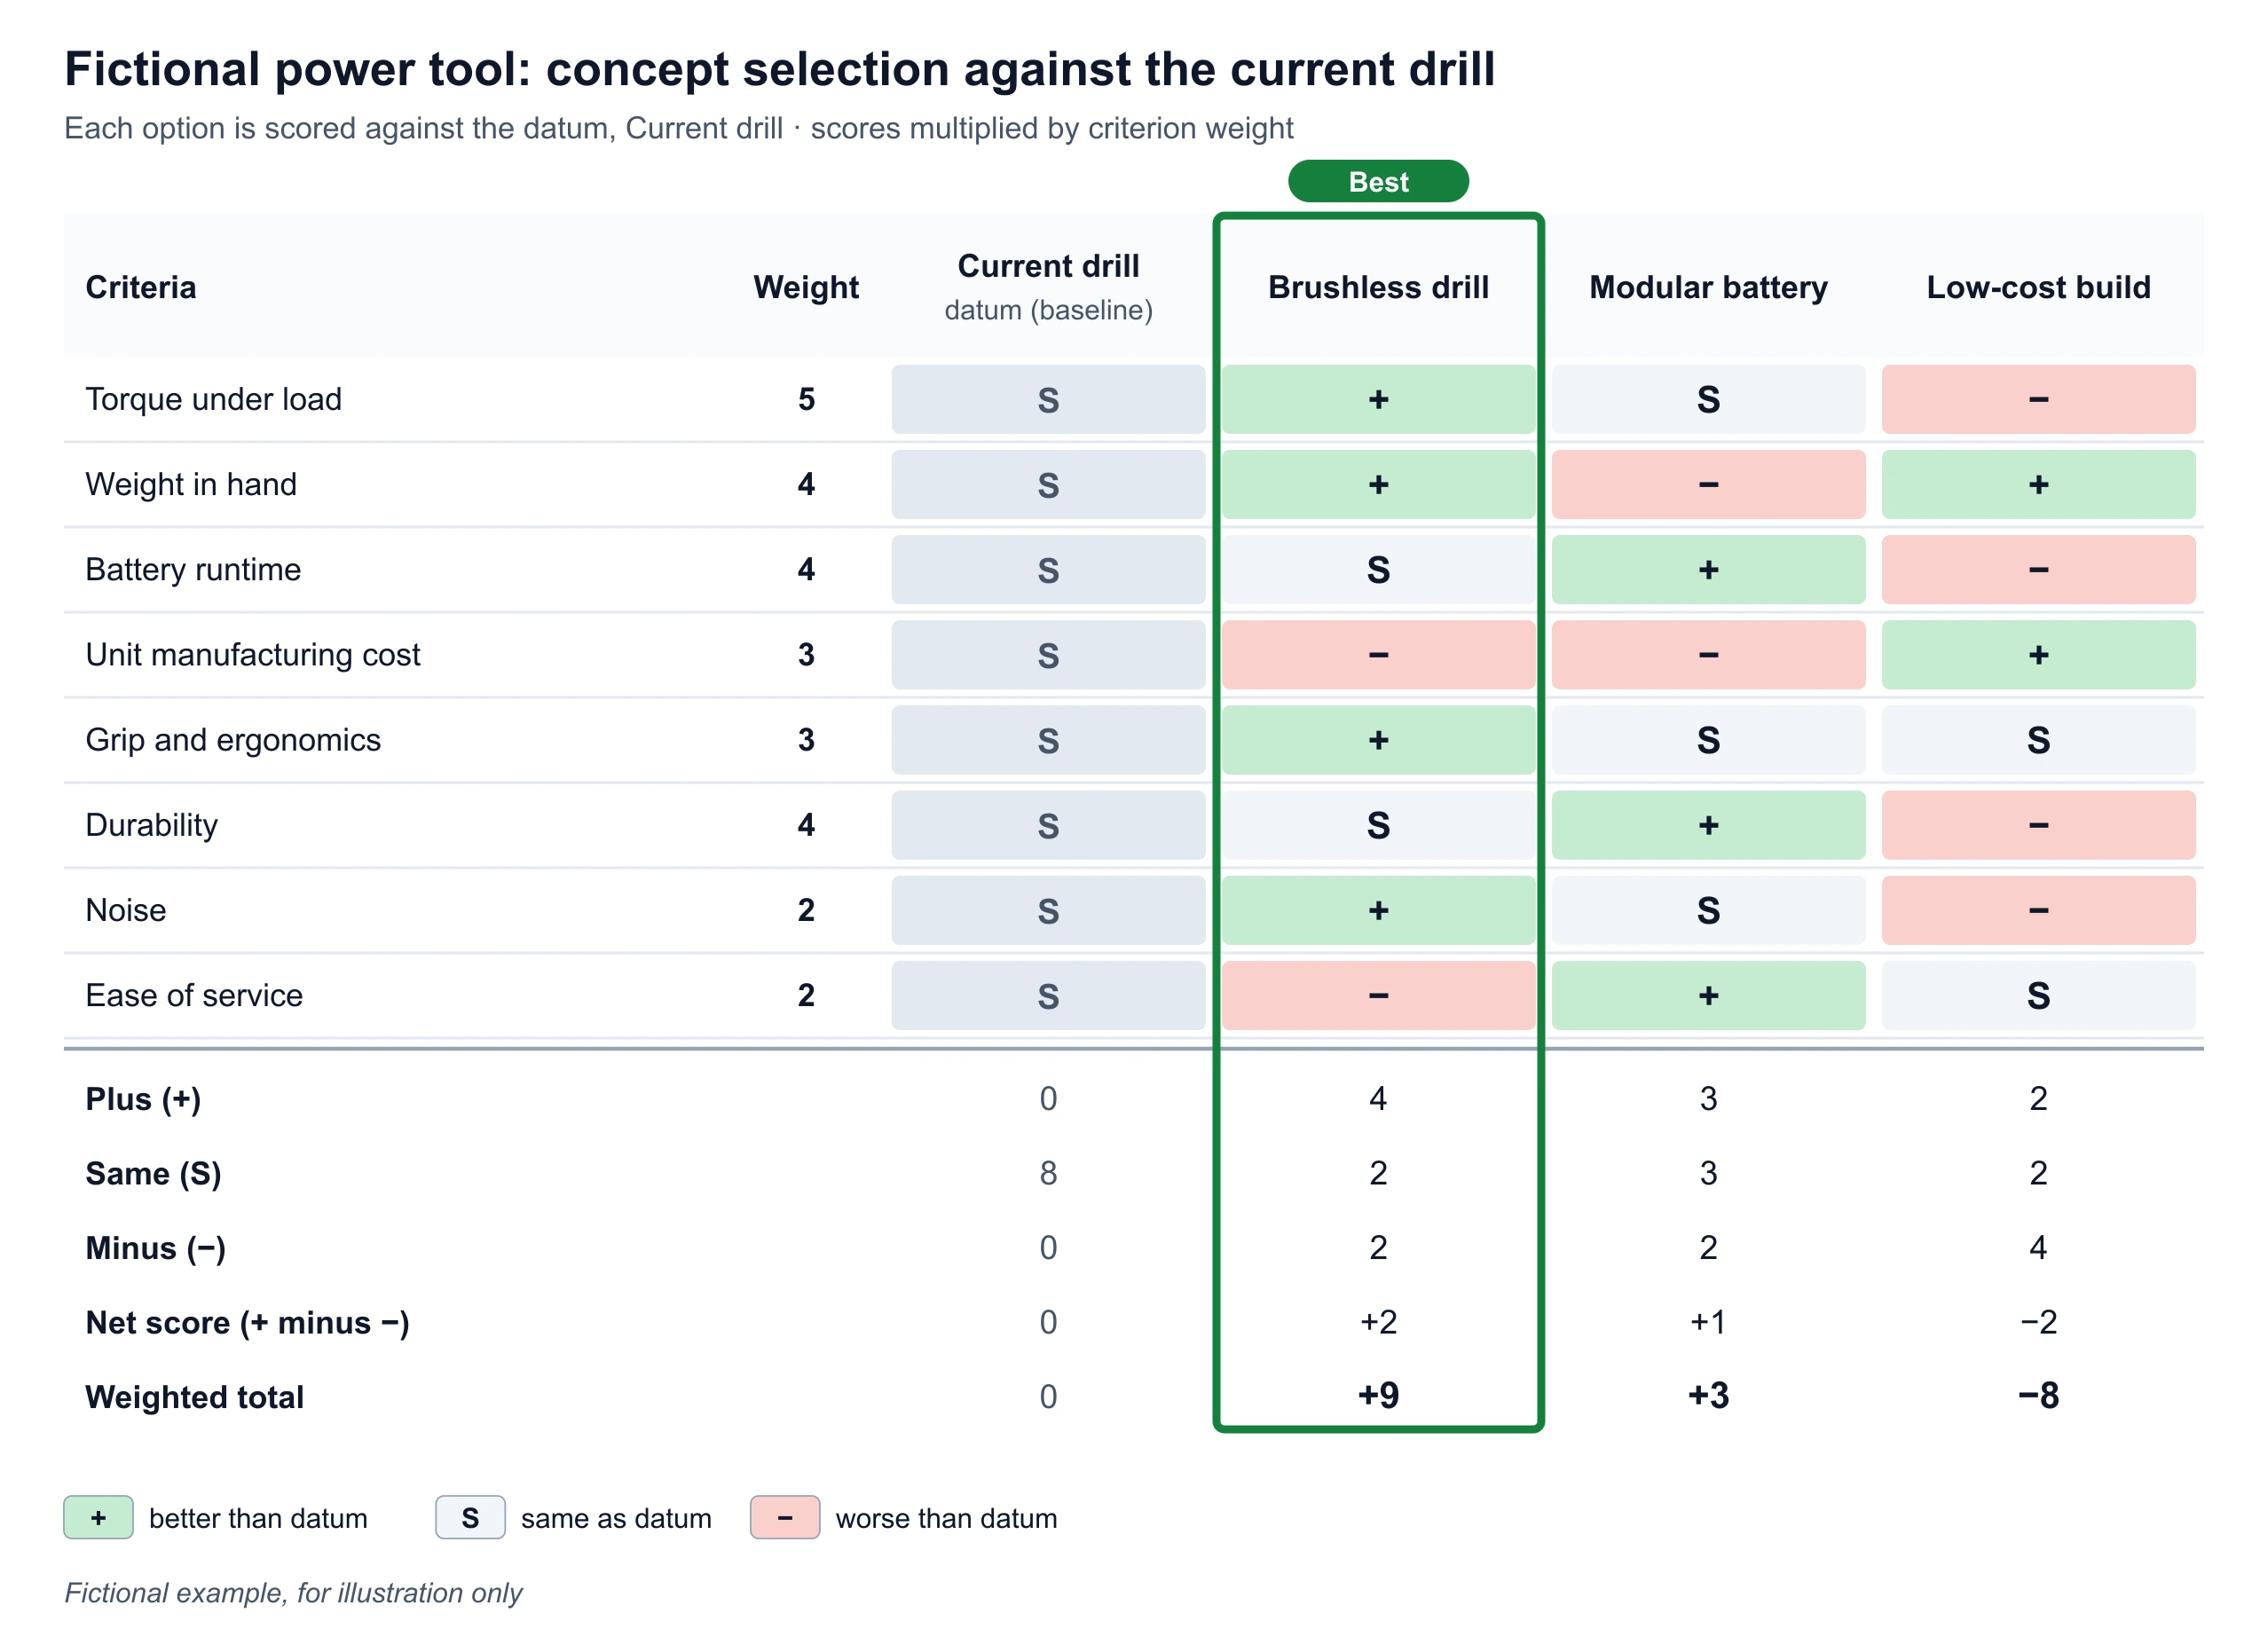
In the example above, Brushless drill has four pluses and two minuses, so its net score is +2. With weights, its two minuses fall on criteria weighted 3 and 2, while its pluses include the criteria weighted 5 and 4, so its weighted total is +9, well ahead of Modular battery at +3. With equal weights the net scores are only +2 and +1, which is why the weights should be agreed before scoring.
Pugh matrix vs a comparison chart or a decision tree
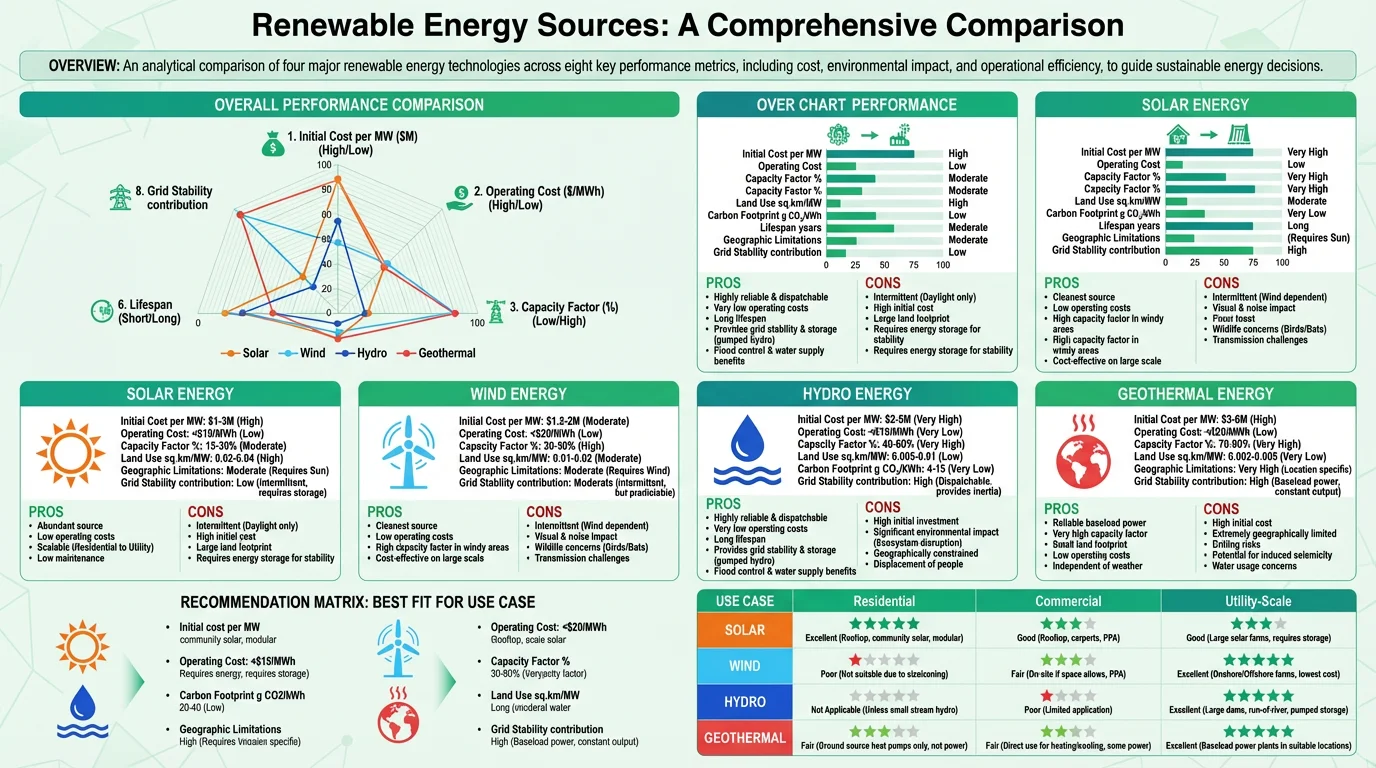
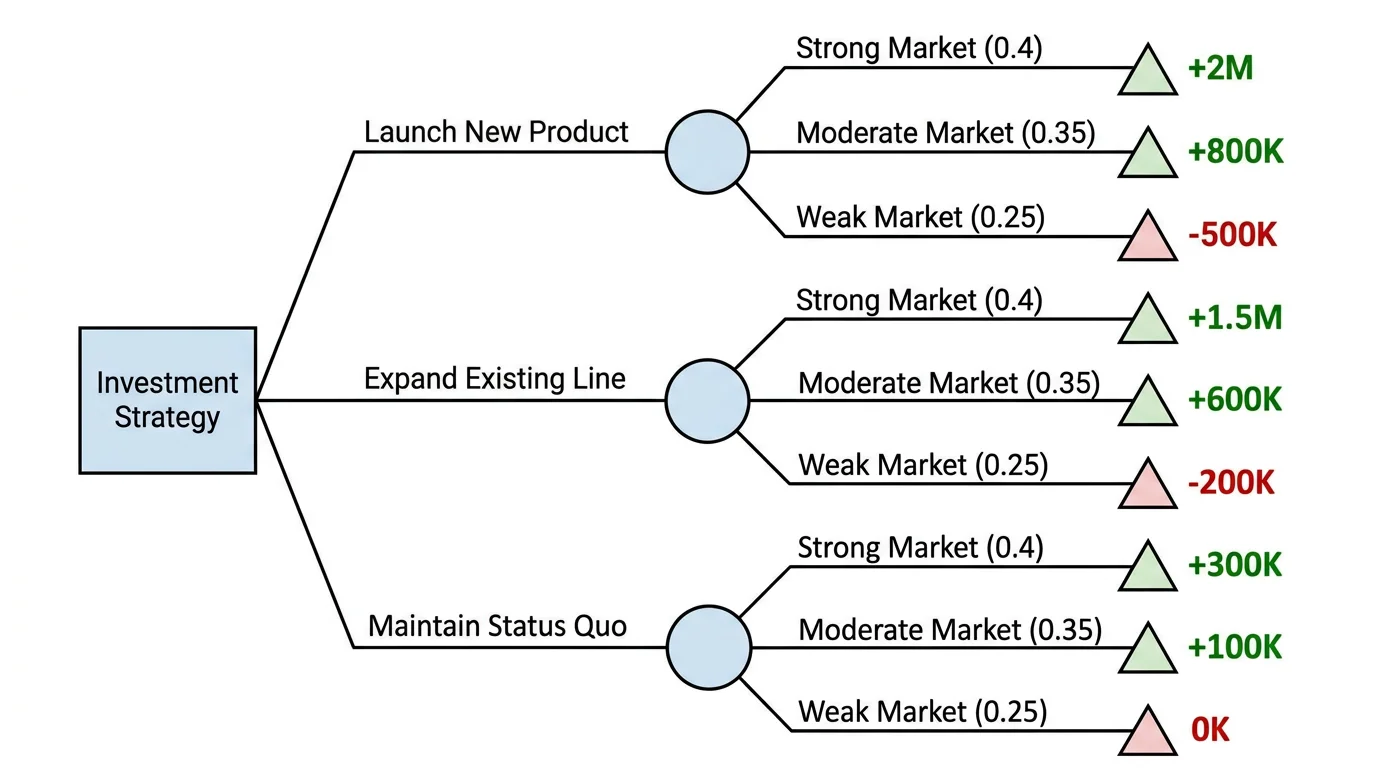
A comparison chart describes options side by side, with facts such as price or size, and leaves the choice to the reader. A Pugh matrix is built to rank: every cell is a judgment against one baseline and the columns are totaled. A decision tree is for a different shape of problem, a sequence of choices with uncertain outcomes and probabilities. Use a Pugh matrix when you have several candidate concepts, one baseline and a list of criteria, and you need to narrow down.
Common Pugh matrix mistakes
- Choosing a datum nobody understands. If the team does not know the baseline well, every comparison is a guess. Pick something you can describe in numbers.
- Changing the datum halfway through a round. Scores only mean something against one baseline; if the datum changes, re-score the whole column set.
- Weights that were picked after seeing the result. Agree the weights first, then score, or the weights end up justifying a favorite.
- Criteria that overlap. "Light" and "easy to carry" count the same benefit twice and quietly give it double weight.
- Reading the net score as a measurement. A +4 is not twice as good as a +2; it is a count of where one option beats the datum.
- Stopping at the first winner. The point of the method is to find which features of each concept are strong, then improve the weak spots and run it again.
Using it responsibly
The generator totals the scores you enter. It does not judge whether your criteria, weights or scores are right, and a Pugh matrix is a structured way to discuss options, not a proof that one is best. For safety-critical, regulated or high-cost decisions, back the scores with measured data and follow the selection process your organization or client requires. Once you have a leading option, a risk heat map is a good way to examine what could go wrong with it.
Pugh Matrix Examples
Exact exports from the generator above, using fictional example data
Weighted Pugh Matrix: Power Tool Concepts
Exact render from fictional data: eight weighted criteria, plus, same and minus counts, net score and weighted total.
Five-Step Pugh Matrix: Vendor Selection, Color-Blind Safe
Exact render from fictional data: the ++ to −− scale in the blue and orange color-blind safe palette.
Pugh matrix vs weighted decision matrix: what is the difference?
A weighted decision matrix scores every option on an absolute scale (for example 1 to 5) for each criterion, multiplies by the criterion weight, and adds up. A Pugh matrix scores every option relative to one datum using better, same or worse, and starts as a simple count with no weights. Many teams add weights to a Pugh matrix later, and this generator supports that, but the datum and the relative scoring are what make it a Pugh matrix. The relative scoring is easier to agree on when you do not yet have numbers for every option.
Where does the Pugh matrix come from?
It is named after Stuart Pugh, a British design engineer and academic who described it in his book Total Design, and is also called a Pugh chart, Pugh concept selection or the decision-matrix method for concept selection. It is common in product and systems engineering, Six Sigma and quality function deployment (QFD) work. There are many variants in the wild: some use 1, 2, 3 base scores, some use weights from 1 to 5 or 1 to 10, and some run several rounds. This page uses the plus, same and minus convention, with optional weights and an optional five-step scale.
Frequently Asked Questions
Related Decision & Planning Tools
 Research
Comparison Chart Maker
Lay options side by side in feature tables when you need to describe them rather than rank them.
 Research
Decision Tree Generator
Map a sequence of choices and outcomes when the decision unfolds in steps.
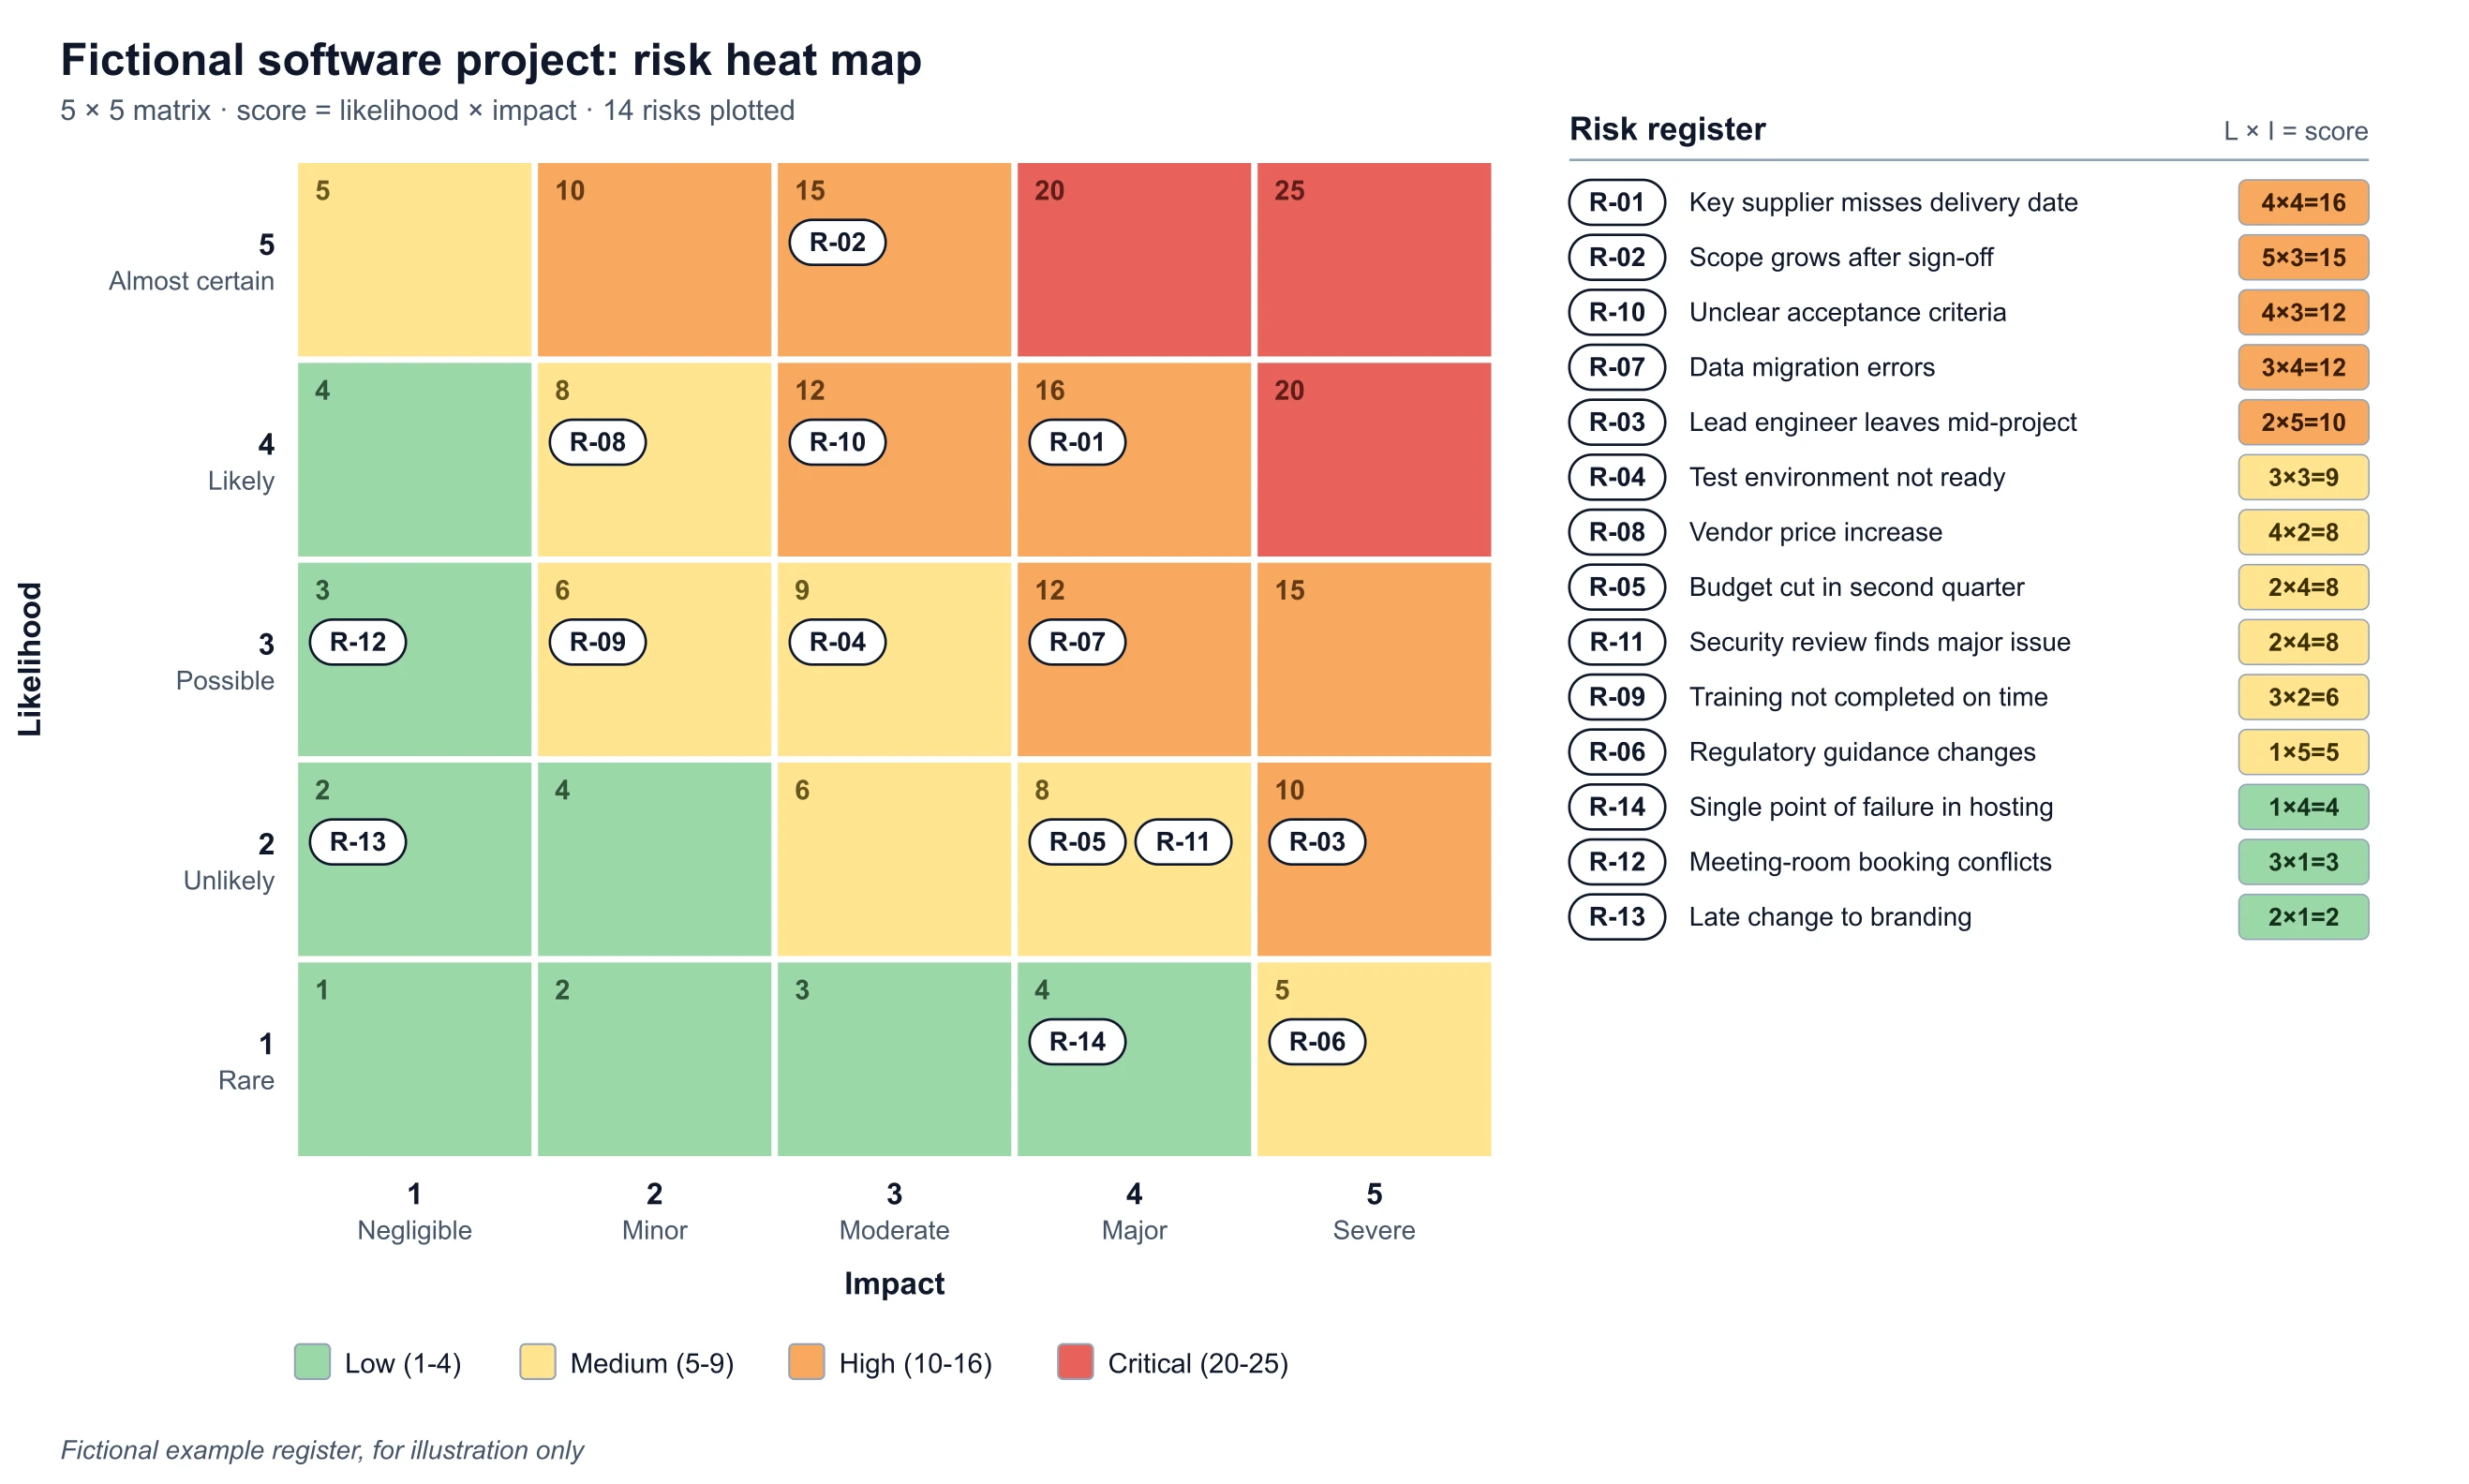 Business
Risk Heat Map Maker
Rank the risks of your leading option on a likelihood and impact matrix.
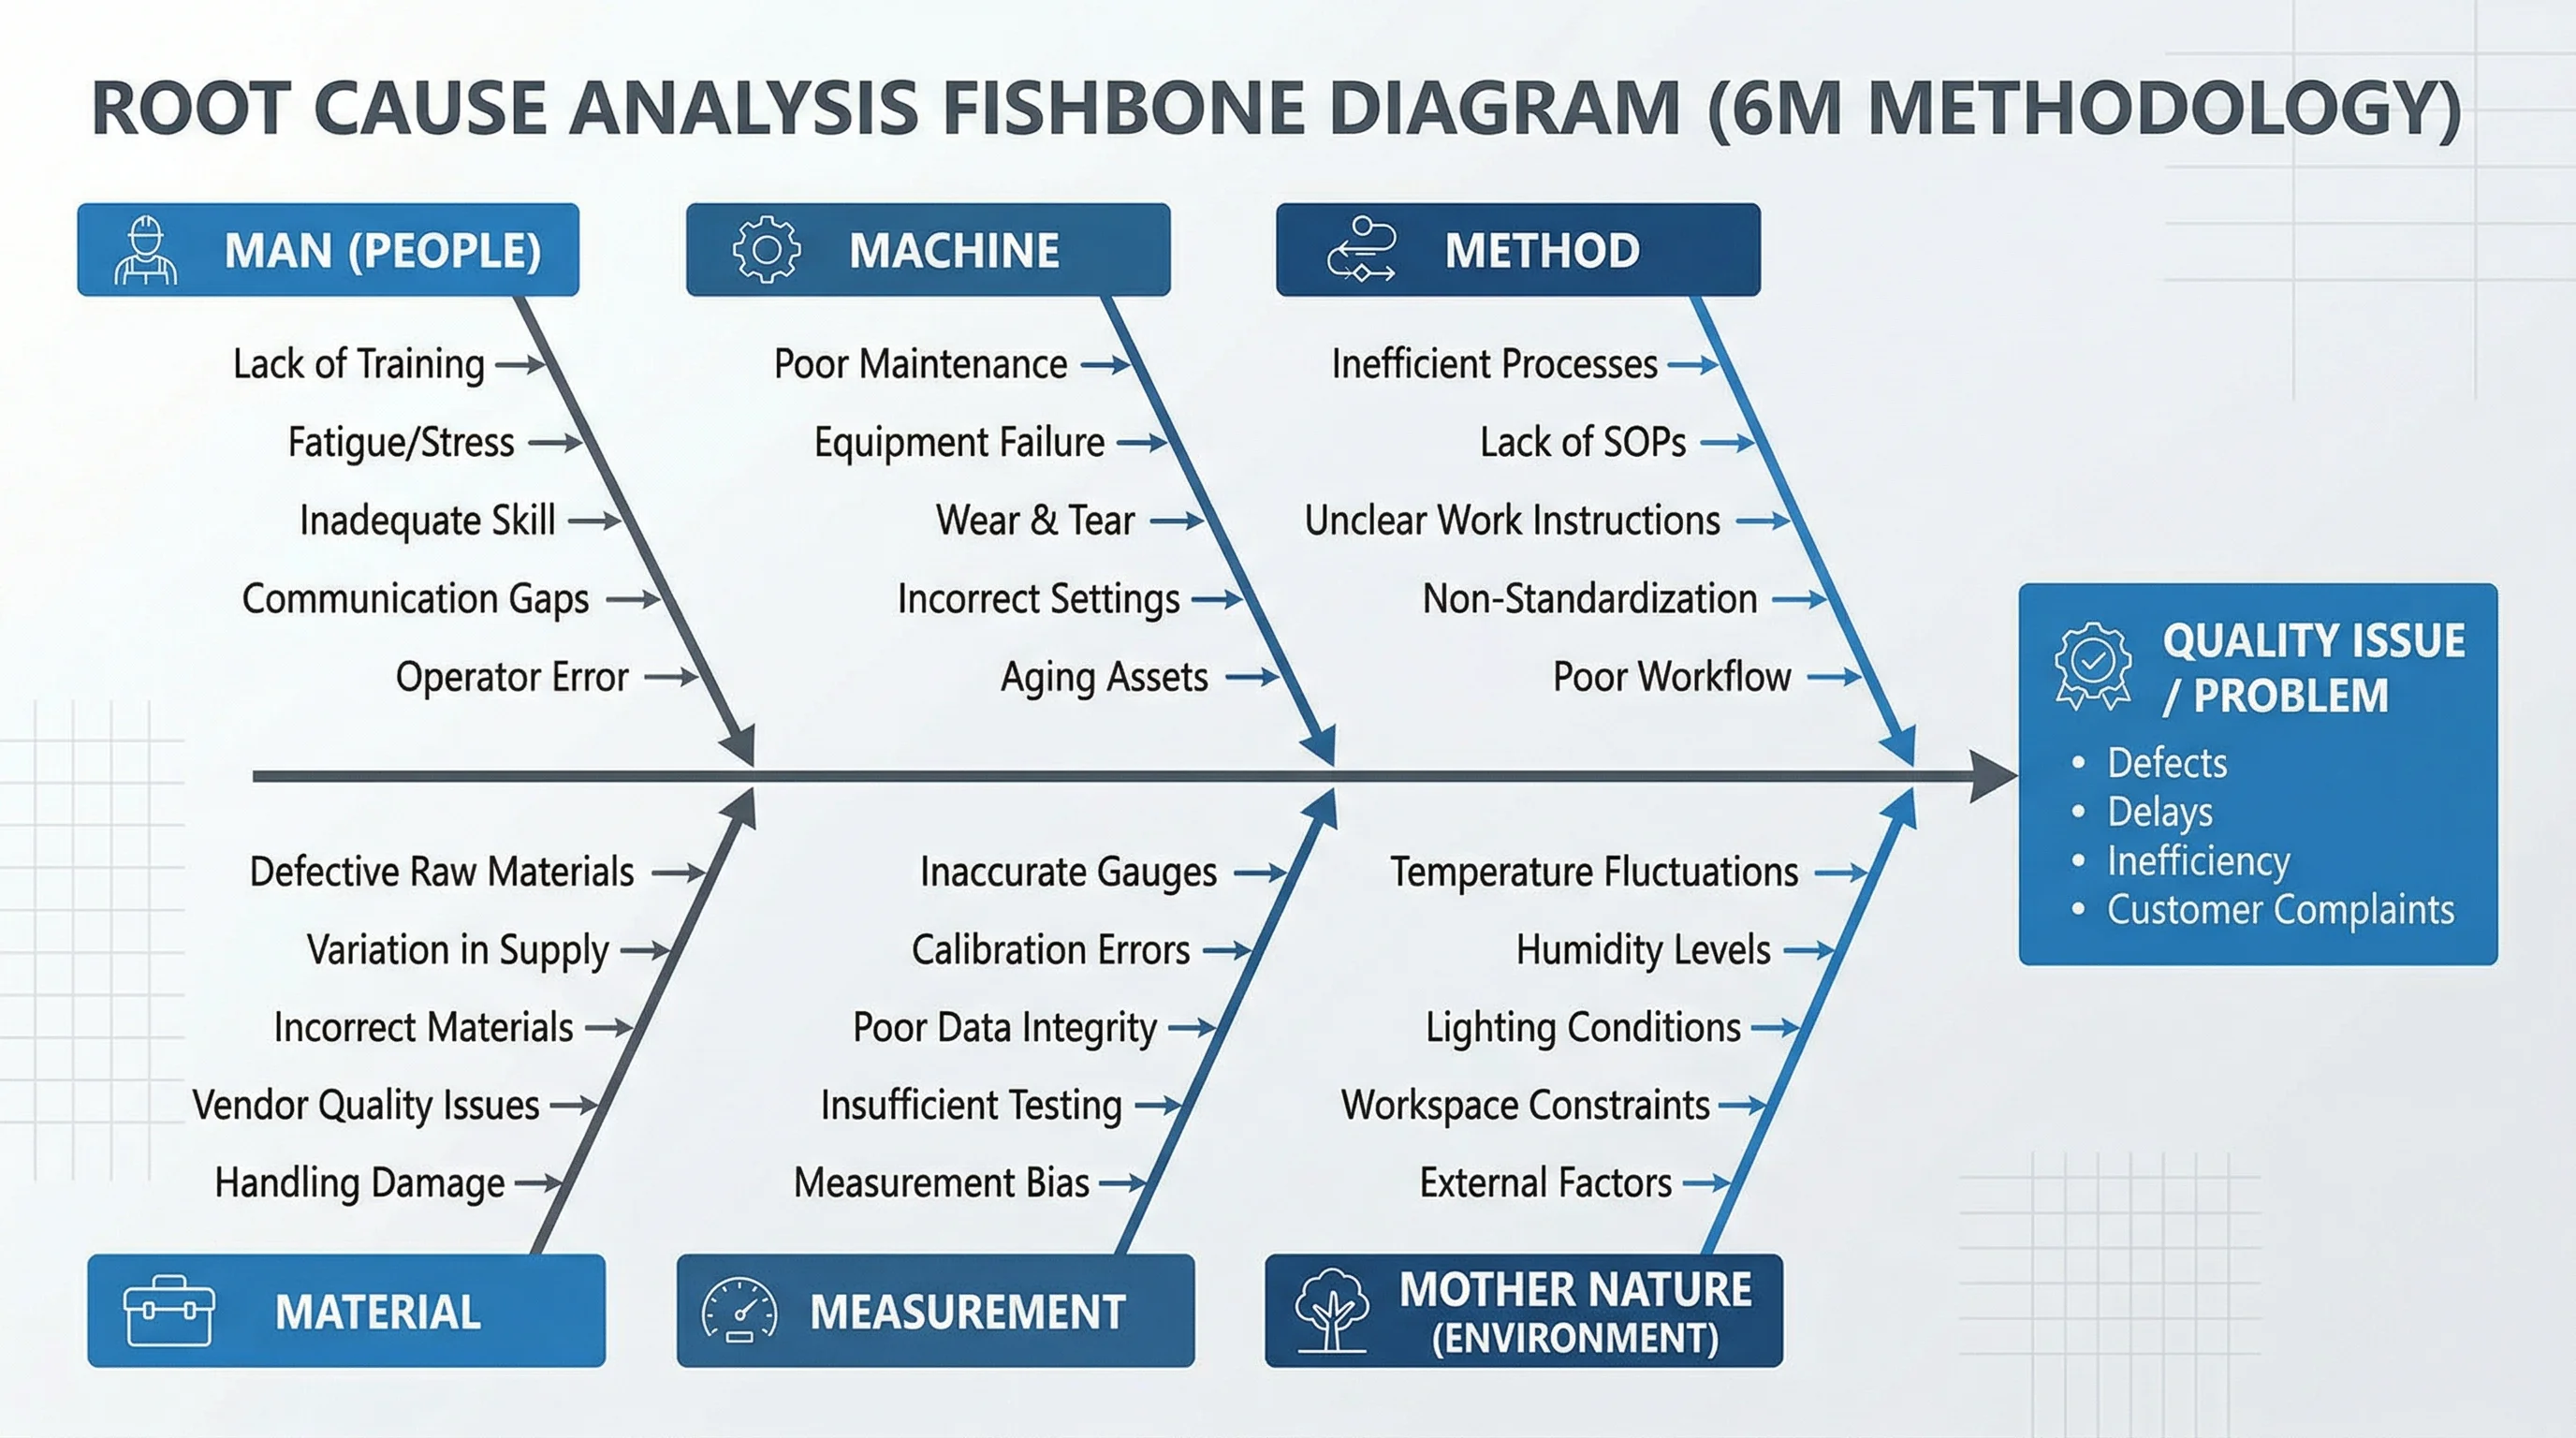 Quality
Fishbone Diagram Generator
Find the root causes behind the problem you are solving.
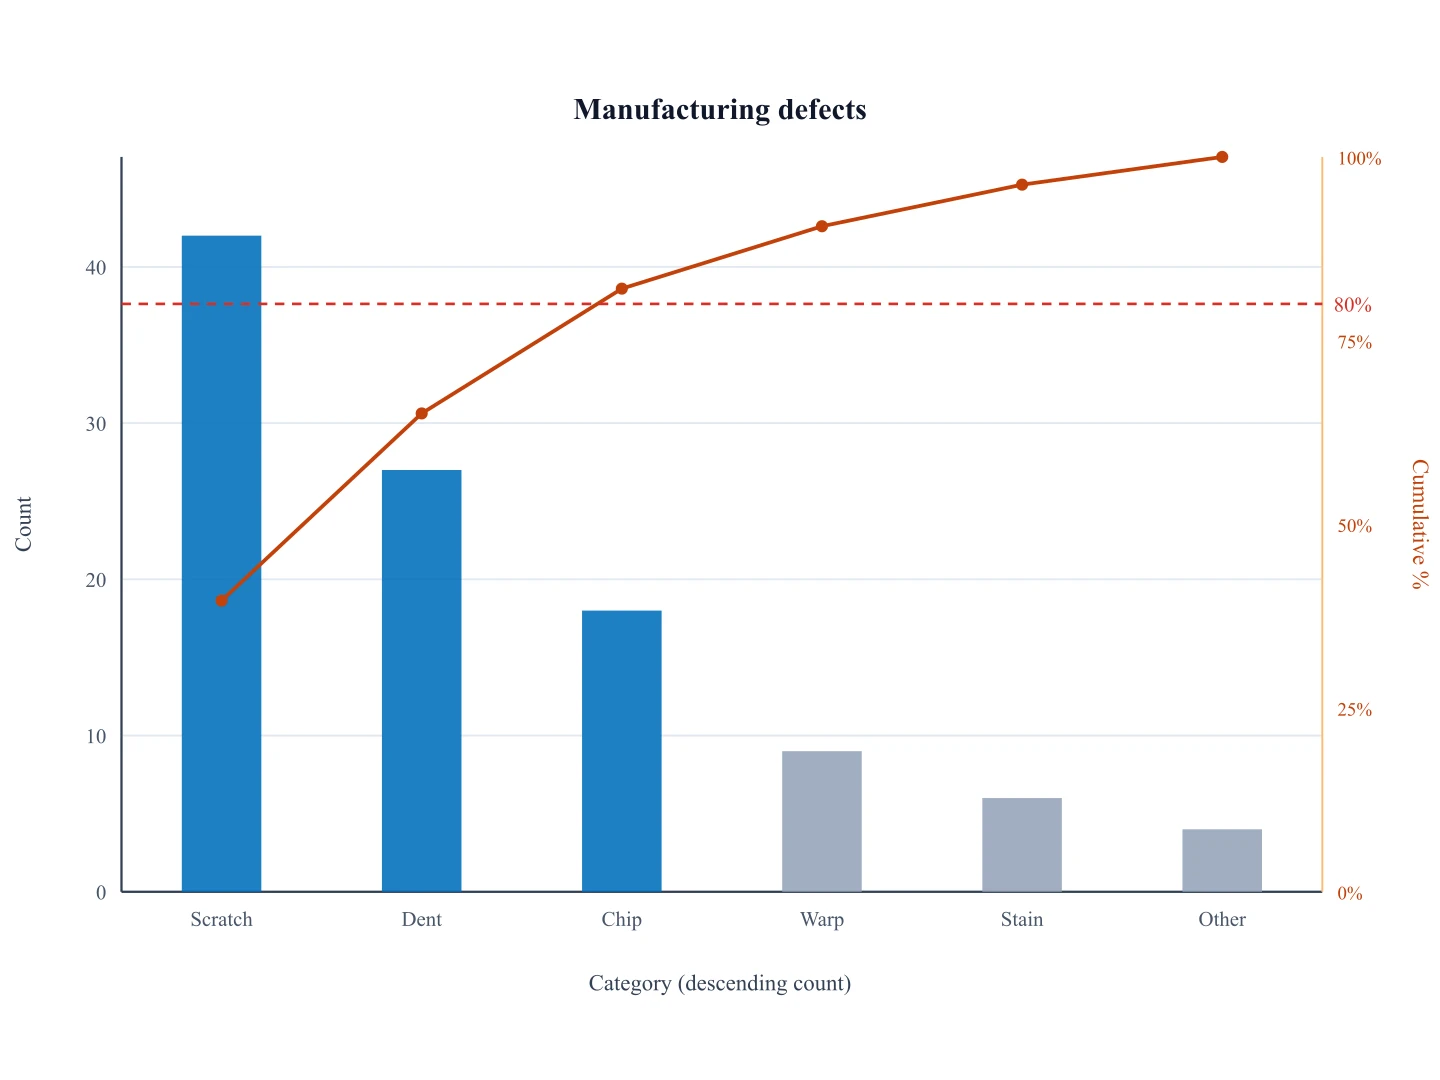 Quality
Pareto Chart Generator
Rank causes or defects by frequency to pick the criteria that matter.