Genogram Maker for Family Relationship Diagrams
Make a genogram online from a description. A genogram is a family relationship diagram that maps not just who is related, but how — emotional bonds, medical history, and patterns across generations. Describe your family and the AI draws it with standard genogram symbols. Download as PNG.
AI Genogram Maker
Free to try ·
Your genogram will appear here
Describe people, marriages, children, and relationships
Genogram Examples
Family relationship diagrams covering structure, emotions, and medical history
Three-Generation Genogram
The standard structure: grandparents on top, parents in the middle, children below, with marriage and child lines.
Medical History Genogram
Shaded symbols and a legend trace hereditary conditions across generations — useful for family medical history.
Emotional Relationships
Relationship lines turn a family tree into a map of bonds — close, conflictual, distant, and cutoff.
Behavioral Patterns
Special markings track behavioral and substance-use patterns down through the generations.
Cultural Genogram
Cultural genograms add origin, religion, and migration — a common tool in social work and counseling.
Social Work Assessment
Households, support systems, and the identified client are marked for case documentation.
What is a genogram?
A genogram is a detailed family diagram that maps relationships across two, three, or more generations. Like a family tree, it shows who is related to whom — but a genogram goes further by recording the quality of those relationships and the patterns that run through a family: emotional bonds, conflicts, medical conditions, and behaviors. Each person is drawn with a standard symbol, and lines connect them to show marriages, children, and the nature of their relationships. The technique was popularized by Monica McGoldrick and Randy Gerson, whose symbol conventions are still the standard today. The result is a single picture that therapists, counselors, social workers, nurses, and genetic counselors can read at a glance to understand a family system.
Genogram vs family tree: what is the difference?
A family tree (or pedigree chart) answers one question: who is descended from whom. It records names, dates, and the structure of a lineage. A genogram includes all of that, then adds the layers a family tree leaves out. It captures emotional relationships — who is close, who is in conflict, who has cut someone off — and it records medical and behavioral patterns such as hereditary illness, addiction, or mental-health history. In short, a family tree maps biology and a genogram maps the family system. That extra information is why genograms are a working tool in therapy and medicine rather than just a record of ancestry.
Standard genogram symbols
- People: a square represents a male and a circle represents a female; a person whose gender is unknown is drawn as a triangle or diamond.
- Marriage and partnerships: a horizontal line connects a couple, with the male conventionally on the left and the female on the right.
- Children: vertical lines drop from the marriage line to each child, ordered oldest to youngest from left to right; twins branch from a single point.
- Status: a double slash through a marriage line marks divorce, a single slash marks separation, and an X through a symbol marks a person who is deceased.
- The identified client — the person at the center of an assessment — is often drawn with a double border so the diagram is easy to read.
Relationship lines and medical shading
The features that set a genogram apart are its relationship lines and its medical markings. Relationship lines run between two people to describe their emotional connection: a doubled line for a close bond, three parallel lines for an enmeshed (over-involved) relationship, a jagged or zigzag line for conflict, a dotted line for distance, and a line broken by a slash for an estrangement or cutoff. Medical and behavioral information is shown by shading the person symbol — for example a fully filled symbol or a colored fill tied to a legend for a specific illness, a half-filled symbol for substance use, or a small marker for a mental-health condition. A legend keeps every color and pattern unambiguous, so the same diagram reads the same way for everyone on a care team.
Who uses genograms — and why
- Family therapy and counseling: therapists use genograms to surface multigenerational patterns — repeated conflicts, triangles, and emotional cutoffs — that shape how a family functions.
- Medicine and genetic counseling: clinicians build a genogram as a structured family medical history, making hereditary risks for conditions like heart disease, cancer, or diabetes easy to spot.
- Social work: caseworkers map households, supports, and stressors to assess a family situation and plan interventions, often adding cultural and migration detail.
- Nursing: nurses use genograms in family and community health assessments to document health history and identify risk factors across a household.
- Students: nursing, psychology, social work, and medical students create genograms for coursework and clinical training to learn how to read a family system.
How to make a genogram from a description
Describe your family in plain language — who is in each generation, who is married, separated, or divorced, who their children are, and any emotional patterns or medical history you want to record. The more specific you are (for example, "a conflictual relationship between the parents and a history of diabetes on the maternal side"), the more accurate the diagram. It helps to work generation by generation — name the grandparents and their marriage first, then their children and partners, then the youngest generation — so the layout stays clear. The generator draws the people with standard genogram symbols, connects them with the correct marriage, child, and relationship lines, and includes a legend for any shading or special markers. Generate a few versions, pick the clearest, and download it for your assignment, case file, or clinical record.
Frequently Asked Questions
Related Diagram Tools
 Biology
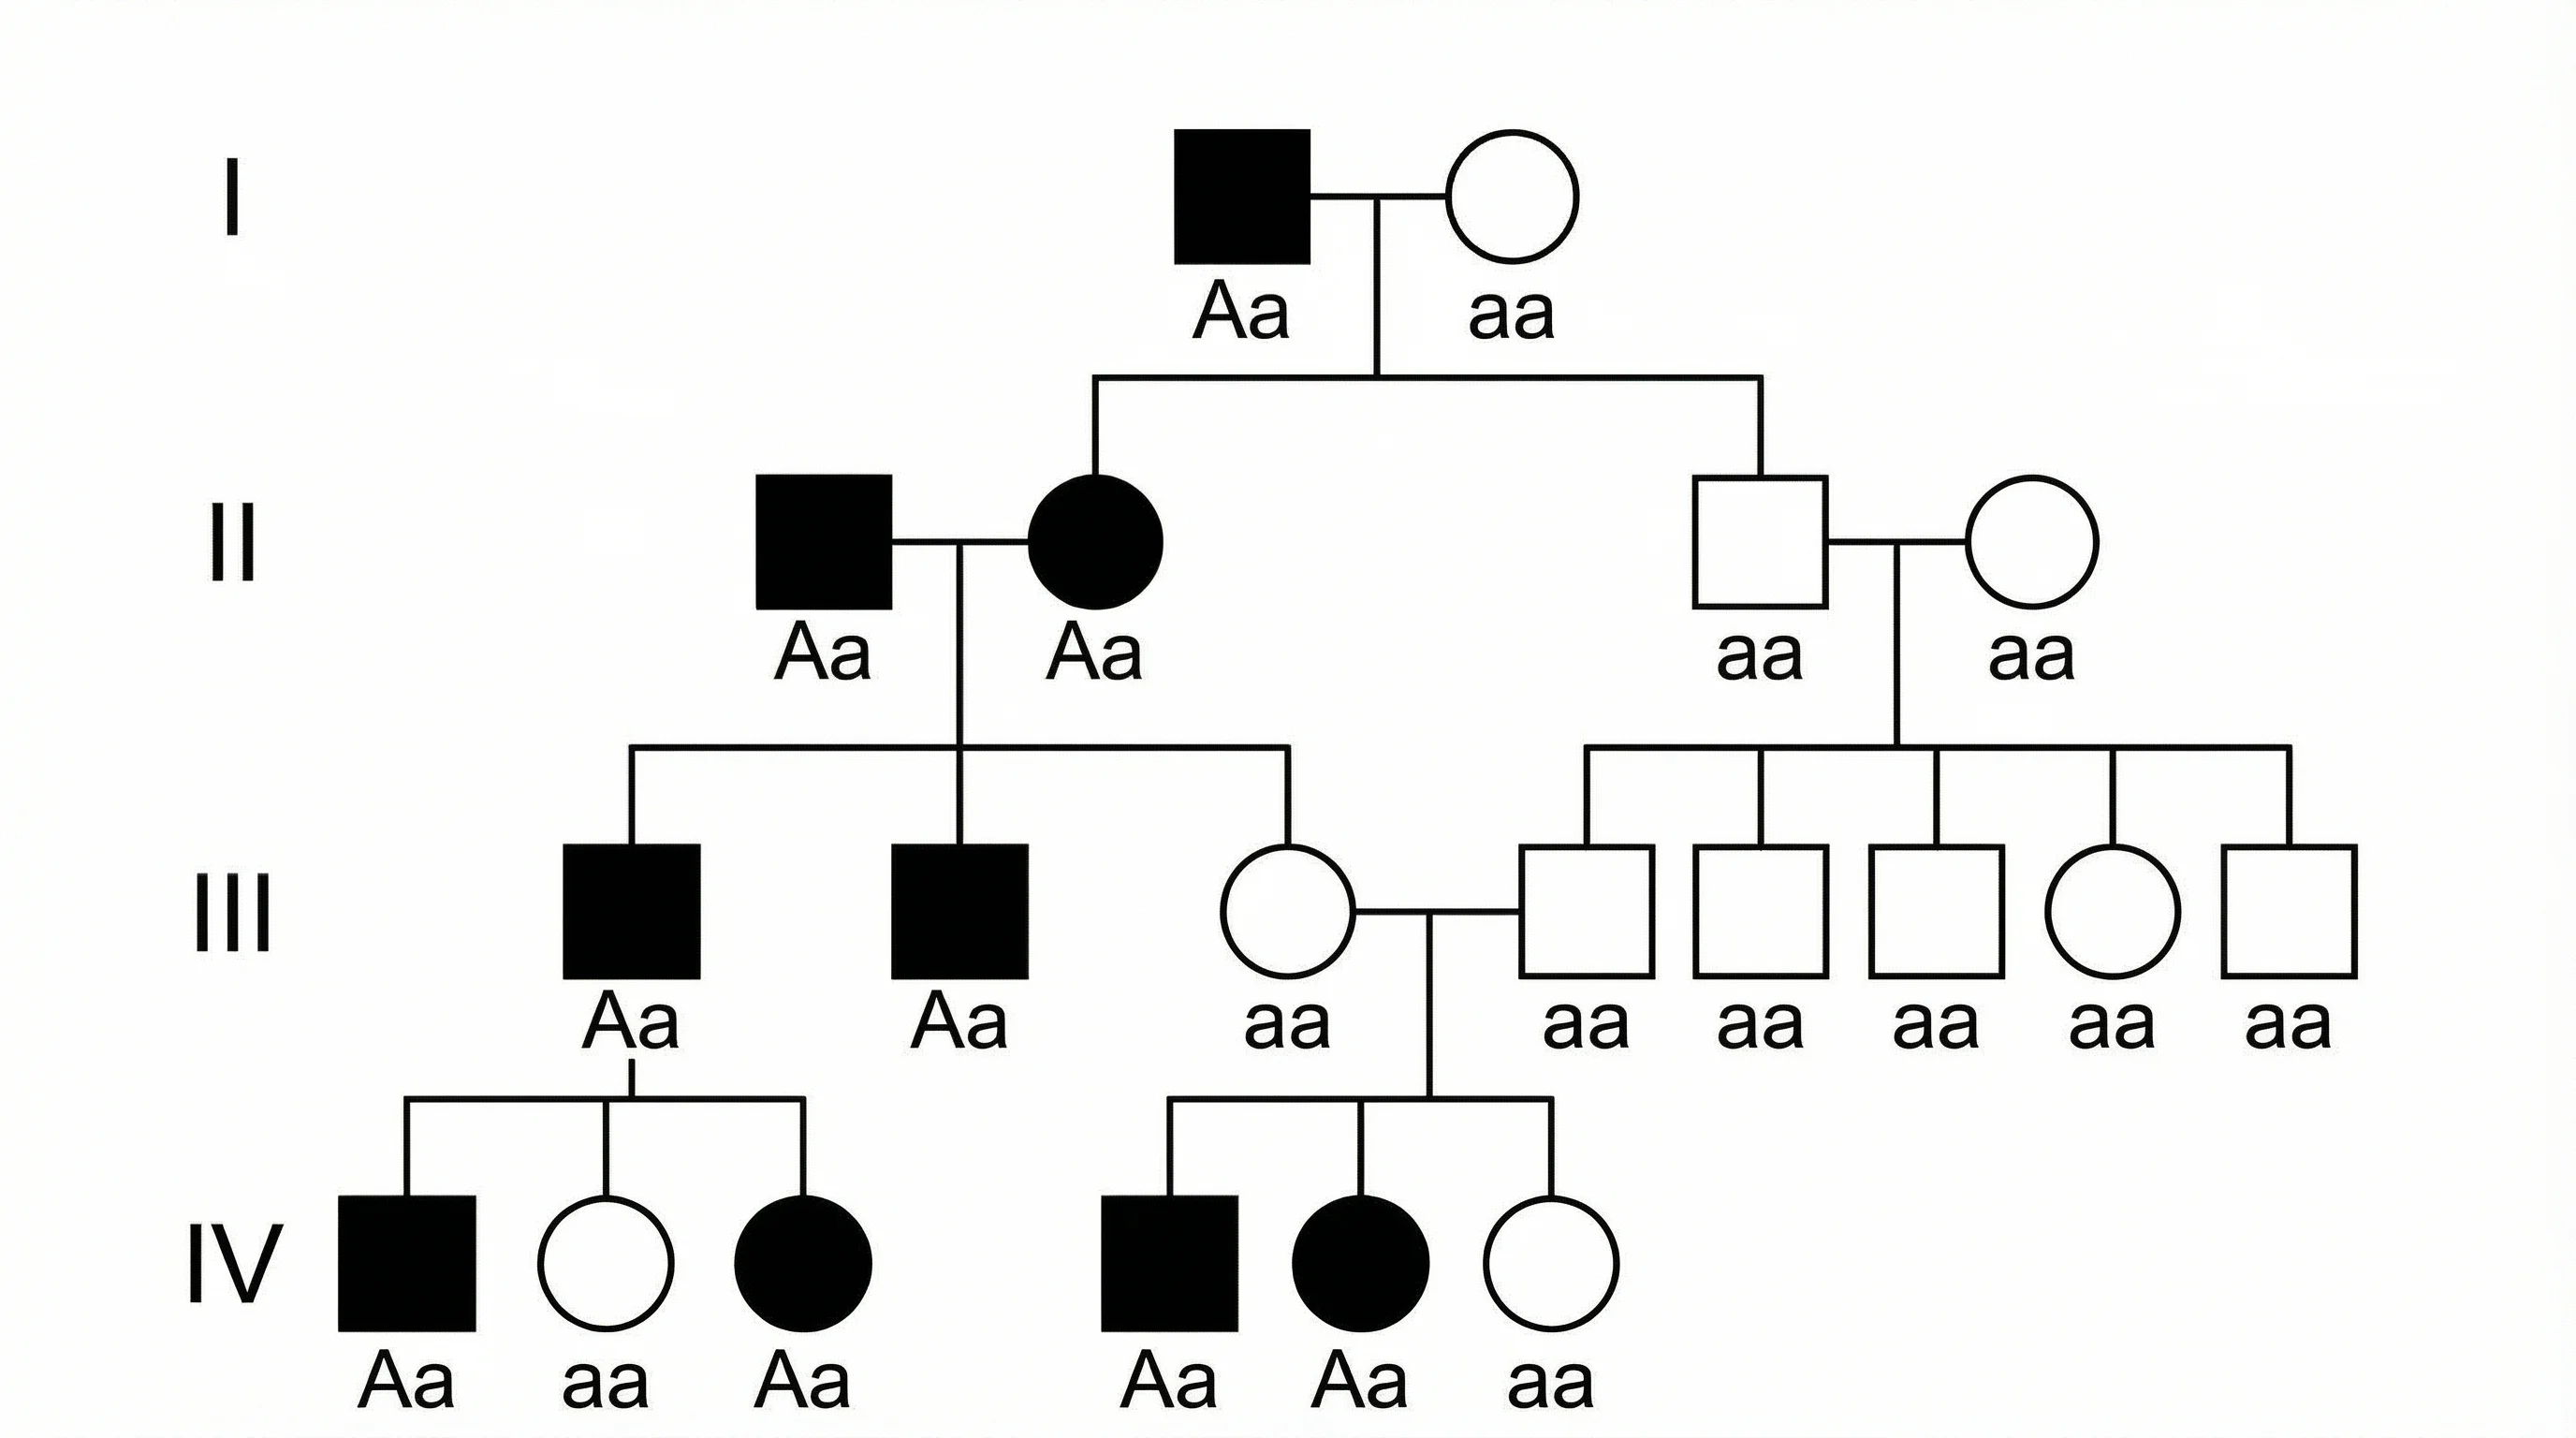
Pedigree Chart Maker
Draw genetic pedigree charts to trace inherited traits and conditions across generations.
 Education
Mind Map Generator
Turn a topic into an organized mind map with branches and sub-branches.
 Research
Tree Diagram Generator
Build tree diagrams for hierarchies, decisions, and branching relationships.