Workflow Diagram Generator for Process & Research Flows
Turn a plain-English description of a process into a clean workflow diagram — steps, sequence, decision points, and handoffs laid out for you. Built for research methodologies, business processes, and project plans, with 2K/4K and SVG export.
Workflow Diagram Generator
Free to try ·
Your workflow diagram will appear here
Describe the steps and sequence of your process
Workflow Diagram Examples
Process flows, research methodologies, and pipelines generated by AI
Research Methodology Workflow
A research workflow from literature review and hypothesis to data collection, analysis, and publication.
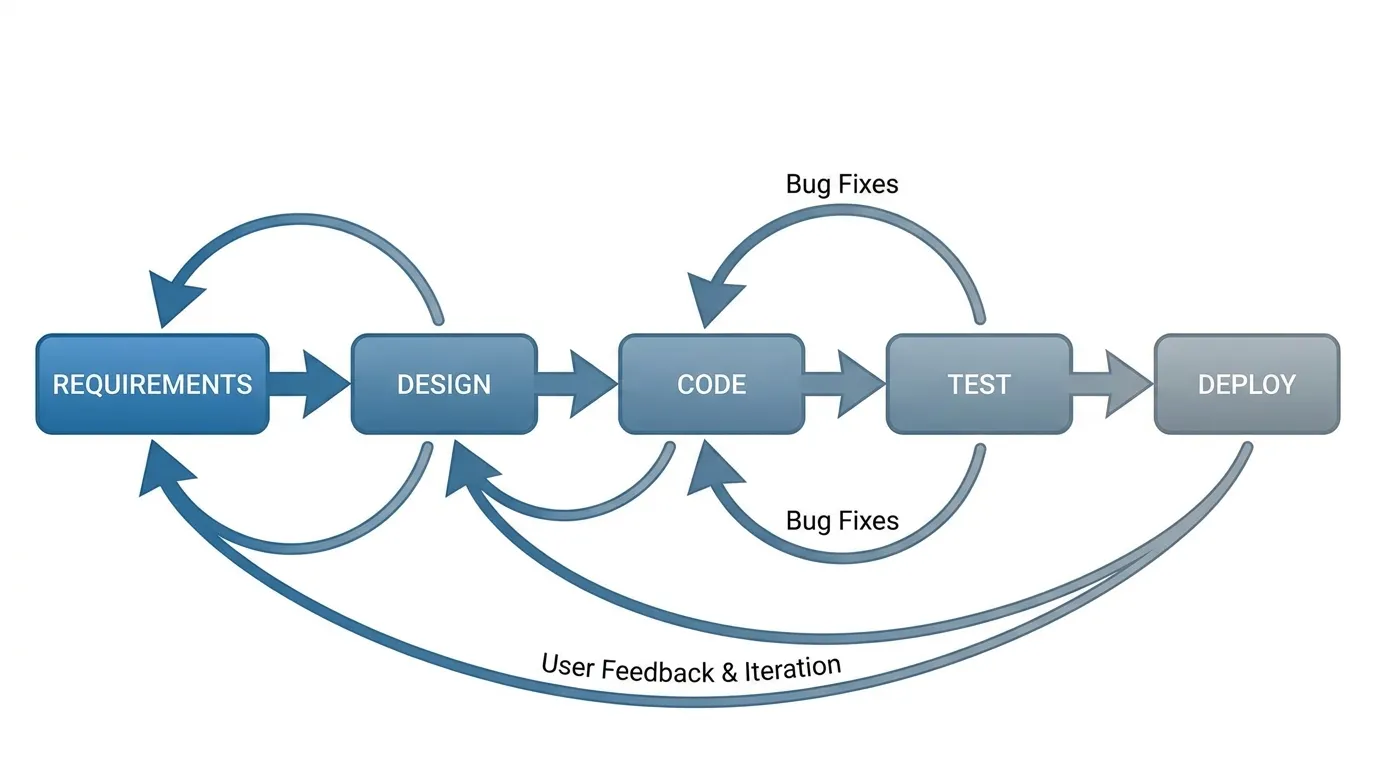
Software Development Lifecycle
An SDLC process flow with requirements, design, build, test, and deploy, plus feedback loops back to earlier steps.
Clinical Trial Phases
A clinical research process map with decision gates at each phase, from screening to approval.
Data Analysis Pipeline
A data-science pipeline showing the ordered stages from raw data to a deployed model.
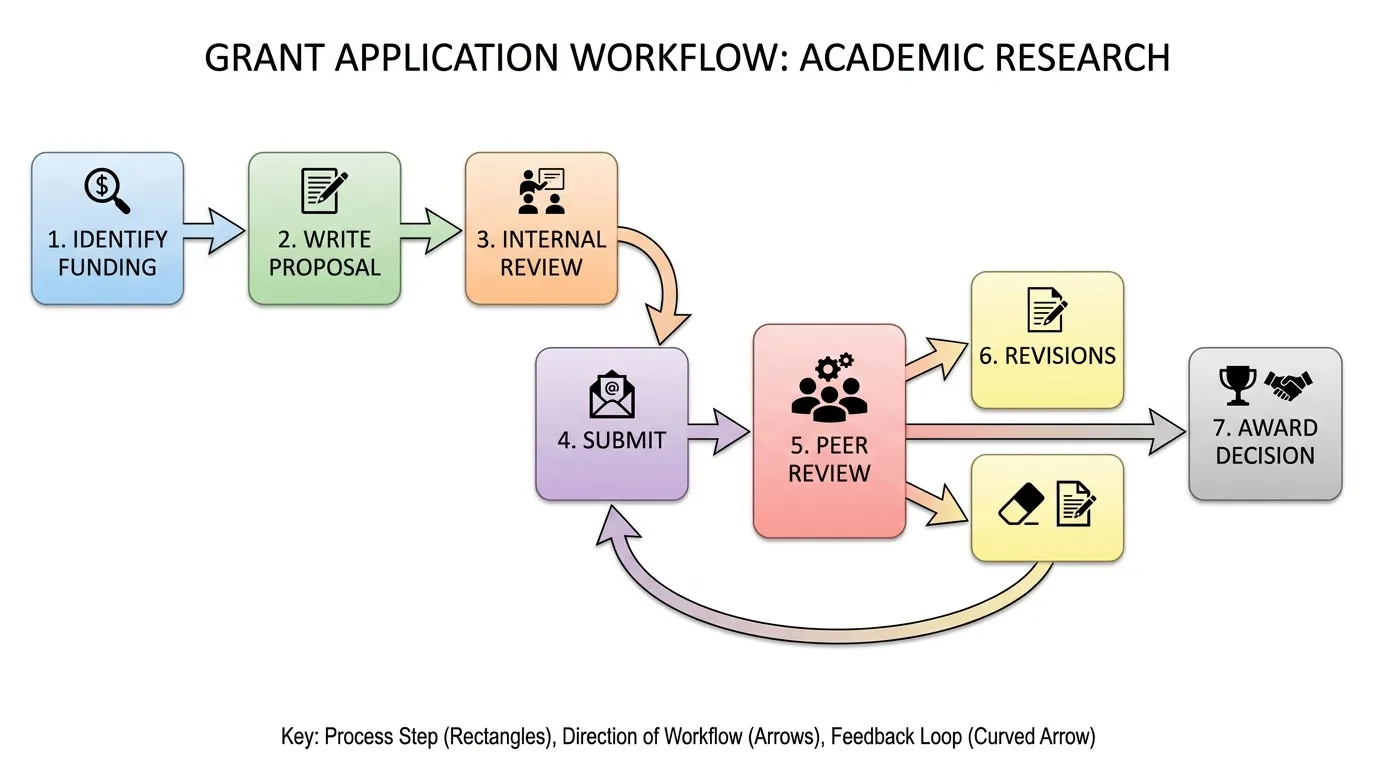
Grant Application Process
A funding process flow with the internal review and submission handoffs that decide an award.
Experiment Protocol Flow
A lab protocol laid out step by step, from sample prep and treatment groups to measurement and analysis.
What is a workflow diagram?
A workflow diagram is a picture of a process: it shows the steps or tasks involved, the order they happen in, and how work passes from one step to the next. Each box is a task or stage, the arrows show the sequence and direction of the flow, and decision points mark where the process can branch. Where a plain list of steps leaves the relationships implicit, a workflow diagram makes the sequence, the parallel paths, and the handoffs visible at a glance — which is exactly what this generator draws from a short description of your process.
Workflow diagram vs flowchart vs process map
- Workflow diagram: emphasizes the sequence of tasks and who hands off to whom — best for documenting how a process actually runs end to end.
- Flowchart: emphasizes decision logic, with yes/no branches and standardized shapes — best for algorithms and conditional steps where the next action depends on a test.
- Process map (or swimlane diagram): a workflow diagram organized by role or department, so you can see which person, team, or system owns each step.
- They overlap, and many real diagrams blend them. If correctness of branching logic matters most, lean toward a flowchart; if showing the order and ownership of work matters most, a workflow diagram or process map is the better fit.
Steps, sequence, and handoffs
Three things make a workflow readable. Steps are the individual tasks, named with an action verb (Collect, Review, Approve) so each box says what happens. Sequence is the order, shown by arrows reading left-to-right or top-to-bottom; this is where you place decision points, parallel branches, and feedback loops for iterative work. Handoffs are the moments work passes between people, teams, or systems — the points where things most often stall or get lost. A good workflow diagram makes all three explicit, and this tool keeps the layout clean so the primary path stays obvious and the branches read as branches.
Research workflow diagrams
A research workflow diagram shows the methodology of a study as an ordered process: literature review, identifying a gap, forming a hypothesis, designing the experiment, collecting and analyzing data, and writing up and publishing — usually with feedback loops where analysis sends you back to refine the design. The same approach fits an experiment protocol, a data-analysis pipeline, a clinical-trial phase diagram, or a grant-application process. Because reviewers and committees expect the methods section to be reproducible, a clear research workflow diagram is a fast way to communicate exactly what was done and in what order, which is why it is common in journal papers, theses, and dissertations.
Business and project process workflows
Outside research, workflow diagrams document the processes a team runs every day: onboarding a new hire, an approval or sign-off chain, order fulfillment, an incident-response runbook, or a release and CI/CD pipeline. Project workflows such as sprint cycles and review-and-deploy flows fall into the same category. Mapping a business process this way exposes bottlenecks, duplicated steps, and unclear handoffs — and gives everyone a shared reference for how the work is supposed to flow, which is the first step toward improving or automating it.
How to make a workflow diagram from a description
- Write out your process as steps, ideally in order — a quick "A then B then C" list, or a sentence describing the flow, is enough to start.
- Note the branches: any decision points (and what each path leads to), parallel tasks that happen at the same time, and feedback loops that return to an earlier step.
- Paste that description into the generator and create the diagram; the AI reads the sequence and lays out connected, labeled steps with a clear start and end.
- Review and refine the wording of your prompt if a step is missing or mislabeled, then export at 2K or 4K — or as an SVG vector — to drop straight into a paper, slide, or process doc.
Frequently Asked Questions
Related Diagram Tools
 Visualization
AI Flowchart Generator
Build flowcharts with decision logic and conditional yes/no branches.
 Visualization
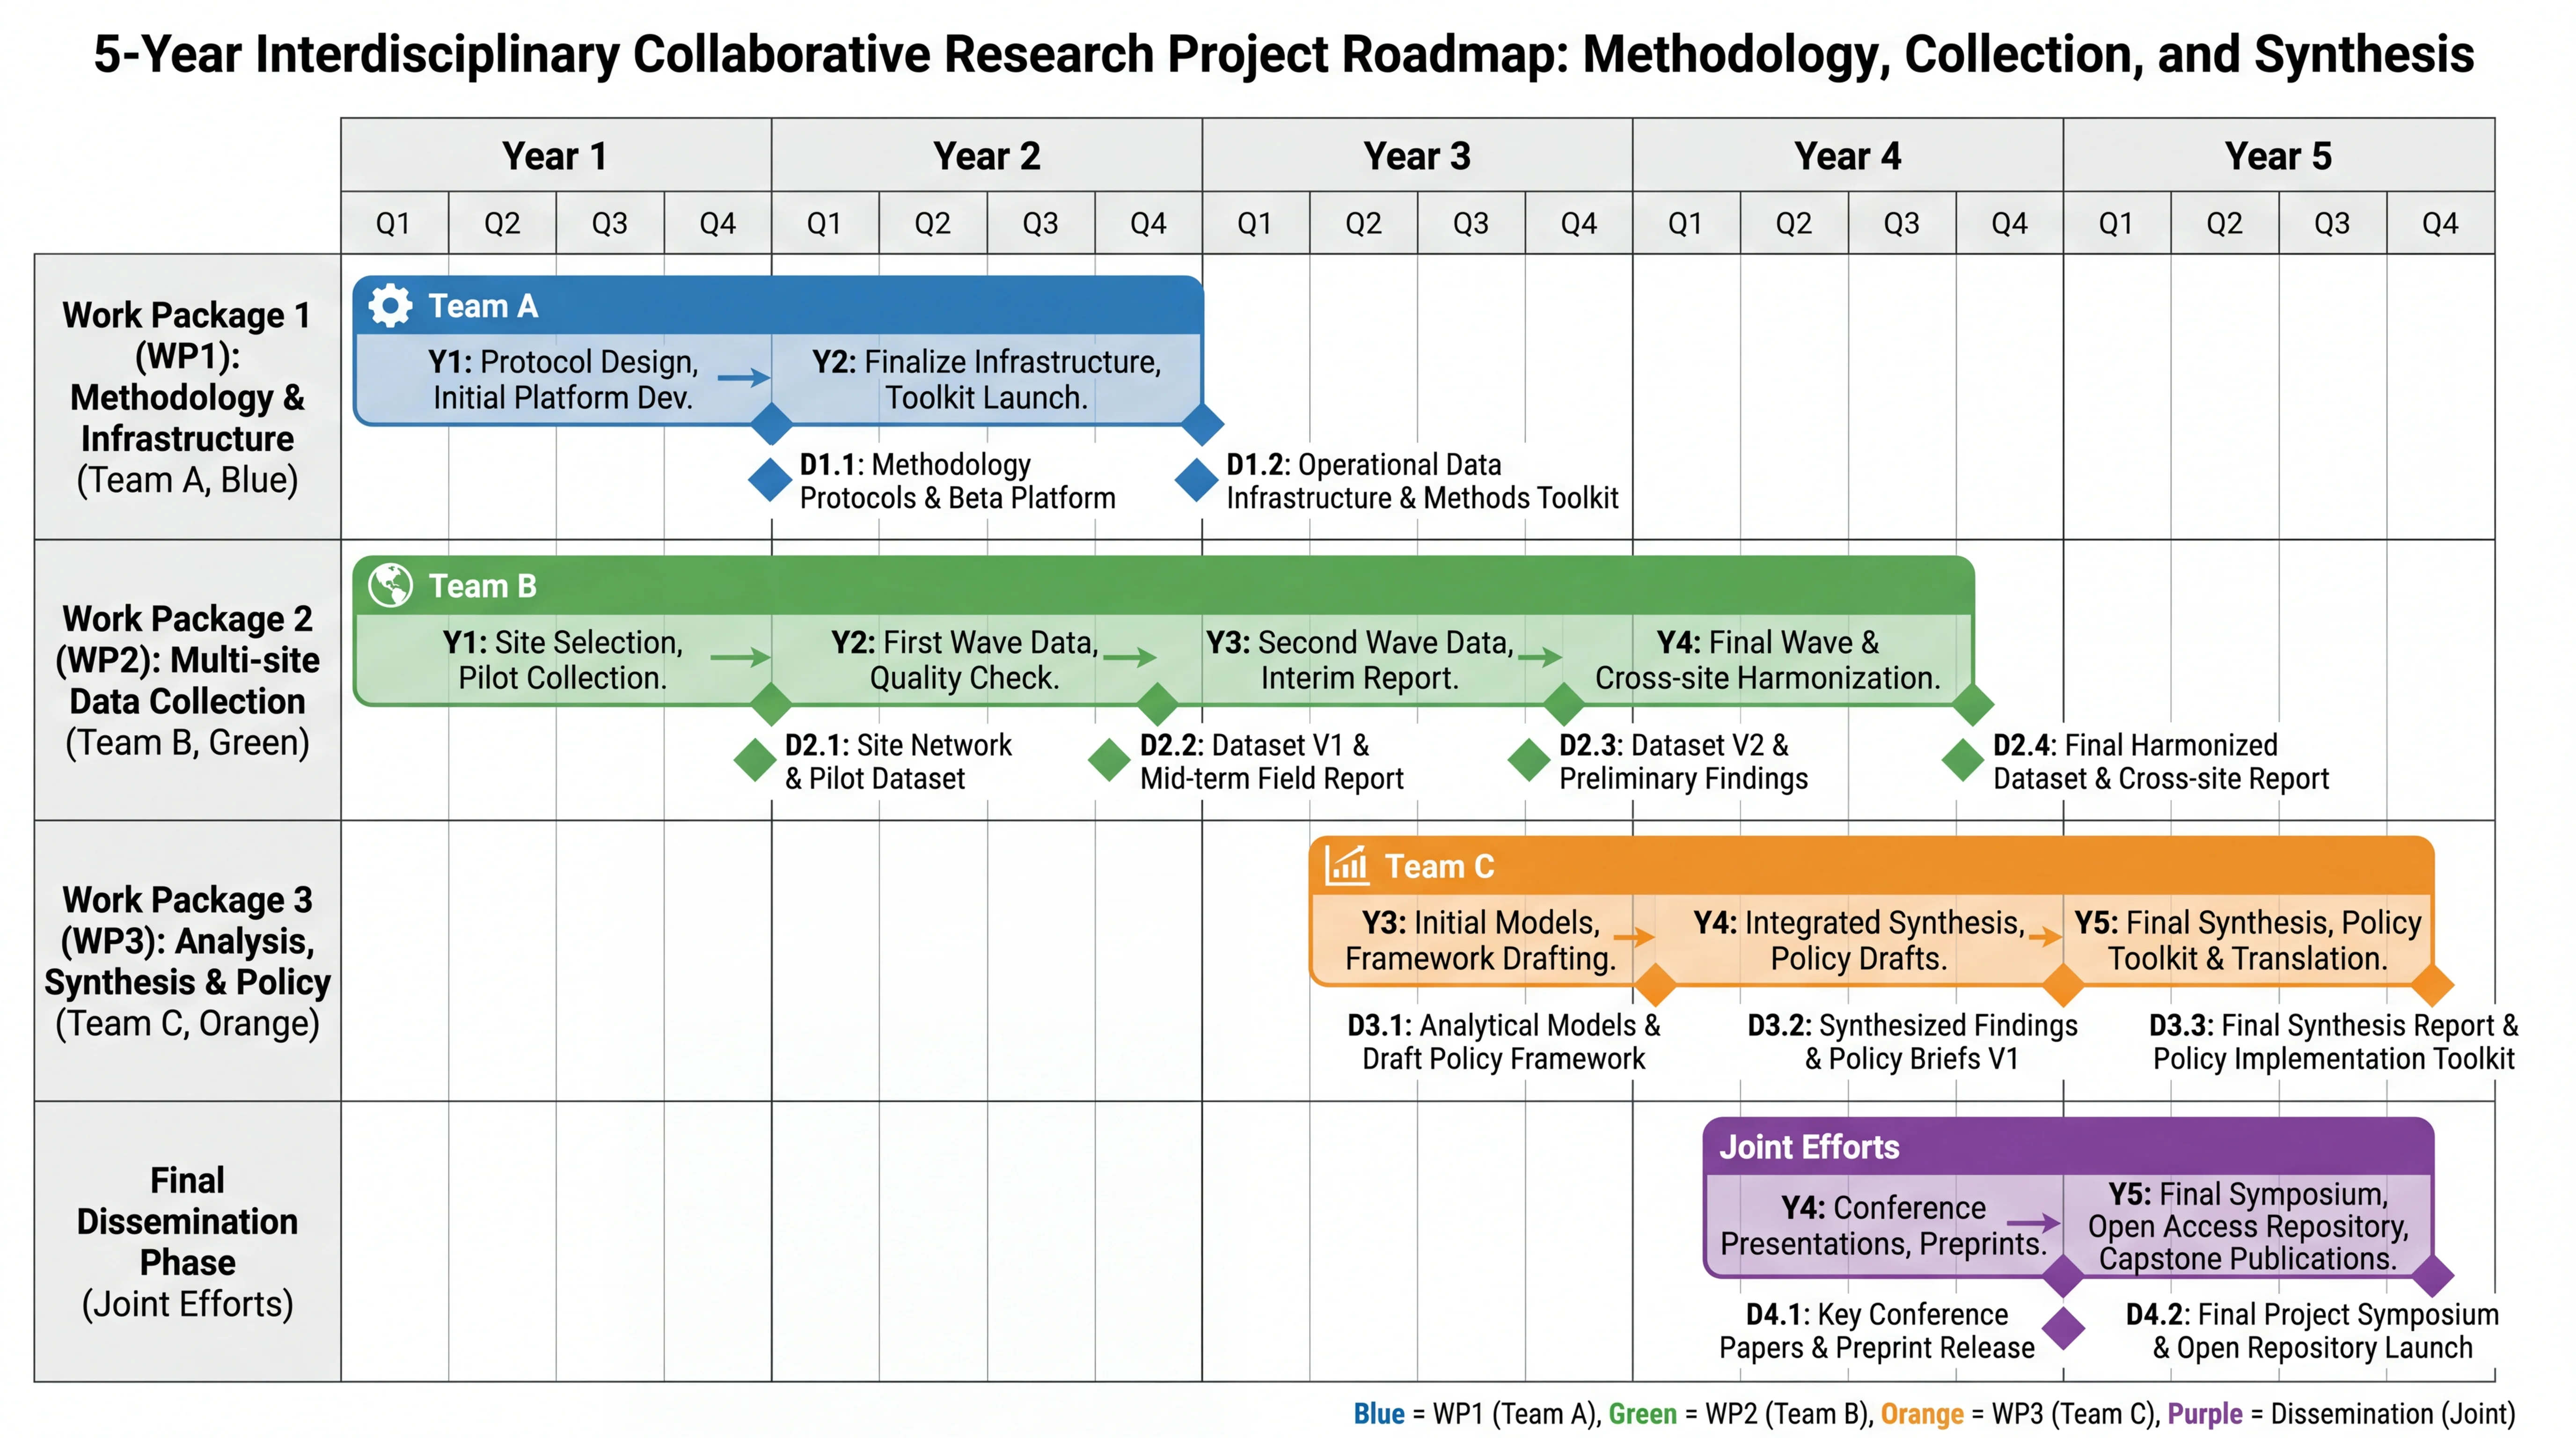
Gantt Chart Maker
Turn a project plan into a timeline with tasks, durations, and dependencies.
 Visualization
Mind Map Generator
Organize ideas and topics into a branching mind map with sub-branches.