Swimlane Diagram Generator for Cross-Functional Processes
Make a swimlane diagram online in seconds. Describe a process and the AI lays it out as a cross-functional flowchart — lanes for each role or department, process steps, and handoffs that cross between lanes — then export, free.
Generate Swimlane Diagram
Free to try ·
Your swimlane diagram will appear here
Describe your process and departments above
Swimlane Diagram Examples
Cross-functional flowcharts with lanes, process steps, and handoffs
HR Onboarding Swimlane
Four lanes — HR, IT, Manager, and New Employee — show exactly who does what across onboarding.
Order Fulfillment Swimlane
A cross-functional flow from order to delivery, with each handoff crossing from one lane to the next.
Software Development Swimlane
Maps the SDLC across Product, Design, Engineering, and QA — including the loop back for bug fixes.
Incident Response Swimlane
Shows escalation paths — the moment a ticket hands off from Helpdesk to Engineering is unmistakable.
Patient Admission Swimlane
A healthcare process where the lanes make accountability between Reception, Nurse, and Doctor explicit.
Procurement Swimlane
Tracks a purchase request across Requester, Purchasing, Finance, and Vendor, approvals included.
What is a swimlane diagram?
A swimlane diagram is a process flowchart divided into lanes, where each lane belongs to one actor — a role, a person, a team, or a department. The process steps sit inside the lane of whoever performs them, so a single glance answers the question every flowchart should: who does what. The lanes are what set it apart from an ordinary flowchart. A plain flowchart shows the sequence of steps; a swimlane diagram shows the sequence and the ownership at the same time. That makes it the standard way to document business processes that involve more than one team, because the boundaries between teams become visible instead of buried in the boxes.
Lanes: horizontal or vertical
The lanes (sometimes called channels or pools) are the parallel bands that carry the diagram. They can run horizontally — stacked rows, with the process flowing left to right — or vertically — side-by-side columns, with the process flowing top to bottom. Horizontal lanes are the most common for business processes and read naturally as a timeline. Vertical lanes work well when you have many actors or want the diagram to fit a portrait page. Either way, each lane is labeled with its owner, and every step you draw belongs to exactly one lane. This generator lets you describe the lanes you need in plain language and arranges the steps inside them for you.
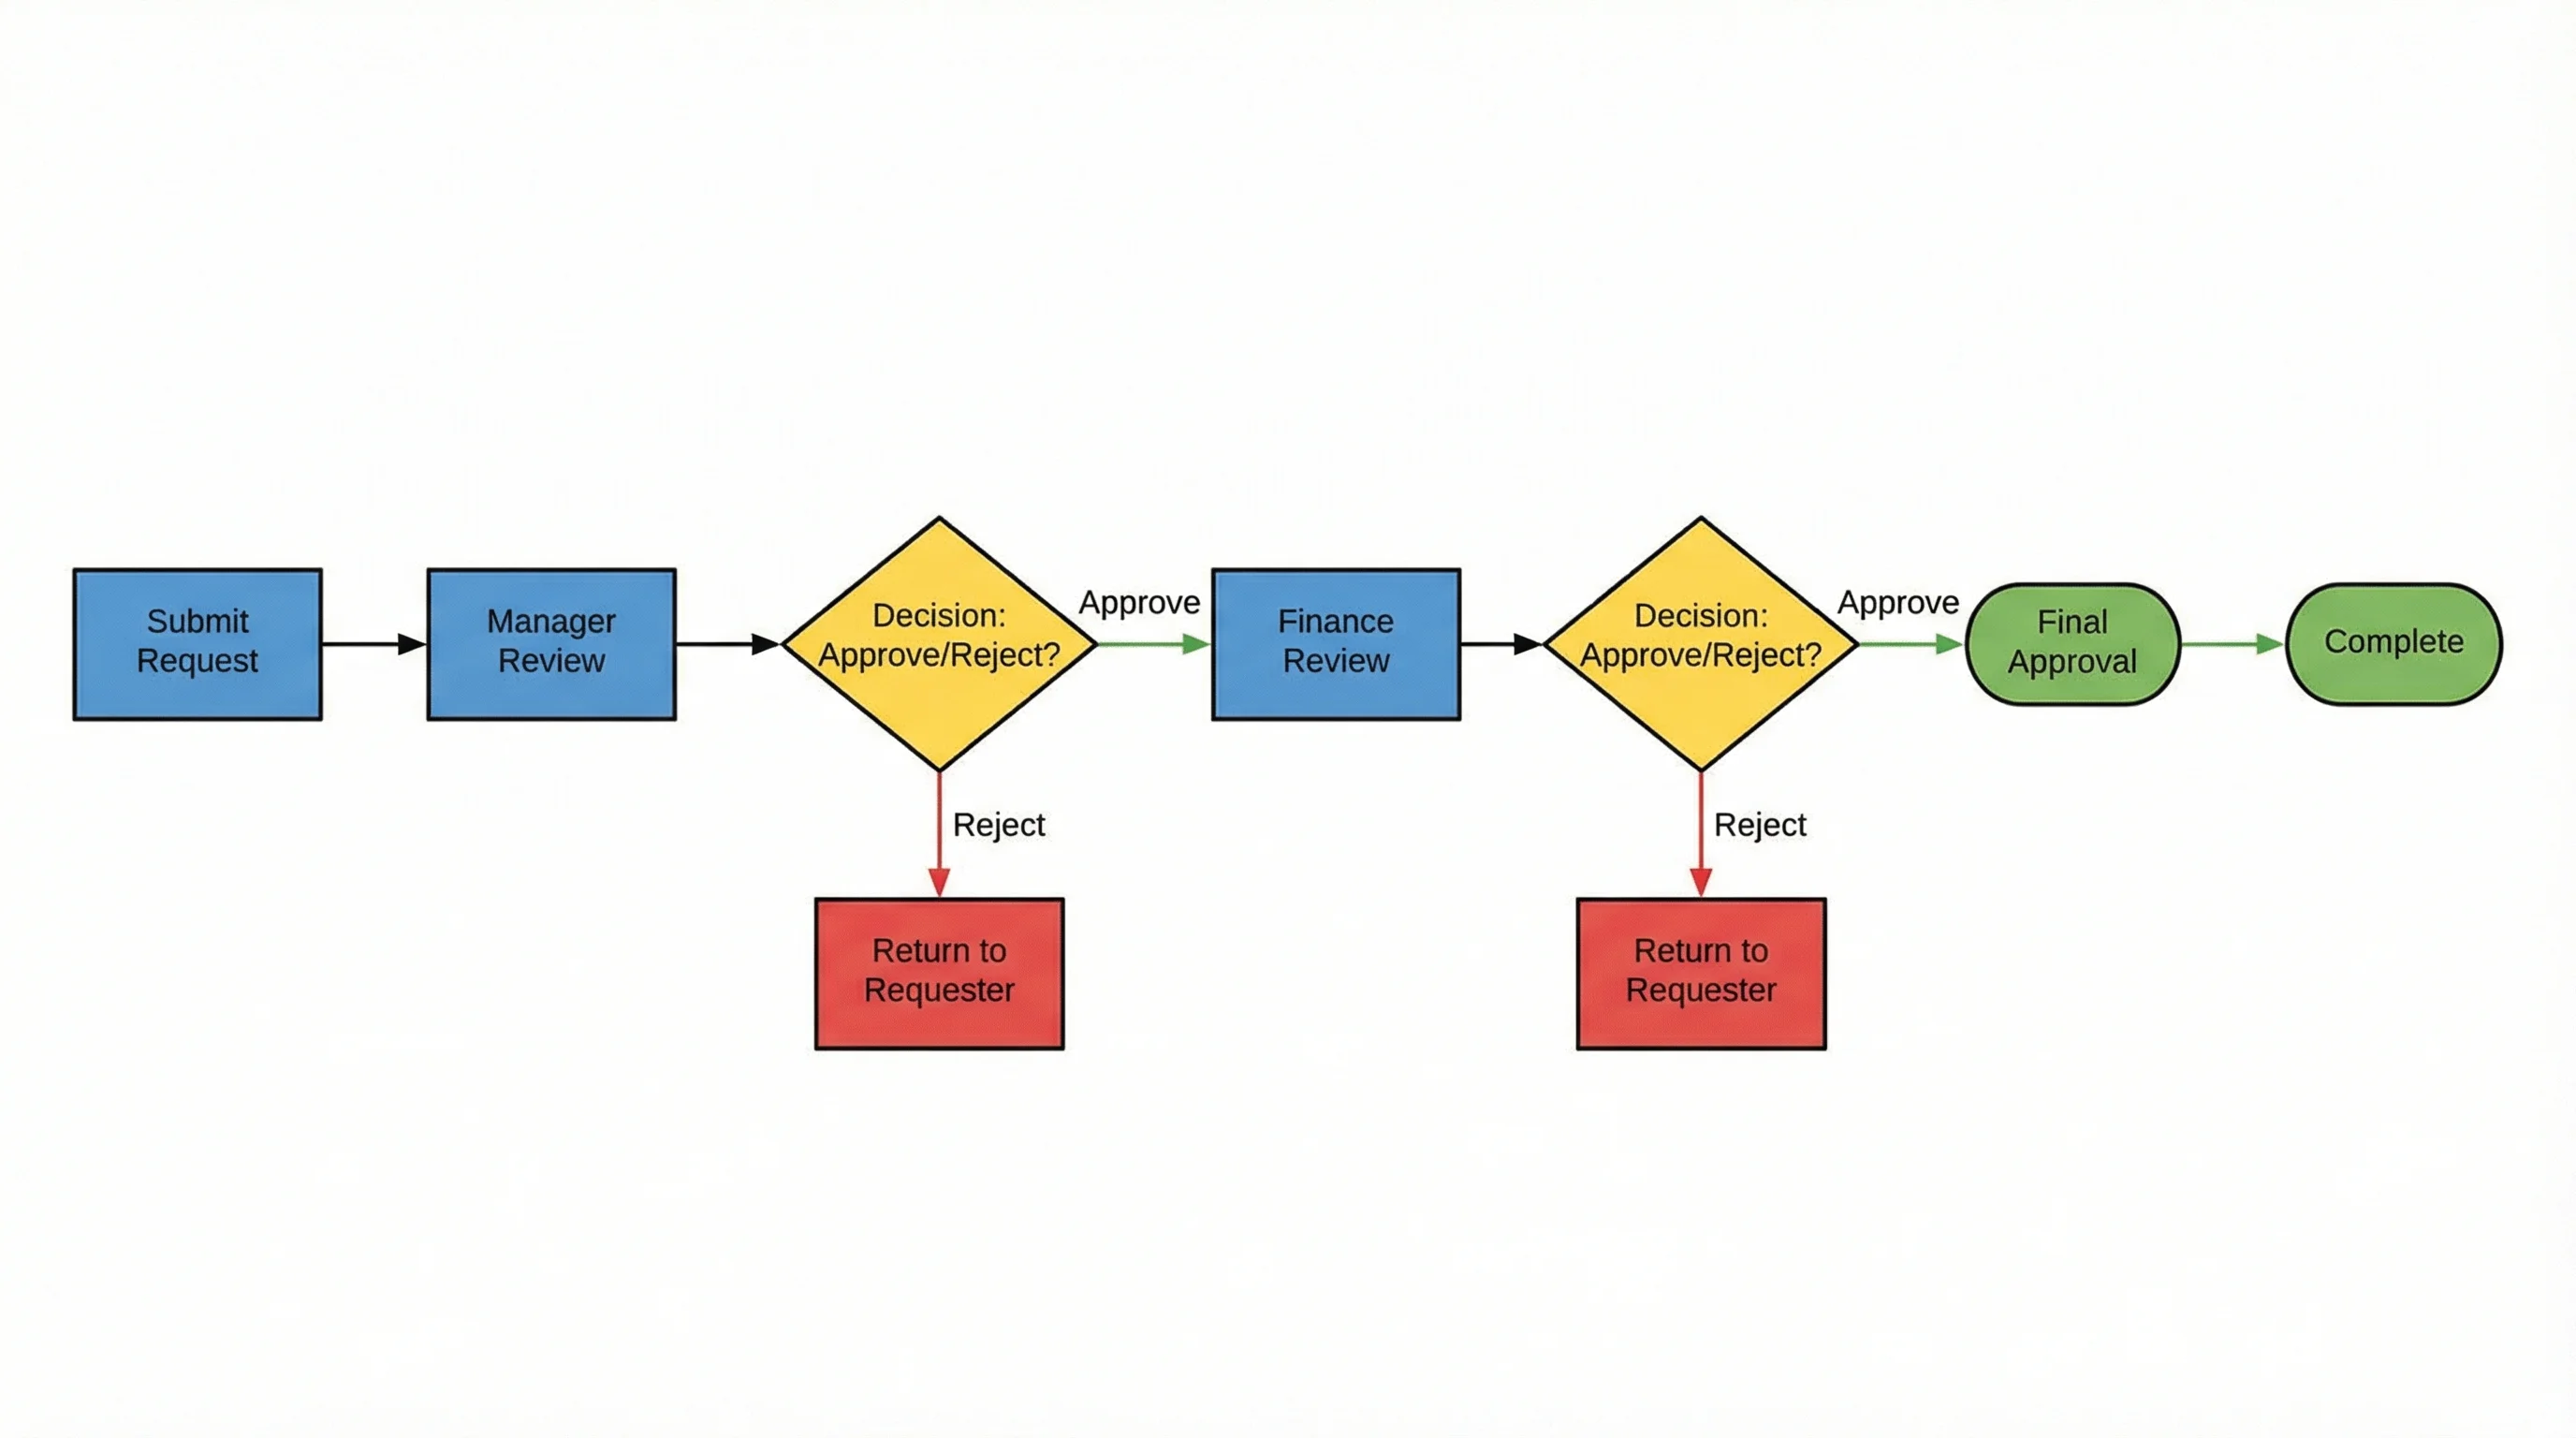
Process steps and decision points
Inside the lanes you place the building blocks of any flowchart. A rounded box marks the start and end of the process. Rectangles are the action steps — "create offer letter," "verify insurance," "approve budget." A diamond is a decision point that splits the flow into branches, such as a yes/no approval or a pass/fail check. Arrows connect the steps in order and show the direction of flow. Because each step lives in a lane, the diagram captures both the task and its owner with no extra labeling. The result is a process map that a new team member can follow without anyone explaining it.
Handoffs: where the work crosses lanes
The most valuable part of a swimlane diagram is the handoff — the arrow that leaves one lane and enters another. Each crossing line is a point where responsibility transfers from one team to the next, and those transitions are where real processes stall: a request waits for sign-off, a ticket sits in a queue, a document bounces back for rework. By making every handoff a visible line between lanes, the diagram exposes bottlenecks, redundant approvals, and dropped balls that a single-column flowchart would hide. When you are mapping a process to improve it, count the lane crossings — fewer handoffs usually means a faster, cleaner process.
When to use a swimlane diagram
Reach for a swimlane diagram whenever a process spans more than one role or department and you need to show who is accountable for each step. Common uses include cross-functional business processes (order fulfillment, procurement, hiring), software and product workflows (the SDLC, bug triage, release management), service operations (customer support escalation, IT incident response), and regulated procedures in healthcare or finance where accountability must be documented. It is also the right tool for process improvement work — mapping the current state, spotting handoff delays, and designing a leaner future state that everyone can agree on.
How to make a swimlane diagram
- List the actors — the roles, teams, or departments involved — and turn each one into a lane.
- Identify the process steps and place each step in the lane of whoever performs it.
- Connect the steps in order with arrows, adding decision diamonds wherever the flow branches.
- Draw the handoffs as arrows that cross from one lane into another, then review those crossings for delays.
- Or skip the manual work: describe your process and its lanes in the generator above and let the AI lay out the swimlane flowchart for you.
Frequently Asked Questions
Related Diagram Tools
 Diagrams
AI Flowchart Generator
Turn any process into a clean flowchart with steps, decisions, and connectors.
 Diagrams
Text to Diagram Generator
Describe a diagram in plain English and generate it instantly — no drawing.
 Diagrams
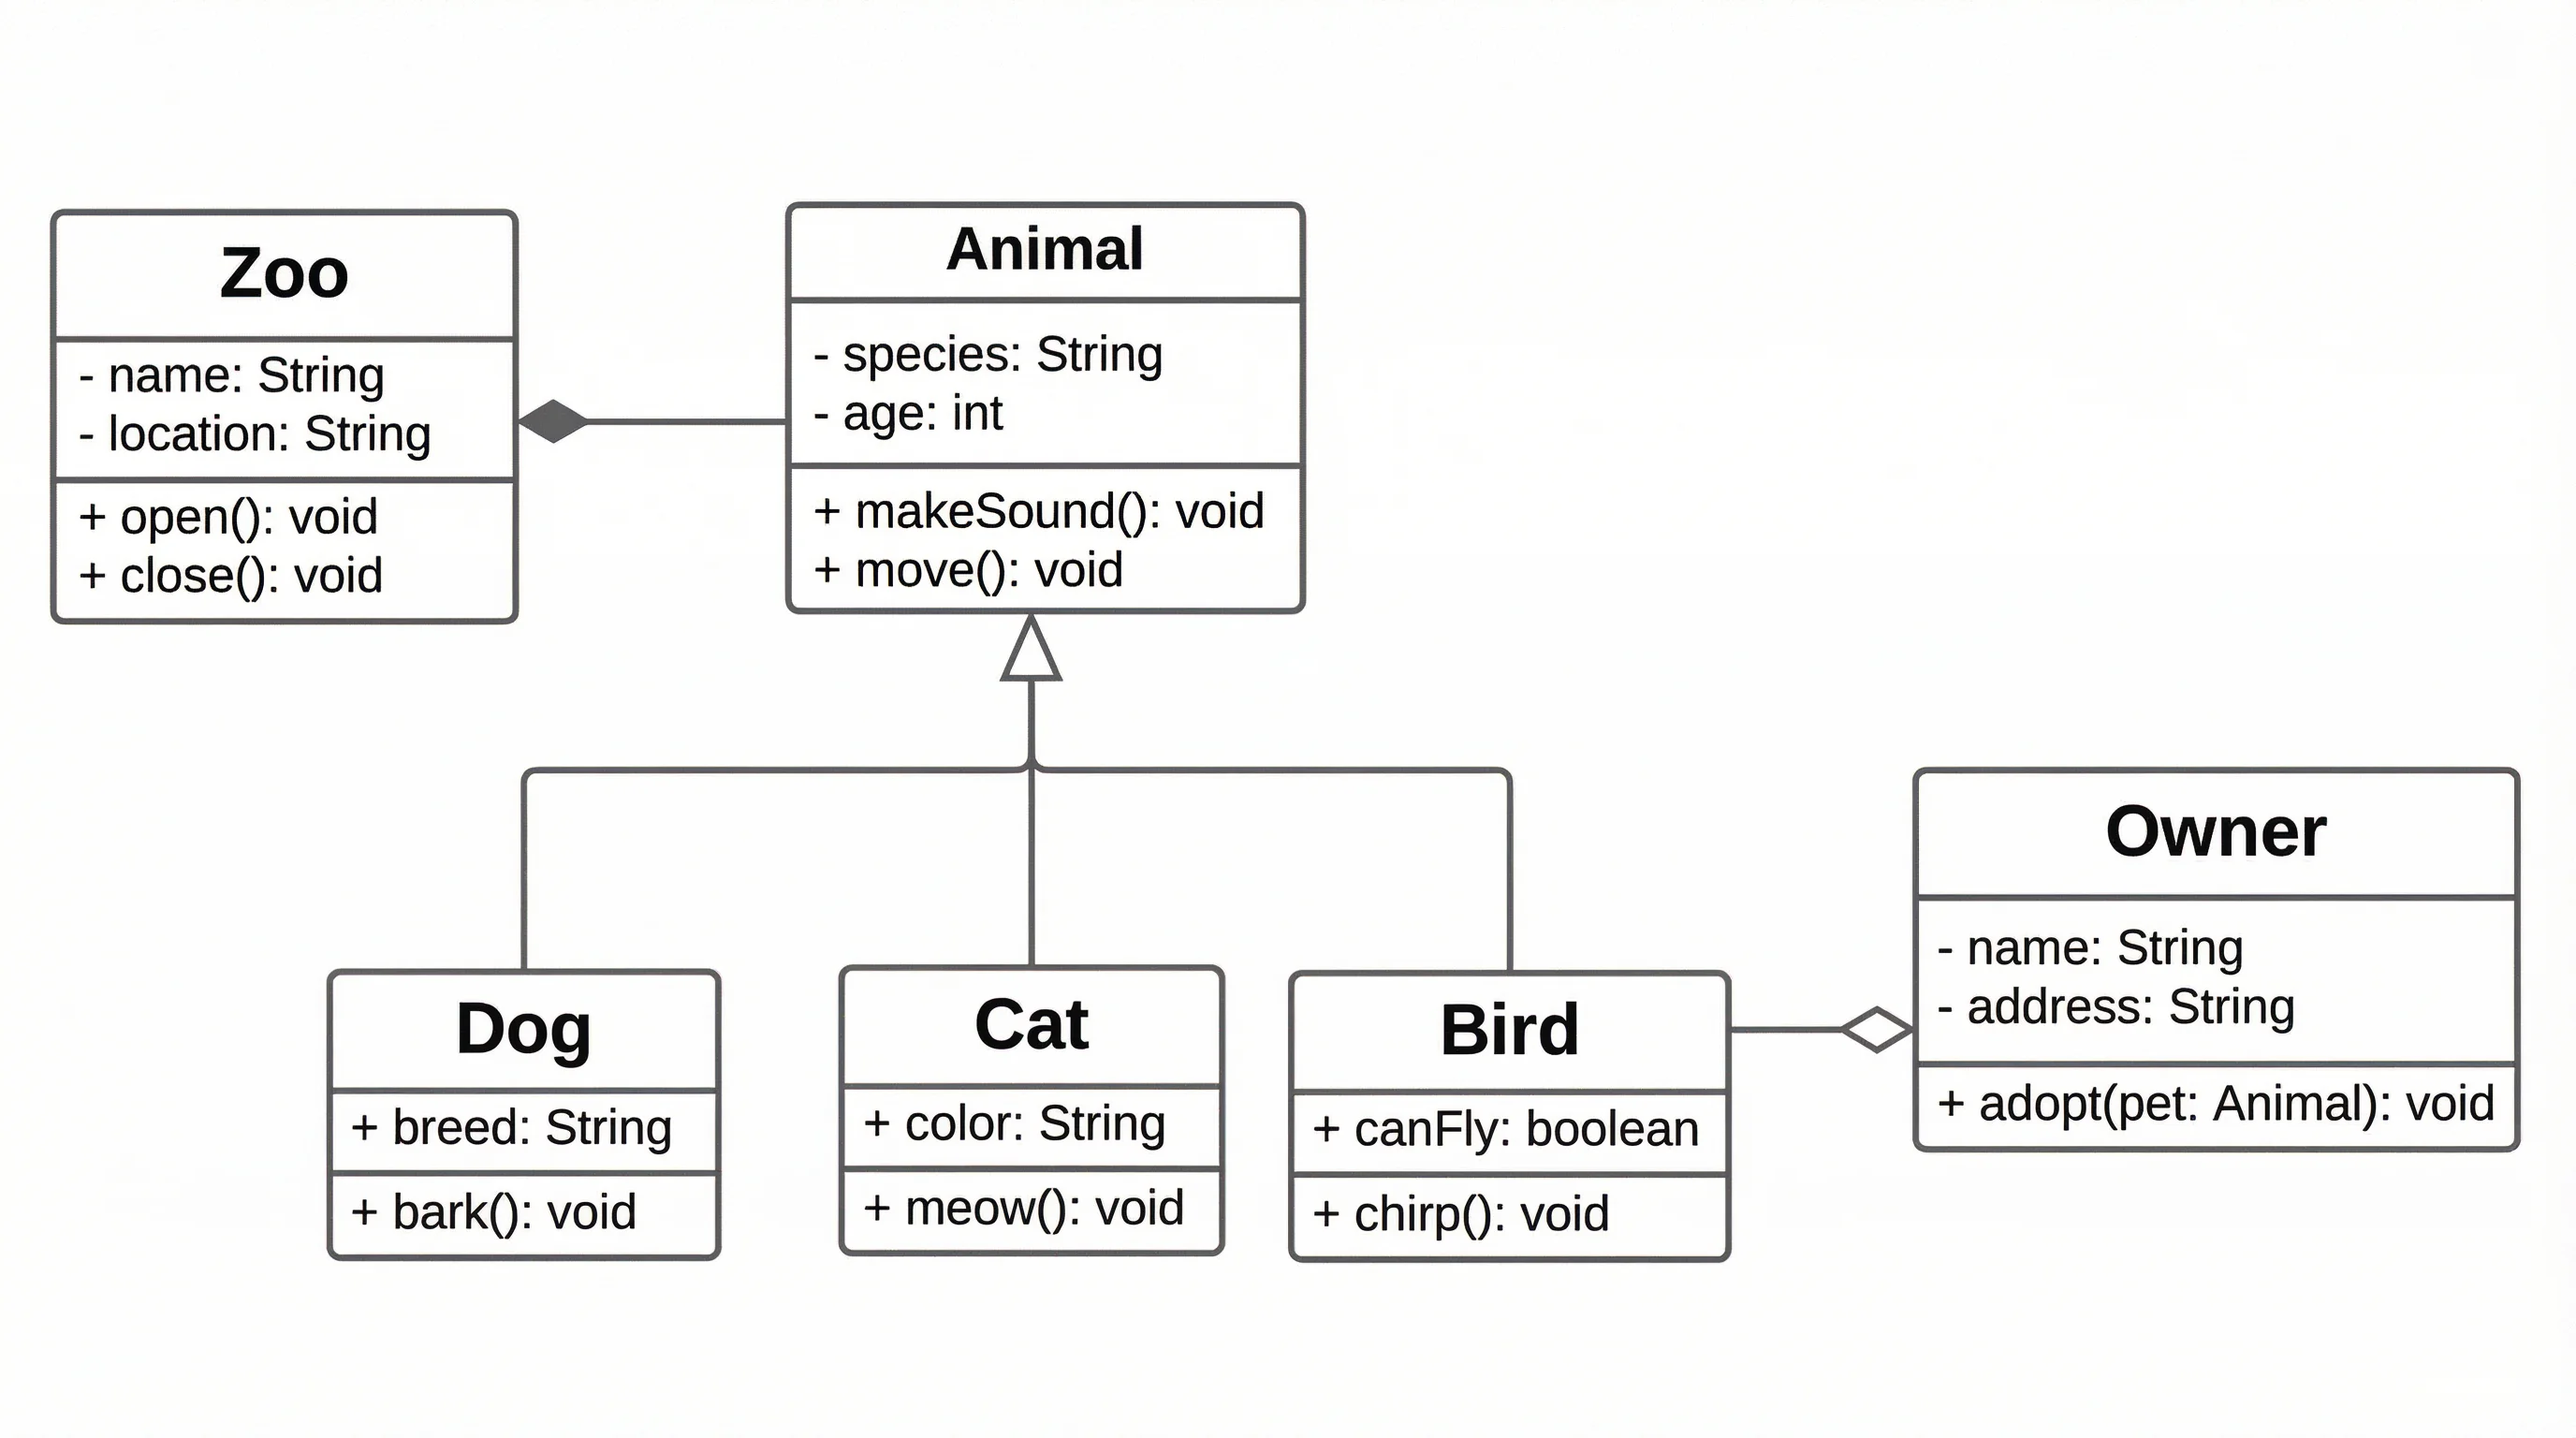
UML Diagram Generator
Create UML class, sequence, and use case diagrams for software design.