Flywheel Diagram Maker with Friction Points
List the stages that feed each other and see the loop drawn as you type, with curved arrows, a center label and optional friction markers. Paste a list or CSV, then export SVG, PNG, CSV or text.
Flywheel stages
List the stages in the order they feed each other. The last stage feeds the first. 3 to 8 stages.
Press Enter in a stage name to add the next stage. A friction point adds a red marker on the arrow leaving that stage.
List: one stage per line, optionally numbered or bulleted. Add a note and a friction point after a | (or a tab, so a spreadsheet row pastes straight in): Stage | note | friction. CSV: header stage,note,friction.
6 stages, 3 with a friction point. Arrows run clockwise from stage 1.
What is a flywheel diagram?
A flywheel diagram draws a business, product or program as a loop of stages. Each stage pushes the next one, and the last stage pushes the first, so the effort you put in is not used up in one pass but adds to the speed of the next. The idea comes from Jim Collins, who describes it in Good to Great as the process of "relentlessly pushing a giant, heavy flywheel, turn upon turn, building momentum until a point of breakthrough, and beyond" (jimcollins.com). In his 2019 monograph Turning the Flywheel he asks leaders to capture the drivers of momentum and how they link together.
The maker above draws the loop as you type: stage cards on a ring, curved arrows between them, a label in the center, and an optional red marker wherever a hand-off slows down. This page is about the business and strategy flywheel; if you came for the engine part, see the note on mechanical flywheels further down.
How to make a flywheel diagram
- 1
Name the engine in the center
Use the company, product, school or team the flywheel belongs to. It sits in the hub so anyone who sees the diagram knows what is turning.
- 2
List the stages in the order they feed each other
Type one stage per row. Each stage should cause the next one: "more customers" leads to "more sellers", not just "comes before". Use the arrows buttons to reorder, and the plus button to add a stage after the current one.
- 3
Close the loop
The last stage must feed the first. If you cannot explain why the last stage makes the first one easier, the loop is not a flywheel yet; it is a line.
- 4
Add a short note to each stage
One sentence on how the stage pushes the next one. The notes are optional but they are what turns a ring of labels into an explanation.
- 5
Mark the friction points
Where does the hand-off from one stage to the next slow down? Type it in the friction field and a red marker appears on that arrow, with the text on the card.
- 6
Pick colors and export
Choose a color set, then download SVG or PNG for a slide, CSV for a spreadsheet, or the list to keep the flywheel as editable text. Paste the list or CSV back later to carry on editing.
How to find the stages: Collins's method
Staring at a blank wheel is the hard part. In the same strategic tool where he sketches Amazon's loop, Collins gives a six-step process developed with executive teams, summarized here in our words:
- List the replicable successes your enterprise has had.
- List the failures and disappointments, including initiatives that fell far below expectations.
- Compare the two lists: what do they say belongs in the flywheel, and what does not?
- Sketch the loop from the components you found. Decide where it starts, what follows, and how the last stage leads back to the top.
- Draw the whole loop with four to six components. More than six is too complicated, so consolidate.
- Test it against your successes and failures, and adjust until the successes read as outcomes of the flywheel and the disappointments as failures to follow it.
Collins's own key point is to ask "What flywheel actually works for us, and why?", not "What flywheel would we like to have?" The source is his short article A Good to Great Strategic Tool (PDF, hosted by a third party), and he writes more about the idea on the Turning the Flywheel page of his own site (checked October 2026).
Worked example: the Amazon flywheel
Collins reports that in 2001 Amazon invited him to talk with Jeff Bezos and part of his executive team, and that the team took up the flywheel idea to describe its own business. He quotes Brad Stone's account in The Everything Store: lower prices led to more customer visits; more customers raised the volume of sales and drew commission-paying third-party sellers; that let Amazon get more out of fixed costs such as fulfillment centers and servers; and the greater efficiency let it lower prices further. The diagram below is Collins's five-stage sketch of the essence of that loop, redrawn with the maker. It is his sketch, not Amazon's own diagram, and the loop has changed as the company has grown.
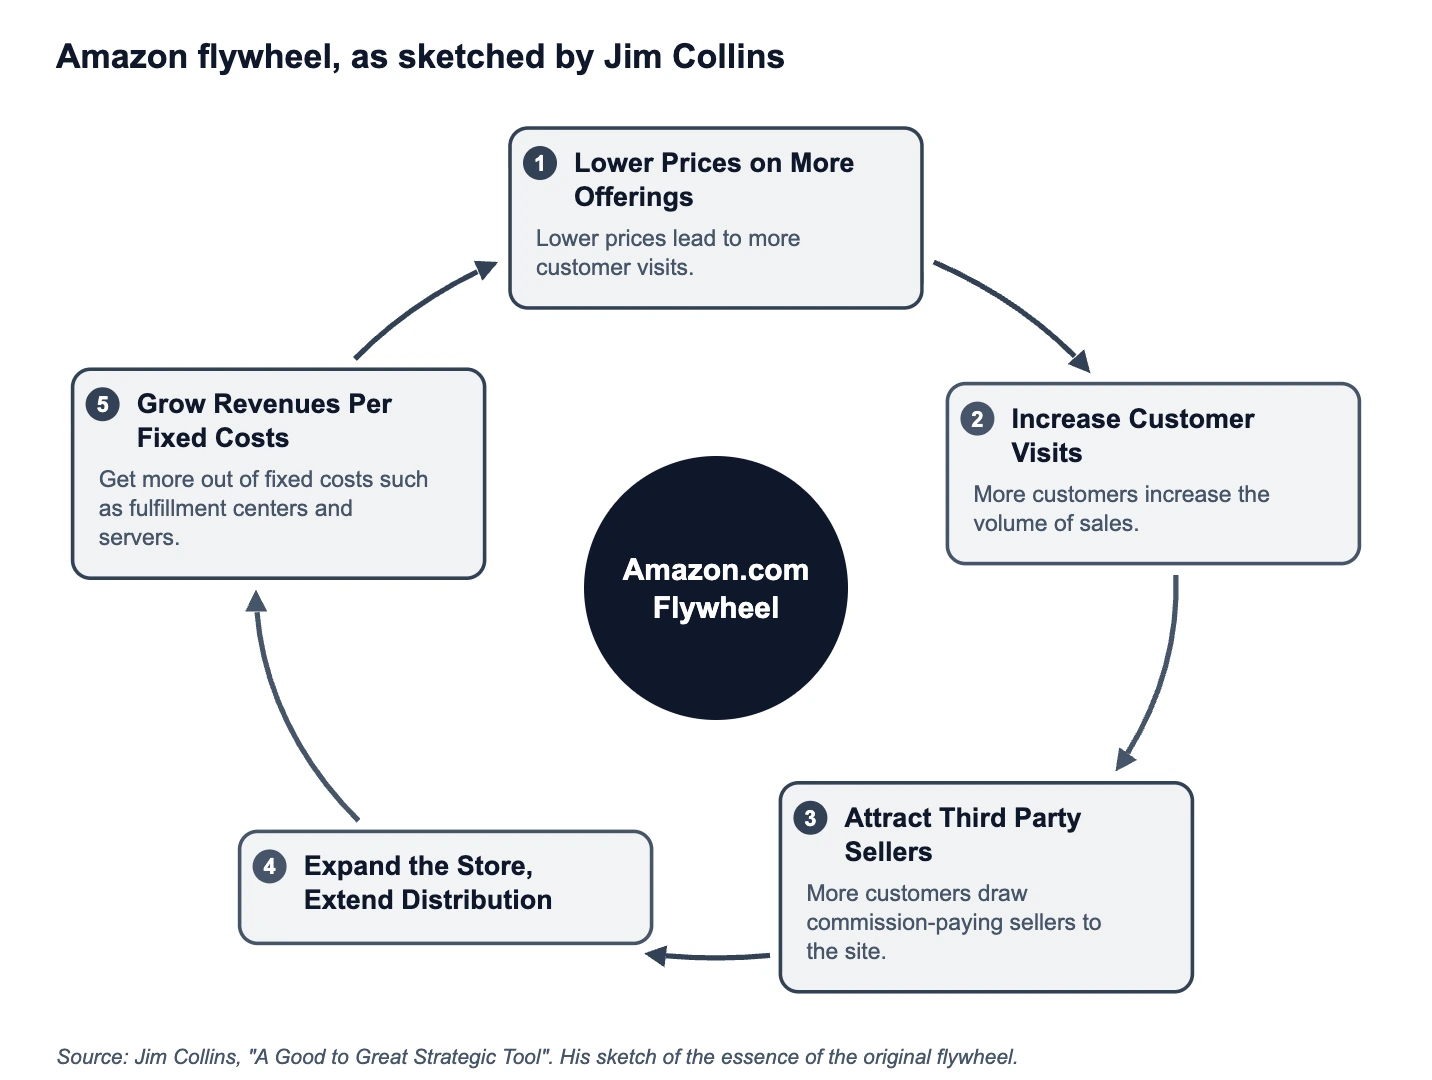
Notice what makes it a flywheel. Every arrow is a cause, and the last stage, more revenue per dollar of fixed cost, is what makes the first stage, lower prices, possible. Pull any one stage forward and the whole loop speeds up.
Flywheel vs funnel, growth loop and process cycle
These pictures are often mixed up, and authors use the names differently. As this tool uses them:
| Model | Shape | Best for |
|---|---|---|
| Flywheel | A closed loop of stages that each push the next; the point is accumulated momentum | Showing why a business or program gets easier to grow as it turns |
| Sales funnel | A one-way sequence that narrows from many prospects to few buyers and ends at purchase | Measuring conversion between steps of one buying journey |
| Growth loop | A specific, measurable cycle in which the output of one pass becomes the input of the next, such as a user inviting another user | Designing and measuring one mechanism in a product |
| Process cycle | A repeating set of steps, such as plan, do, check, act, with no claim that each pass makes the next easier | Documenting a routine that repeats on a schedule |
HubSpot adapted the flywheel to replace the funnel with a loop around attracting, engaging and delighting customers, and uses the word friction for whatever slows the wheel. That is the reason this maker has a friction field on every stage. If you want one linear journey with drop-off numbers, draw a process flow or a SIPOC diagram instead.
From diagram to action
A finished flywheel is most useful as a way to choose what to work on. Mark the friction points, then pick the one that sits on the most important hand-off. If you are unsure why a hand-off stalls, split it with an issue tree; if you have several ways to fix it, compare them in a Pugh matrix. To find candidate stages in the first place, a mind map is a faster start than a blank ring.
Common flywheel diagram mistakes
- Too many stages. Collins advises four to six components; with more than six the loop gets hard to explain and you should consolidate. The tool allows up to eight so you can draft a long version, then merge.
- Stages that only follow each other in time. Each arrow should mean "this feeds that". "Sign up, then use, then pay" is a sequence; "free users invite teammates, which creates paying teams" is a flywheel step.
- Drawing the flywheel you wish you had. Collins asks leaders to capture the flywheel that actually works for them and why, based on repeatable successes, not the one they would like to have.
- Vague labels. "Growth" and "engagement" are not stages. "Customers publish templates" is something that happens and can be checked.
- No loop back. If the last stage does not make the first stage easier or cheaper, the diagram is a funnel with an arrow drawn on it.
- Ignoring friction. Every real flywheel has hand-offs that stall. Marking them turns the diagram from a slogan into a to-do list.
Using it responsibly
The maker draws what you enter. It does not test whether your stages really feed each other or whether the loop matches how your business works. Treat the picture as a way to state and discuss a hypothesis, and check each arrow against your own data before you present it as fact.
Flywheel Diagram Examples
Exact exports from the maker above: one fictional, one redrawn from a published sketch
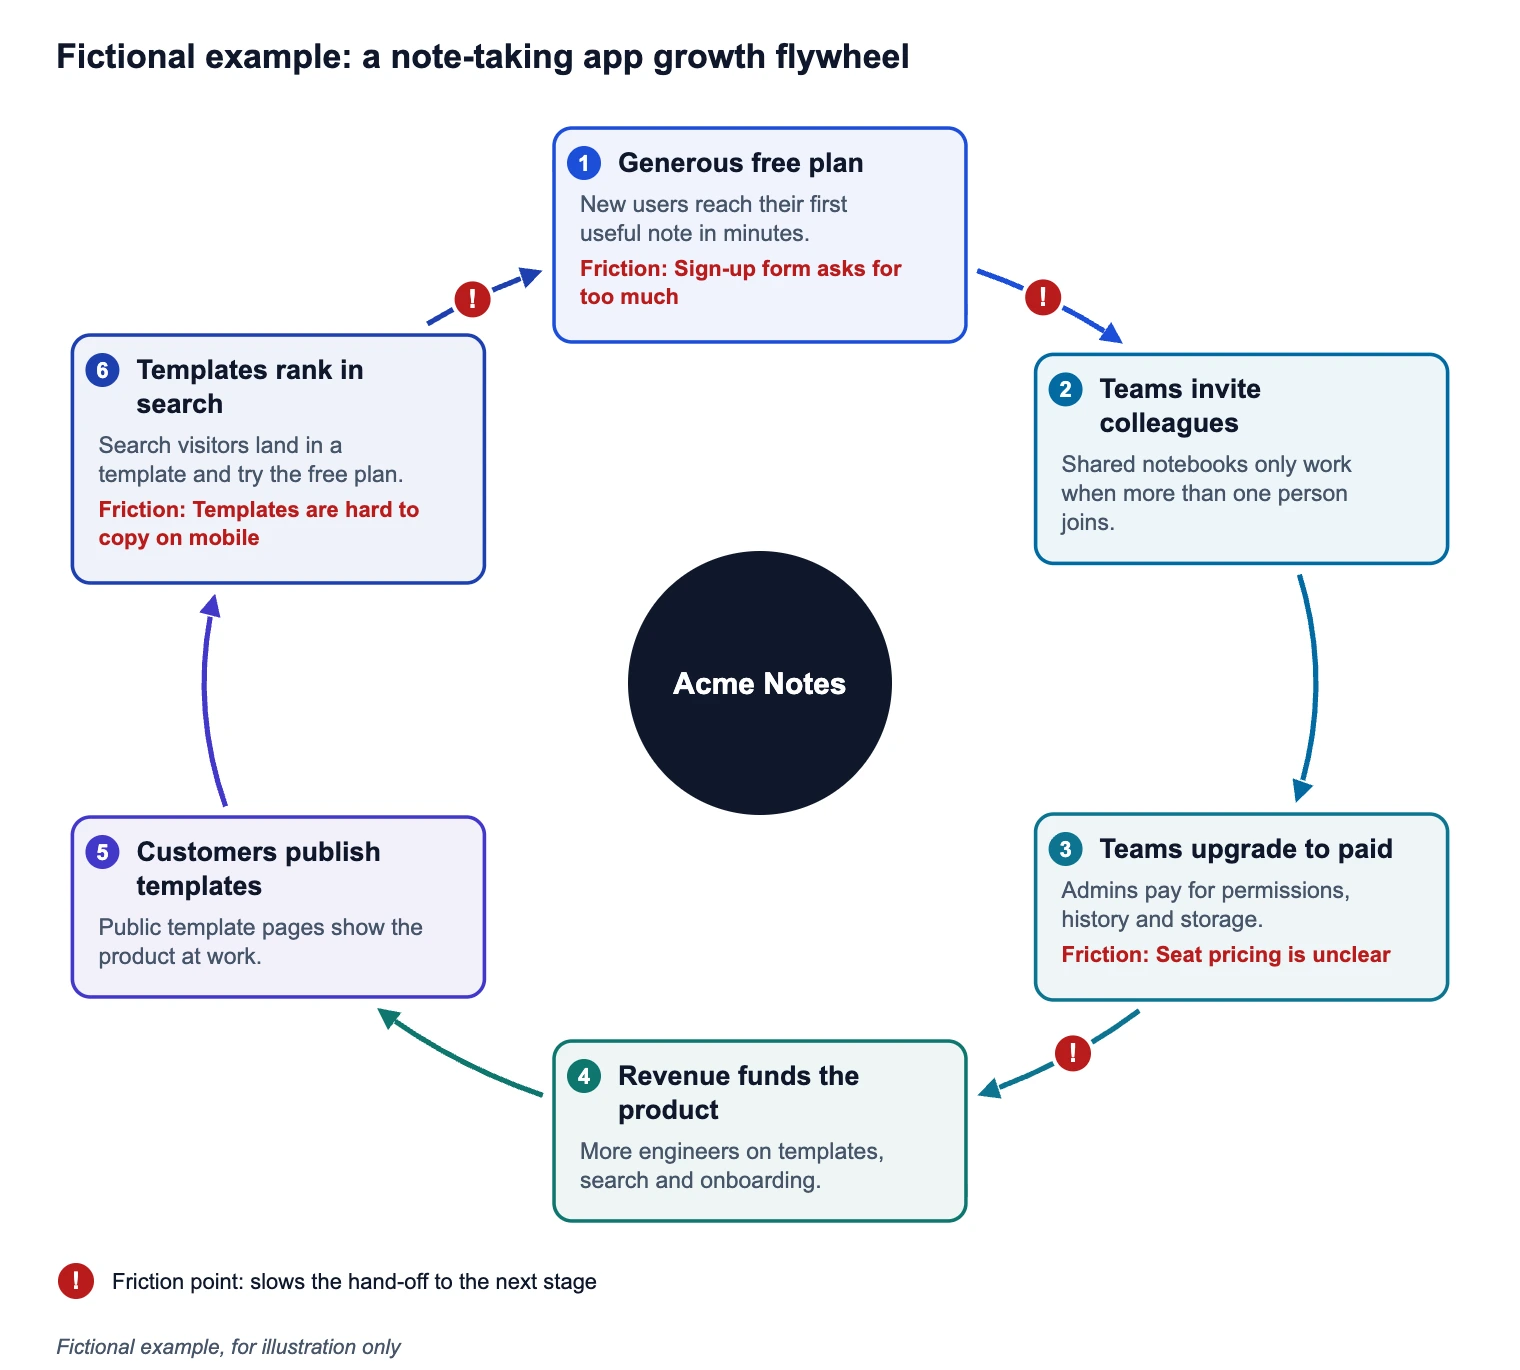
SaaS Growth Flywheel With Friction Points
Exact render from fictional data: six stages, three friction points, ocean colors.
Amazon Flywheel, Redrawn From a Published Sketch
Exact render of Jim Collins's published five-stage sketch, with short notes from the account he quotes.
Is this the same flywheel as the one in an engine?
No. A mechanical flywheel is a heavy rotating disc that stores energy in engines and machines, and its diagrams show parts, torque or energy. This page is about the business and strategy flywheel, a loop of stages in which each stage makes the next easier. The business idea borrows its picture from the machine: a heavy wheel is hard to start and easy to keep turning.
Where do the examples come from?
The note-taking app is fictional, written for this page. The Amazon diagram follows the sketch of the original Amazon flywheel that Jim Collins published in "A Good to Great Strategic Tool" (2017), and the short notes paraphrase the account of the same loop by Brad Stone that Collins quotes there. Collins describes his sketches as his own take on each flywheel and as illustrative, not as the companies' own diagrams. Sources checked October 2026.
Frequently Asked Questions
Related Problem-Solving Tools
 Business
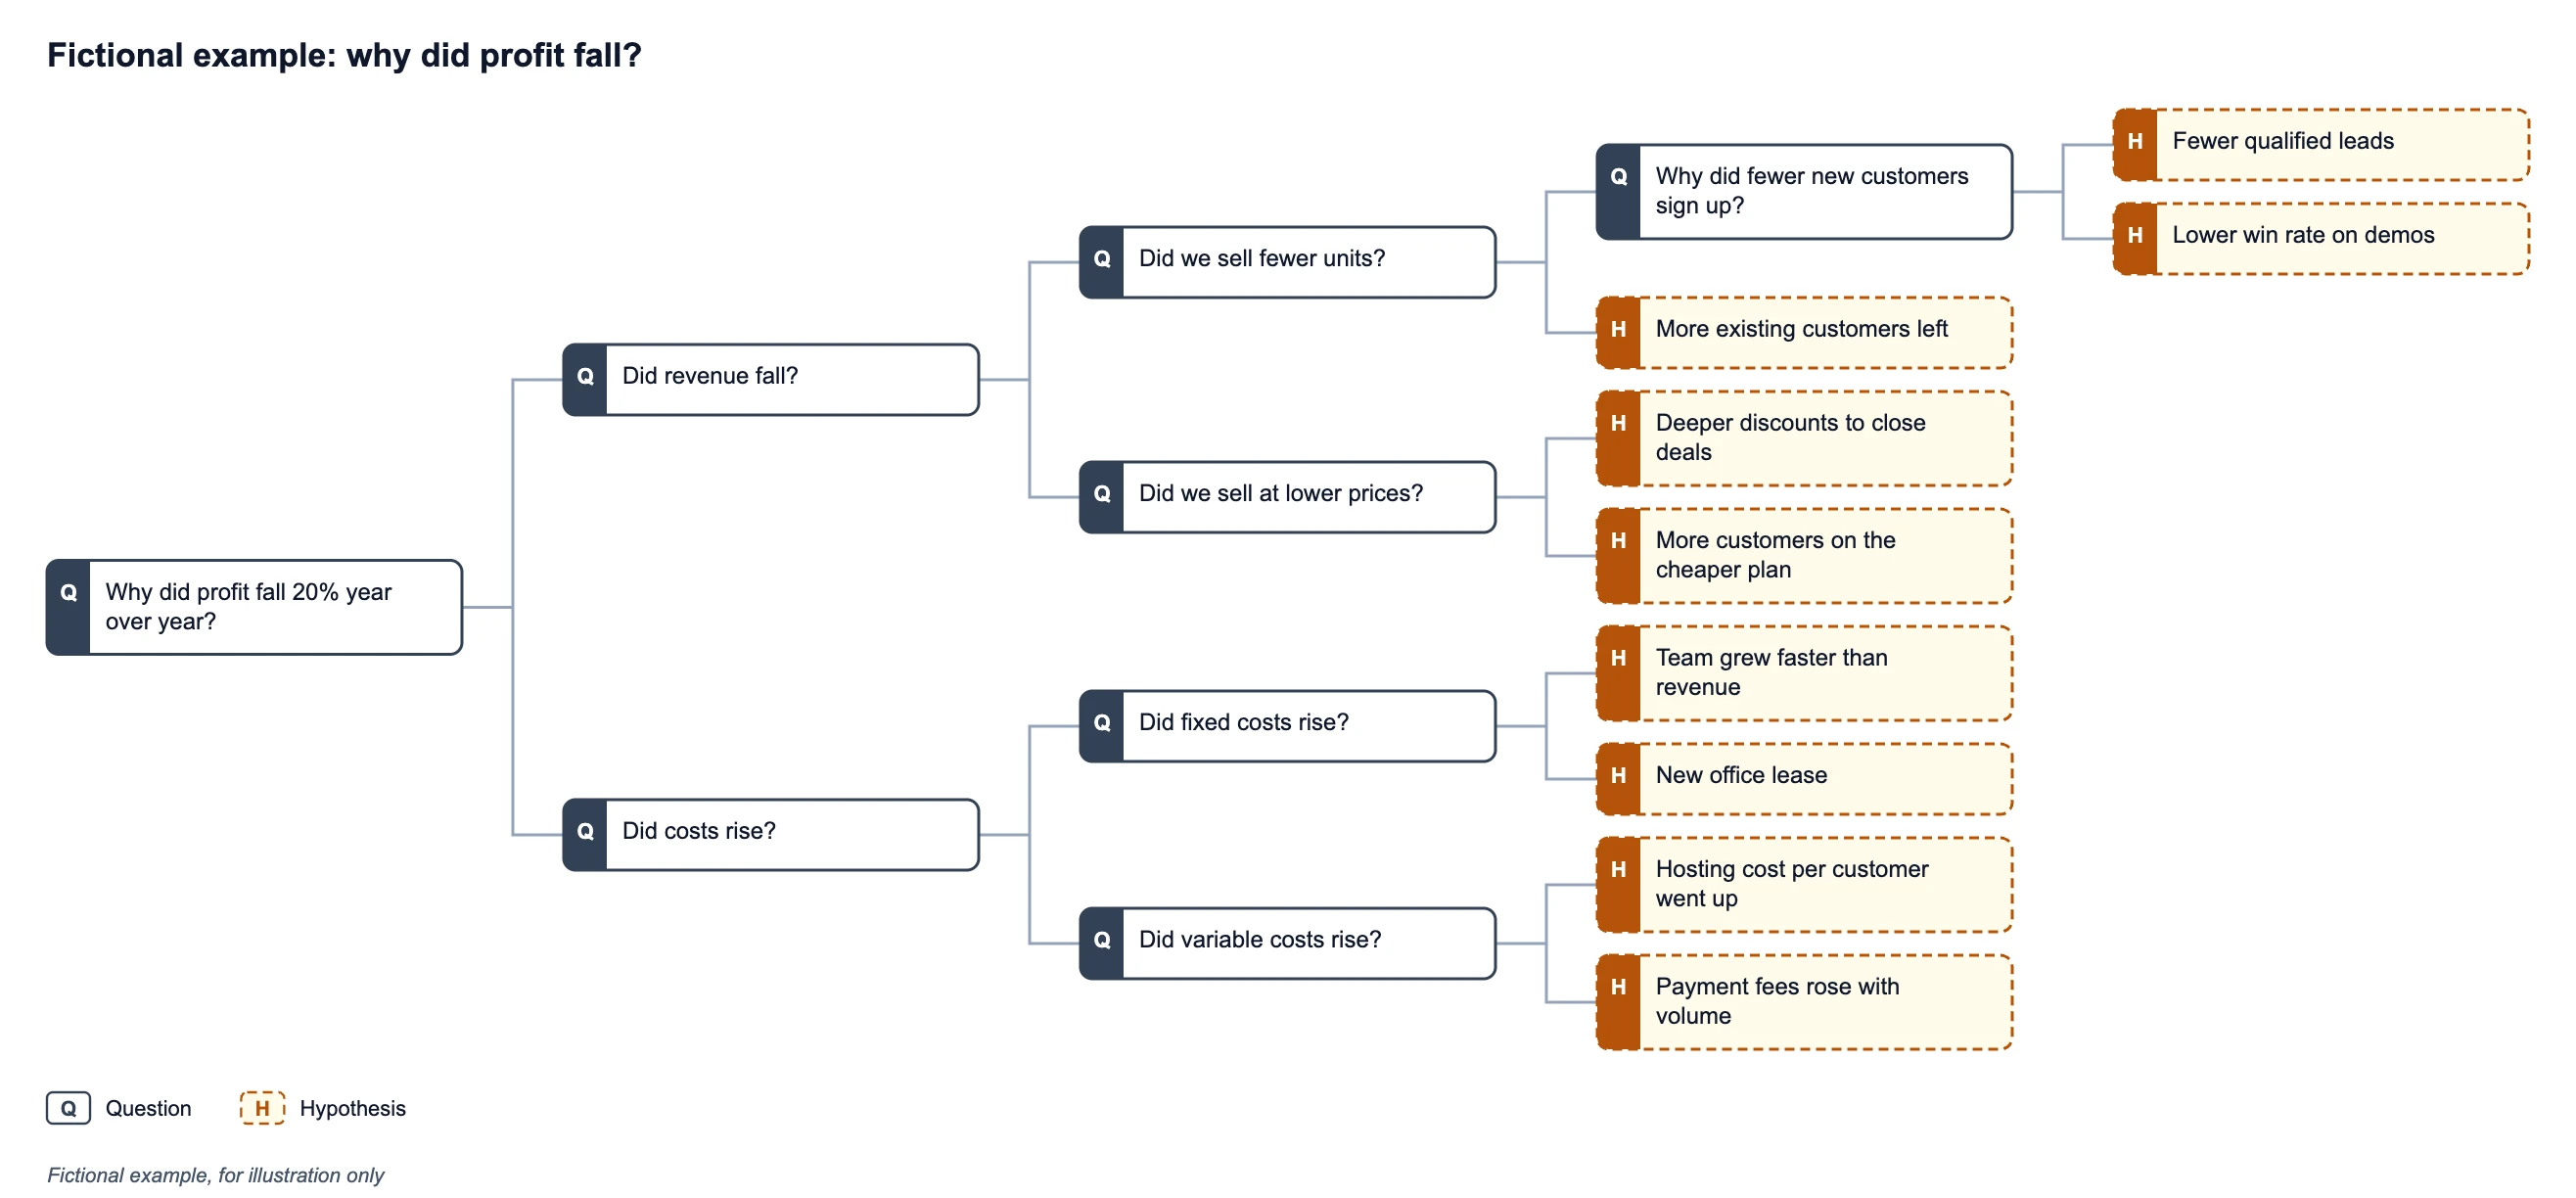
Issue Tree Generator
Break a problem into branches before you decide which stage of the loop to fix.
 Business
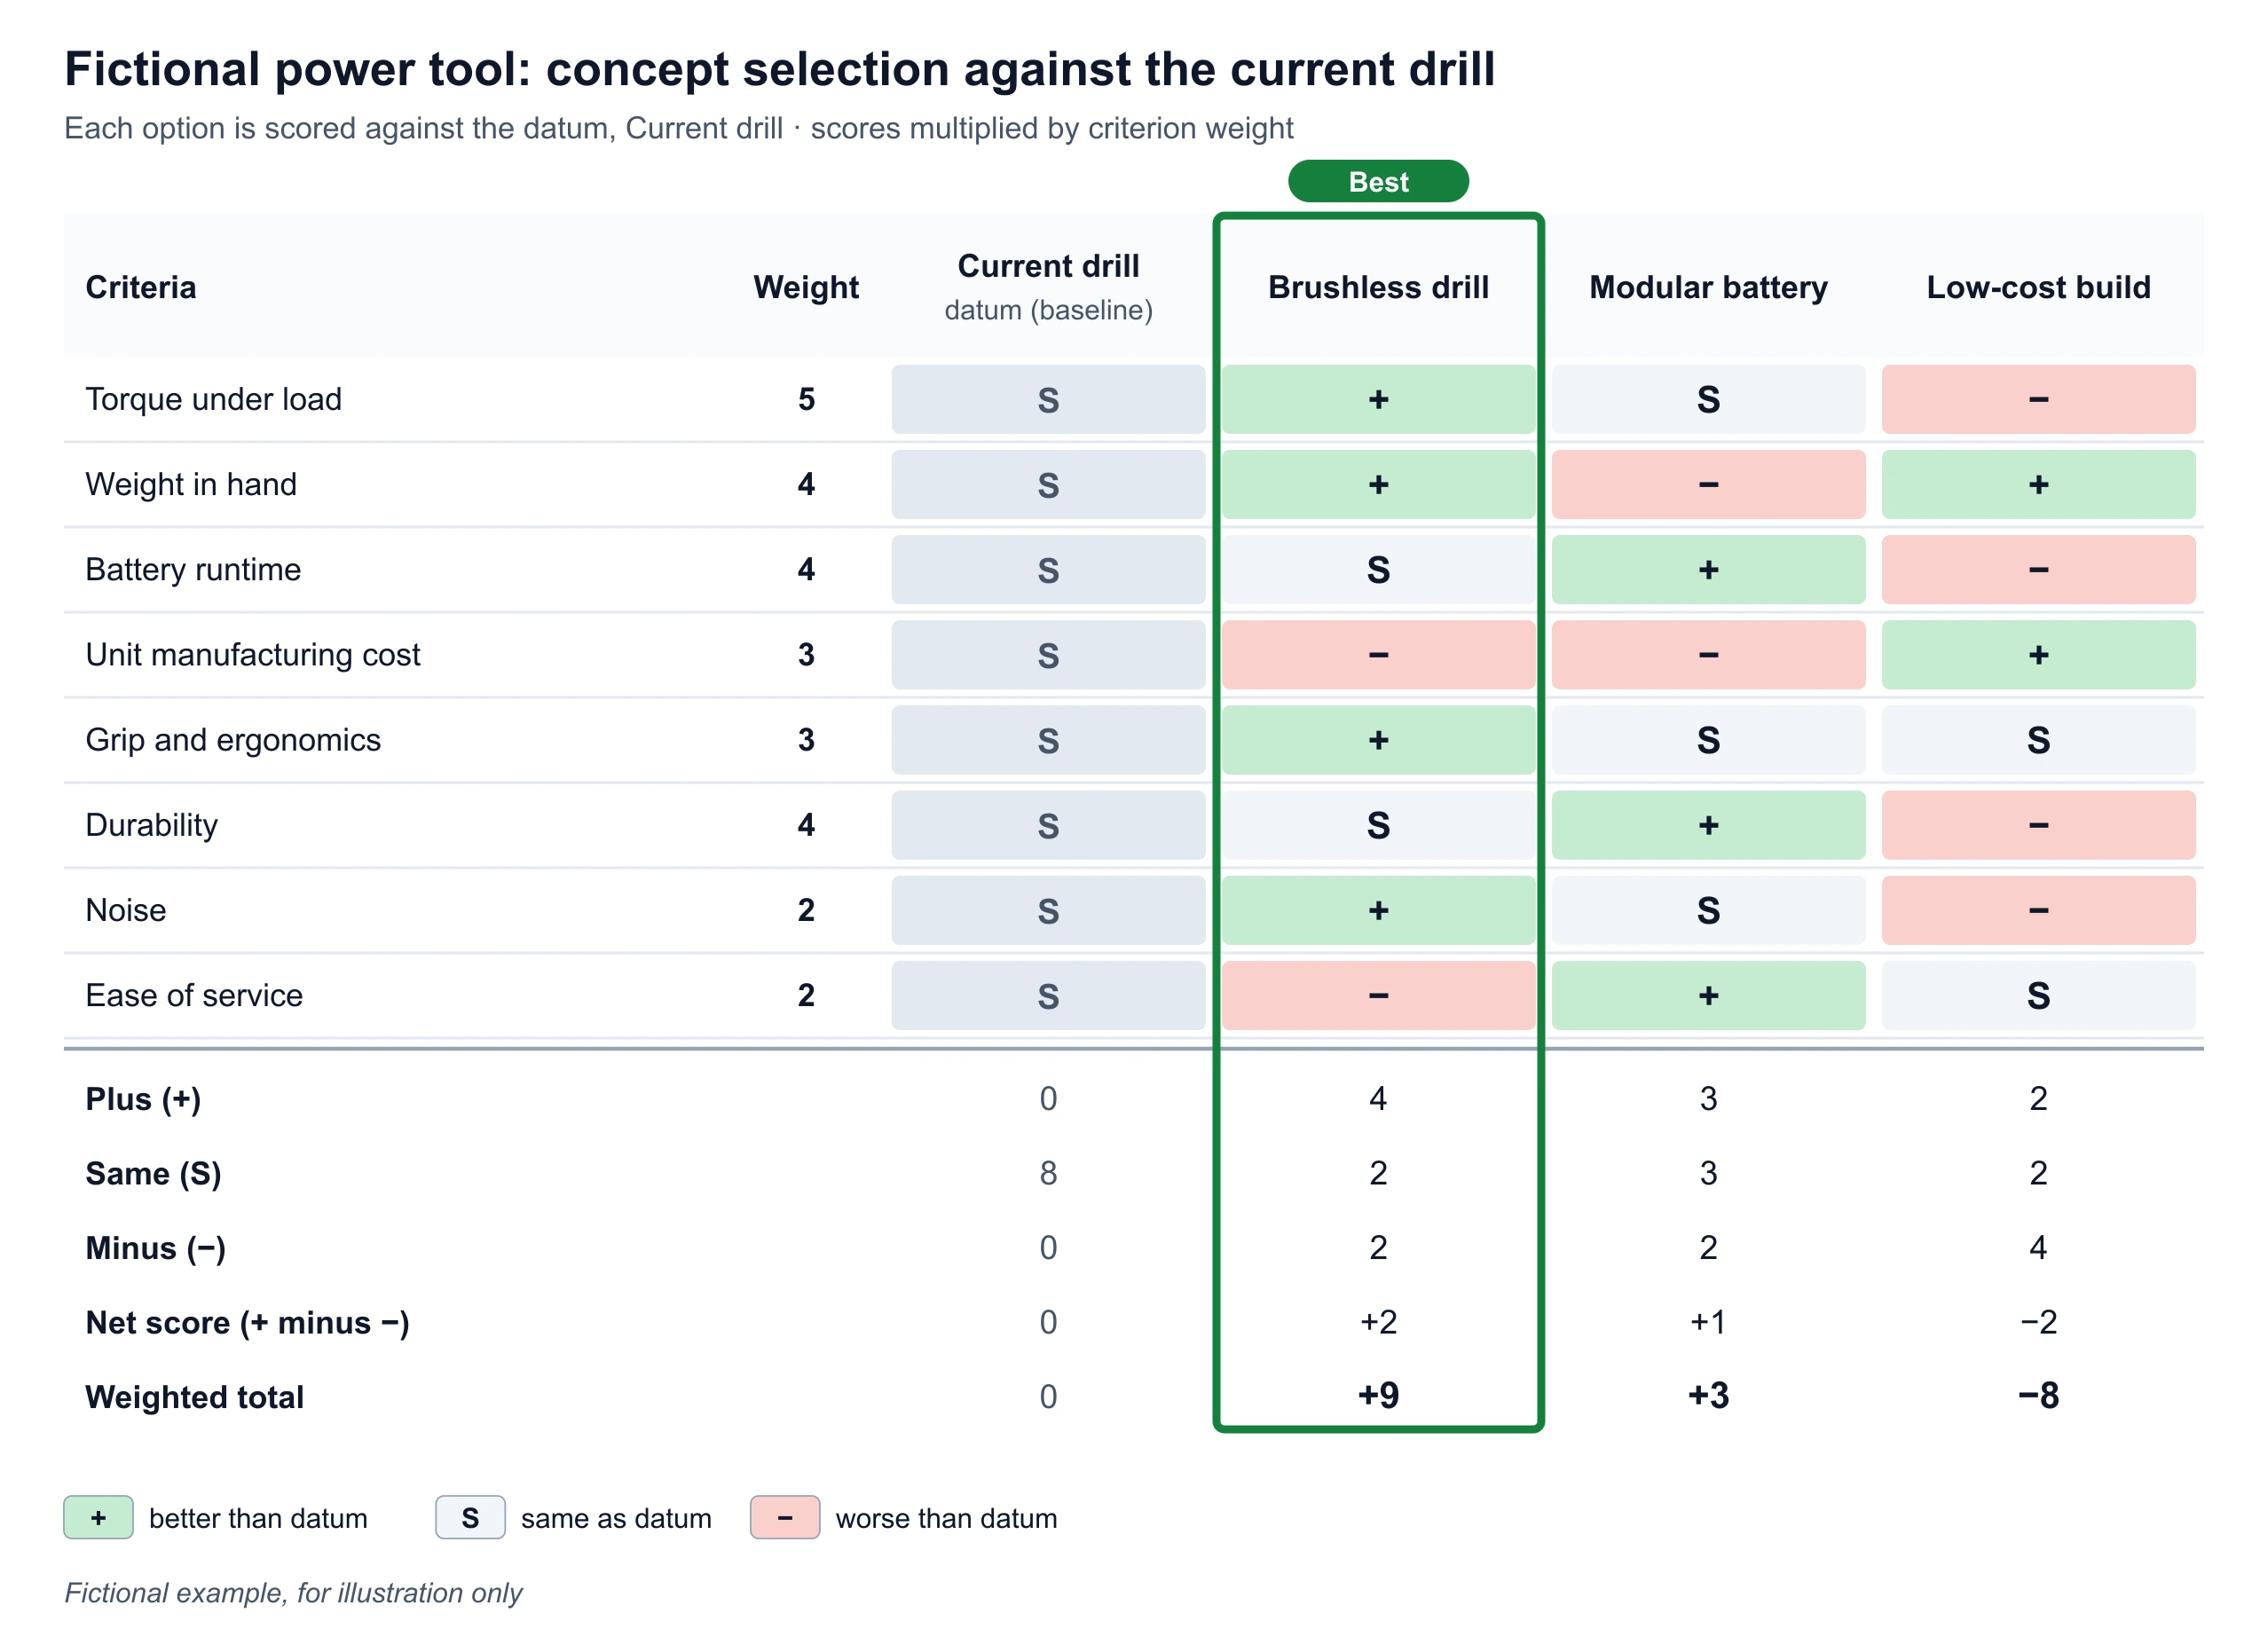
Pugh Matrix Generator
Score the options for fixing a friction point against a baseline.
 Research
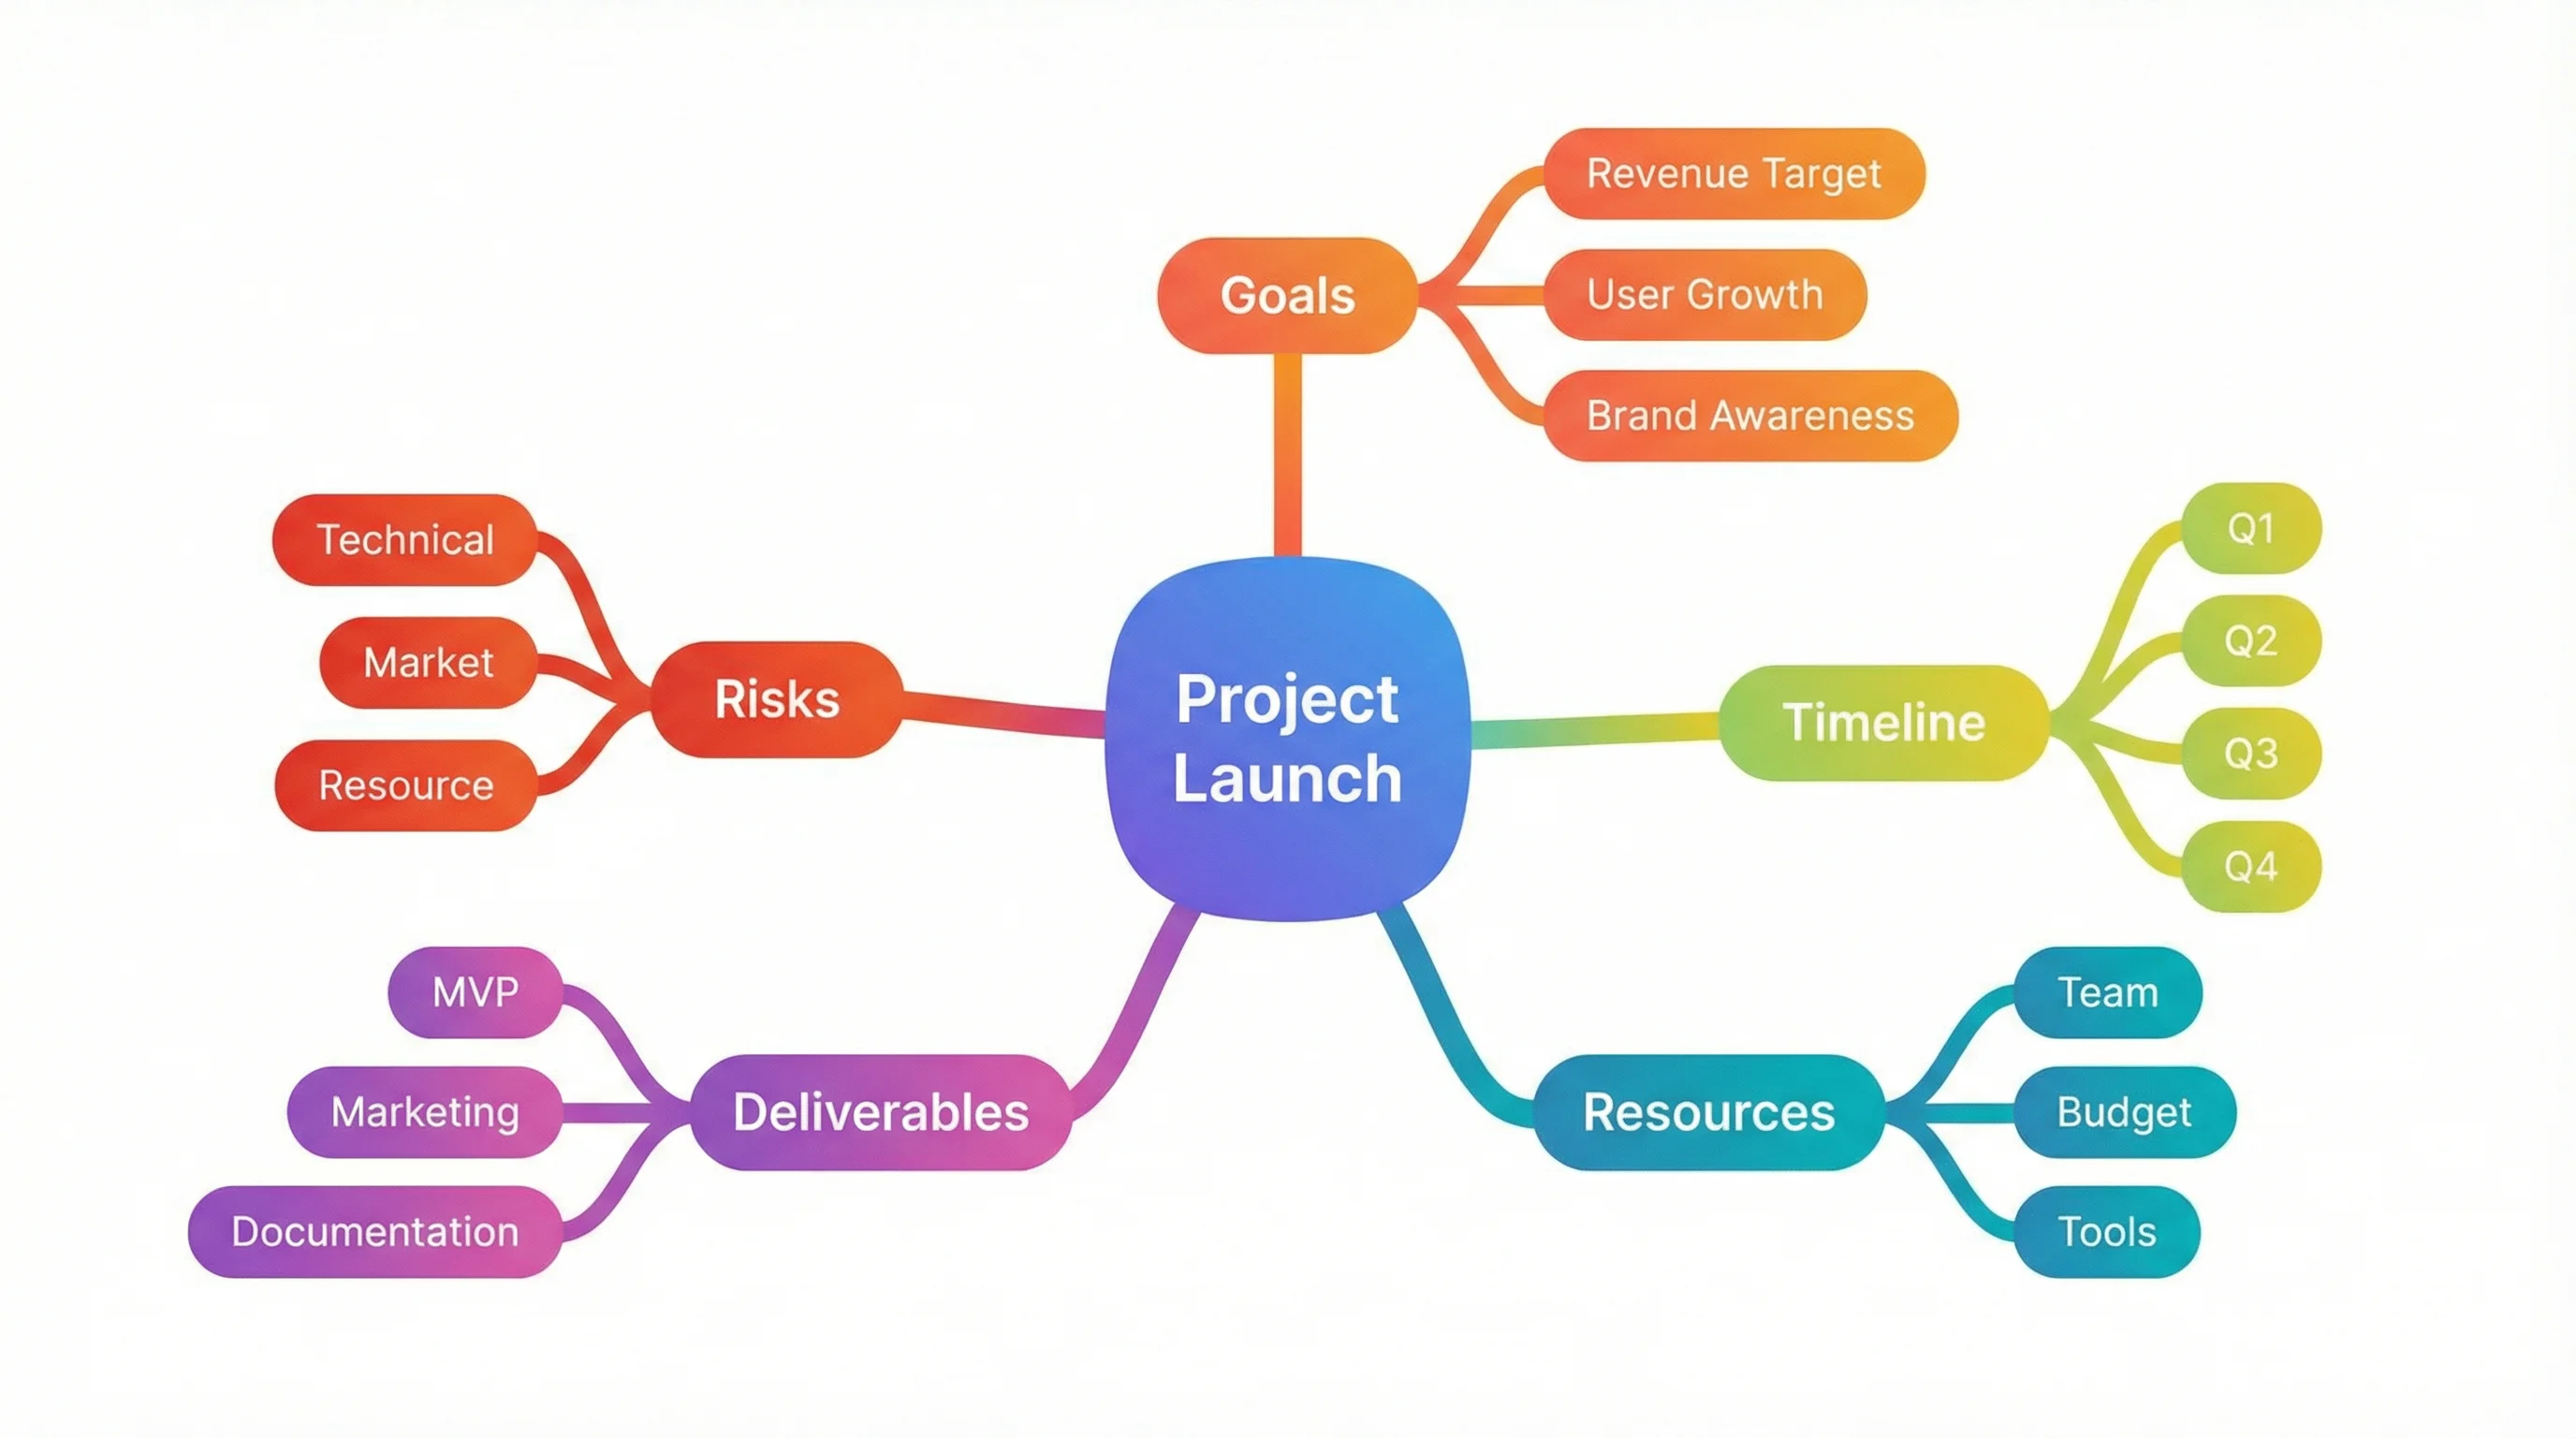
Mind Map Generator
Brainstorm possible stages freely before you pick the ones that feed each other.
 Business
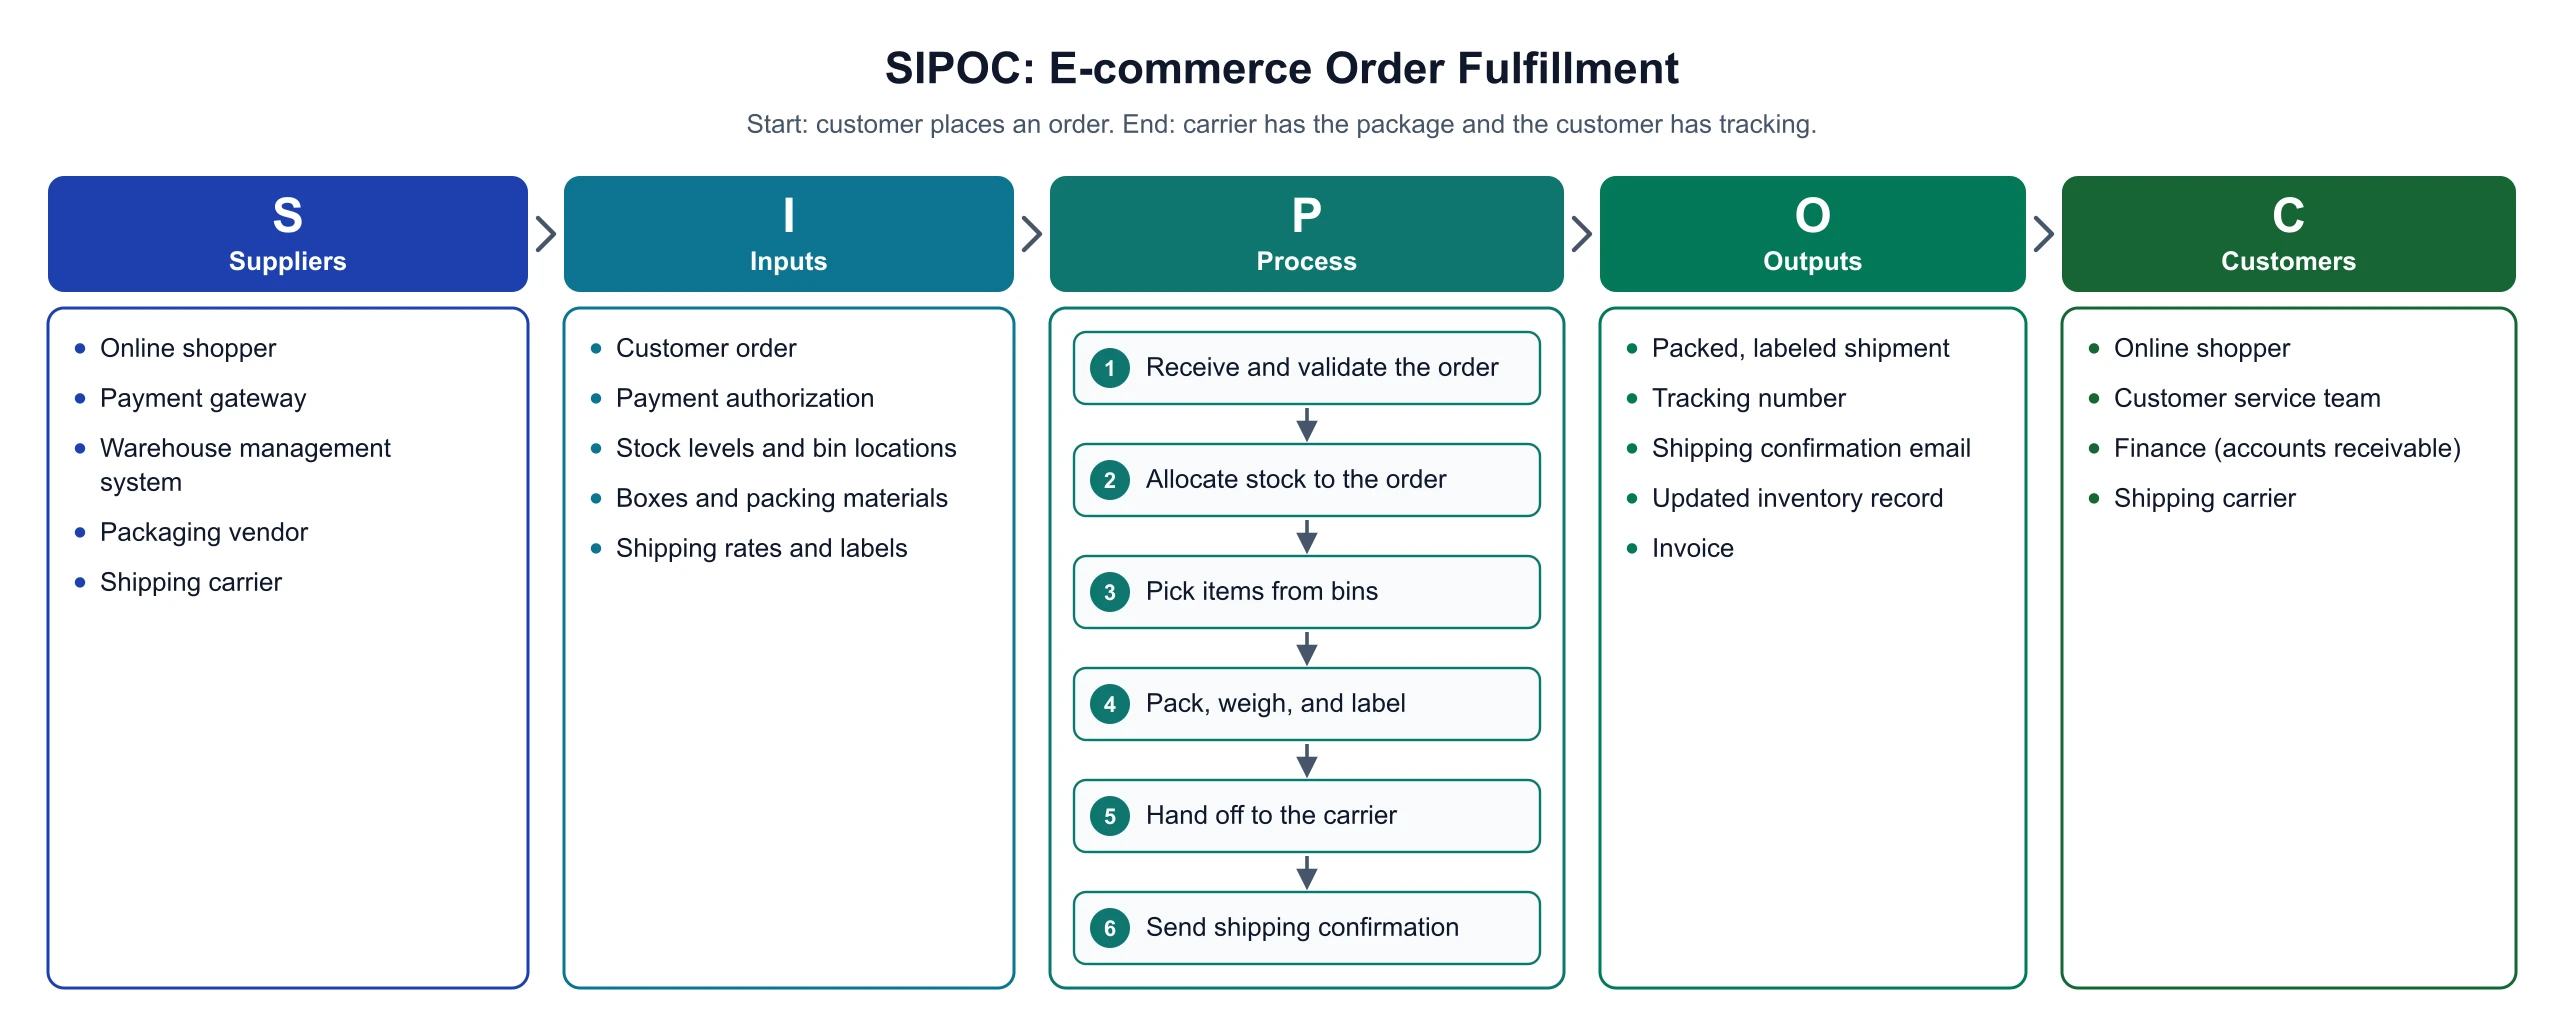
SIPOC Diagram Maker
Map one process from suppliers to customers when you need the steps, not the loop.
 Business
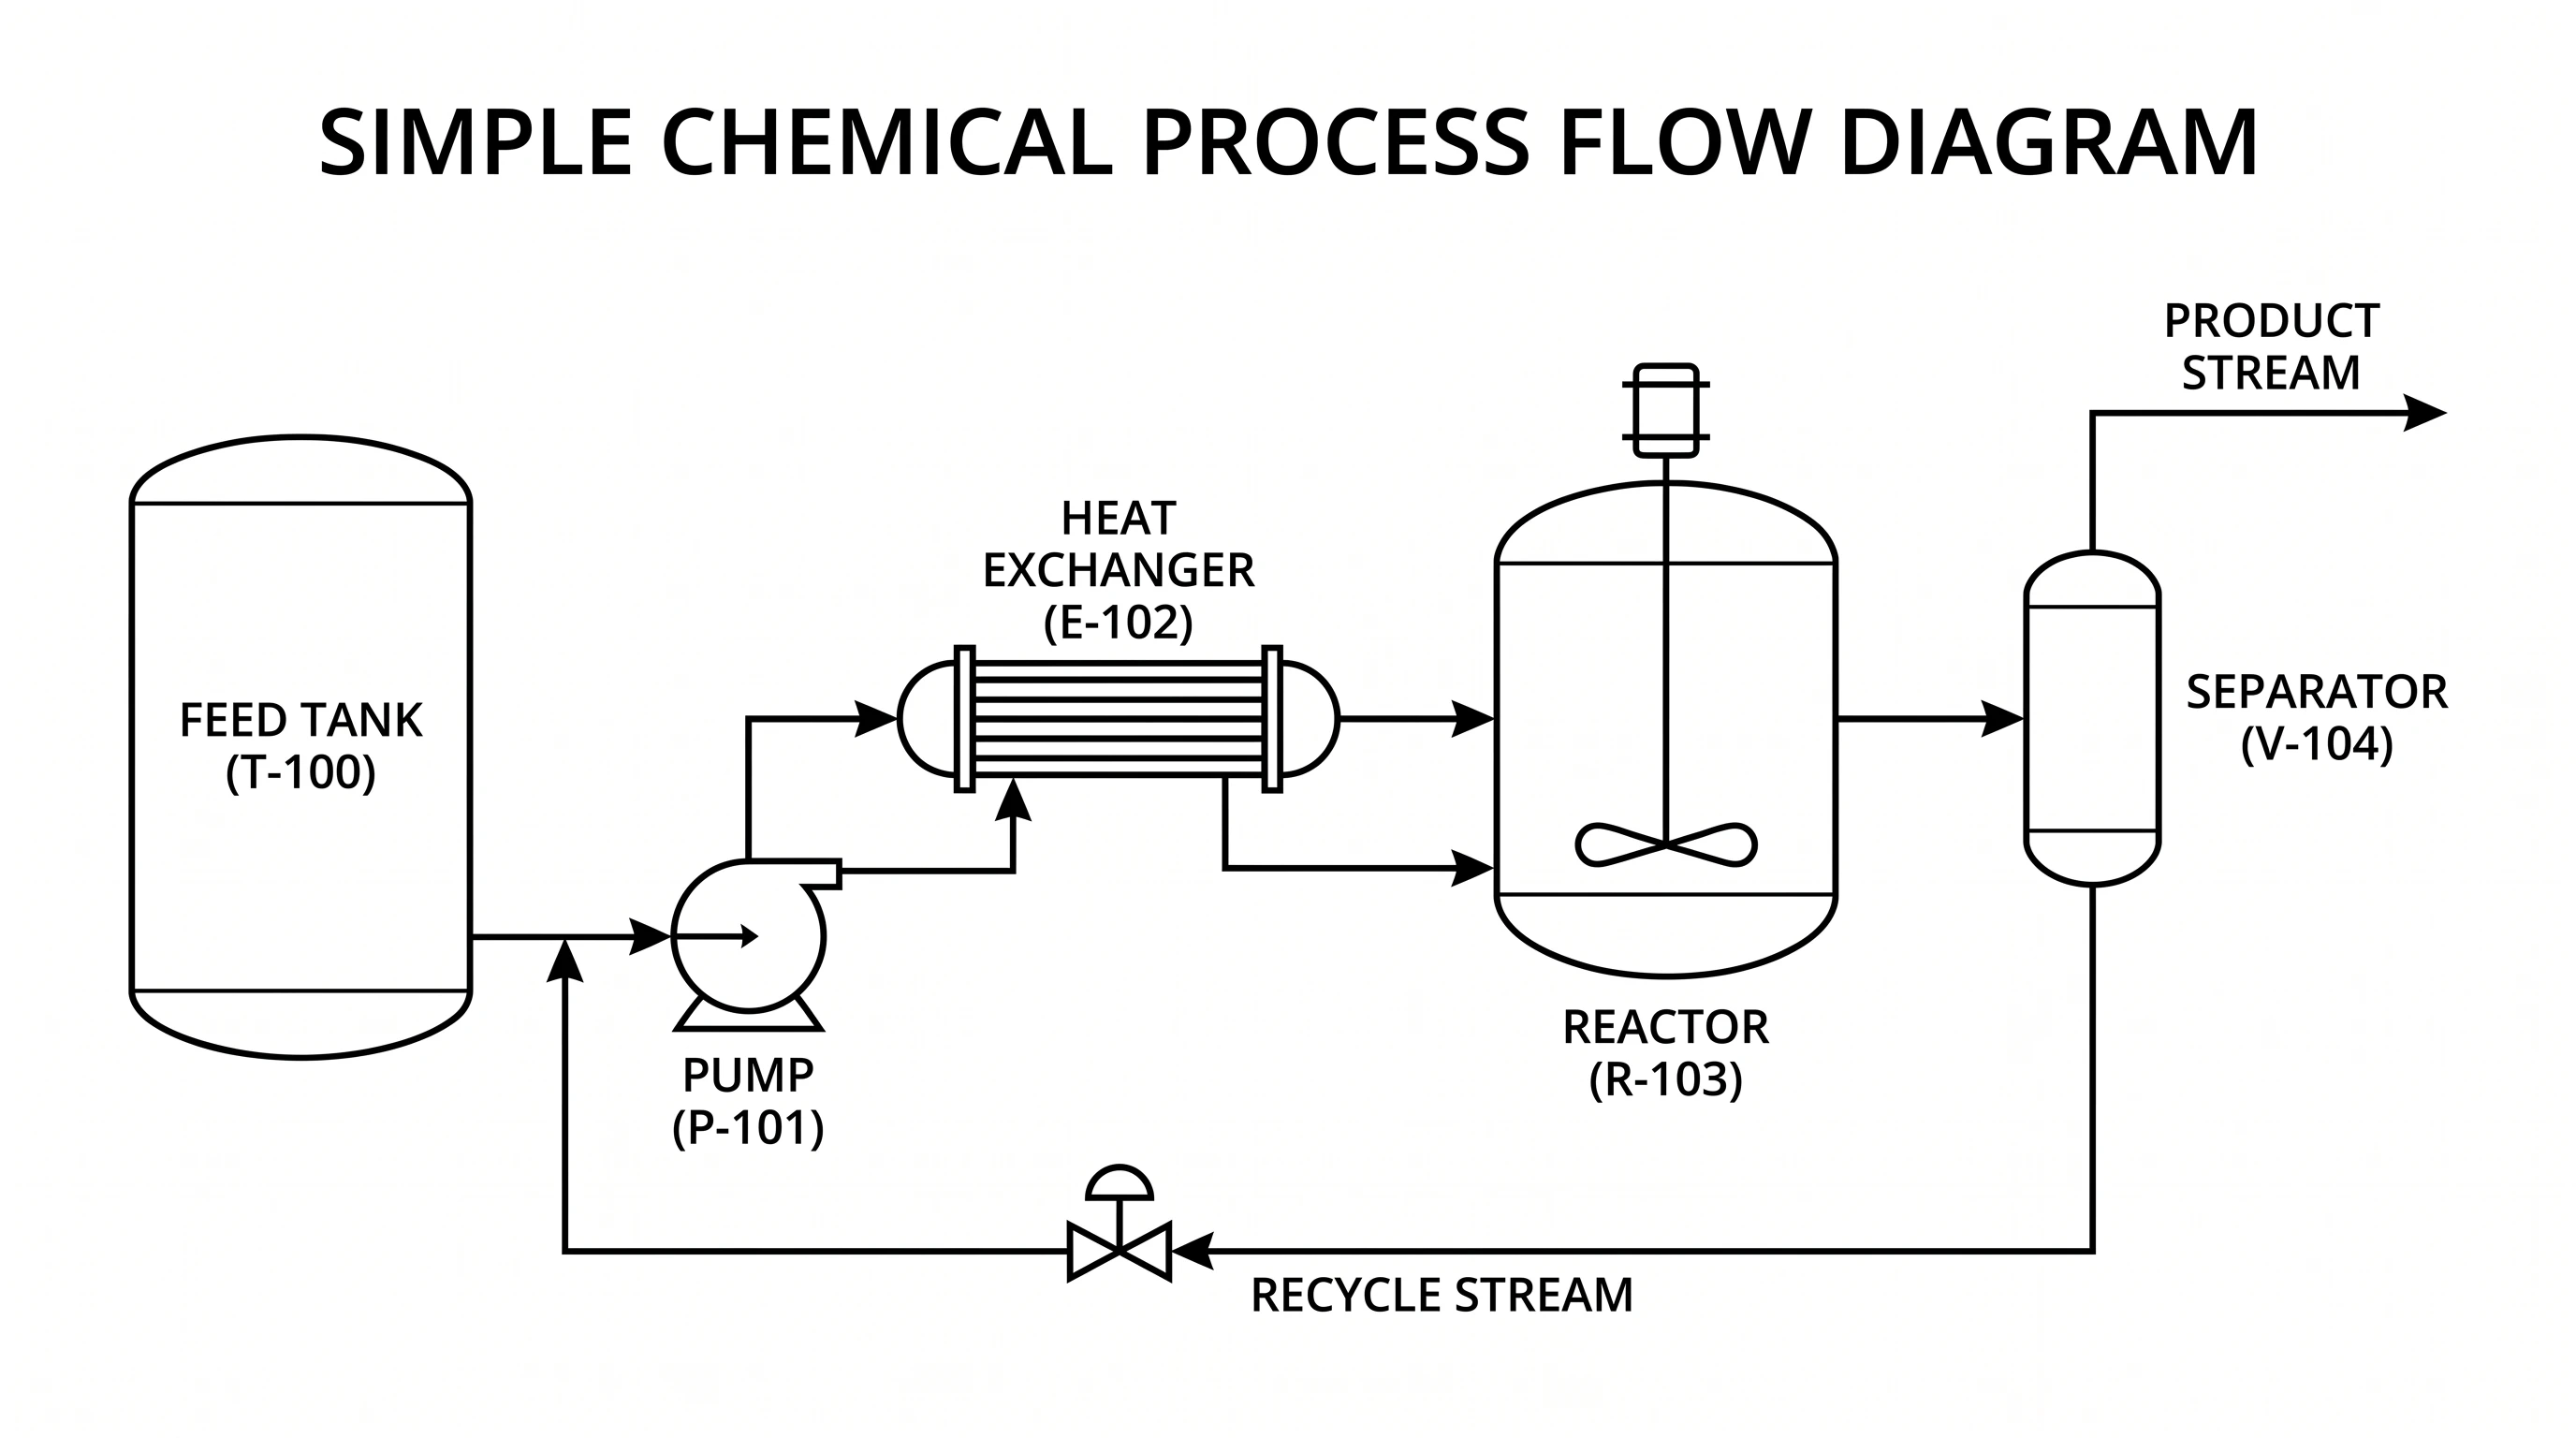
Process Flow Diagram Generator
Draw a step-by-step process with decisions when a loop is the wrong shape.