SIPOC Diagram Maker with Free Template
Fill in Suppliers, Inputs, Process, Outputs, and Customers and get an exact, print-ready SIPOC diagram. Start from a real example or a blank template, then download SVG or PNG for free.
Fill in the five columns and get an exact SIPOC diagram as SVG or PNG, free
Swipe the preview sideways to see all five columns.
SIPOC Diagram Maker
Free to try ·
Your AI SIPOC illustration will appear here
AI images can misspell text. For an exact, editable table, use the SIPOC Editor tab.
What is a SIPOC diagram?
A SIPOC diagram is a one-page, high-level map of a process in five columns: Suppliers (who provides the inputs), Inputs (materials, information, and systems the process needs), Process (4 to 7 high-level steps), Outputs (what the process produces), and Customers (who receives the outputs). It shows the whole process and everyone it touches on a single page, without the decisions and loops of a detailed flowchart.
Teams use a SIPOC to agree on scope before improving a process. It is a standard tool in the Define phase of Six Sigma DMAIC, where it fixes the start and end of the process, names the customers whose requirements will be measured, and gives everyone the same picture before detailed mapping starts. It is also a fast way to onboard a new team member or explain a process to a manager.
When to use a SIPOC
- Kicking off a Six Sigma or lean project. Build it with the team in the first meeting to agree what is in and out of scope.
- Writing a project charter. The SIPOC goes next to the problem statement so sponsors see exactly which process is being changed.
- Supplier or handoff problems. Listing suppliers and inputs side by side often shows an input nobody owns.
- Quality system documentation. ISO 9001 asks you to determine the inputs and outputs of each process; a SIPOC per process is a compact way to record them.
- Onboarding and audits. A one-page overview is easier to read than a 30-box flowchart.
How to fill in a SIPOC (recommended order)
You read a SIPOC left to right, but it is easier to fill in from the middle out: process first, then the right side, then the left. This is the order the editor above is designed around.
- 1
Name the process and set its boundaries
Write one start trigger and one end point, for example "Start: supplier lot arrives. End: lot released or returned." Everything outside these two points is out of scope.
- 2
P: list 4 to 7 high-level steps
Use verb-noun phrases ("Verify insurance", "Pack and label"). If you have 15 steps, group them. Decisions and loops belong in a later flowchart, not here.
- 3
O: list what the process produces
Products, documents, data, and decisions. Include the outputs nobody celebrates, such as a nonconformance report or a rejected lot.
- 4
C: name who receives each output
Internal teams count. Billing, the next shift, and the warehouse are customers just as much as the patient or shopper.
- 5
I: list what the steps need
Materials, information, systems, and standards (a sampling plan or SLA is an input). Every step should be traceable to at least one input.
- 6
S: name who provides each input
Vendors, other departments, systems, or the customer. When the same party is both a supplier and a customer, list it in both columns.
- 7
Check it with the people who do the work
Walk the diagram with a few people from each step. Missing inputs and surprise customers usually show up in the first five minutes.
SIPOC vs flowchart vs swimlane vs value stream map
A SIPOC is the zoomed-out view. Once the scope is agreed, teams usually move to one of the more detailed maps below.
| Map | What it shows | Level of detail | Best for |
|---|---|---|---|
| SIPOC diagram | Who supplies what, the 4 to 7 high-level steps, what comes out, and who receives it | One page, no decisions or loops | Scoping a project, the Define phase of DMAIC, onboarding |
| Flowchart or workflow diagram | Every step, decision, and loop in order | Detailed, one box per task | Documenting or redesigning how work is actually done |
| Swimlane diagram | The same steps split by role or department | Detailed, with handoffs between lanes | Finding handoff delays and ownership gaps |
| Value stream map | Material and information flow with cycle times, inventory, and wait times | Detailed, with timing data | Lean waste analysis and lead-time reduction |
To go one level deeper, turn your SIPOC steps into a workflow diagram or an AI flowchart, or split them by department with the swimlane diagram generator. If you are mapping a chemical or plant process with equipment and material streams, you want a process flow diagram (PFD) instead. Our workflow diagram guide covers the symbols and steps.
Common SIPOC mistakes
- Too many process steps. A SIPOC with 12 steps has turned into a flowchart and loses its one-page overview. Keep 4 to 7 and move detail elsewhere.
- Describing decisions and exceptions. "If insurance fails, call payer" is flowchart detail. In a SIPOC, just write "Verify insurance eligibility".
- Confusing suppliers with inputs (or customers with outputs). The supplier is who, the input is what: "Payment gateway" supplies "payment authorization".
- Leaving out internal customers and suppliers. Finance, IT, and the next department in line are often the customers most affected by defects.
- No start and end point. Without boundaries the team argues about scope for the rest of the project.
- Filling it in alone. A SIPOC built at a desk reflects the procedure manual, not the real process.
Free blank SIPOC template
Prefer to fill it in by hand in a workshop? Download the blank template below and print it on a landscape page or project it on a whiteboard. It has the five labeled columns, writing lines, and six numbered process steps. To get a typed version, click Start blank in the editor above.
What comes after the SIPOC in DMAIC
With the scope fixed, the Measure and Analyze phases need a few more charts. Rank defect types with a Pareto chart, brainstorm causes of the top defect on a fishbone diagram, and track the improved process in the Control phase with a control chart.
SIPOC Diagram Examples
Every example below was exported from the editor above, where the same examples load in one click.
Hospital Outpatient Registration
Exact render: front-desk registration from patient arrival to routing, with insurance and billing as customers.
E-commerce Order Fulfillment
Exact render: order-to-carrier fulfillment in six steps, from validation to the tracking email.
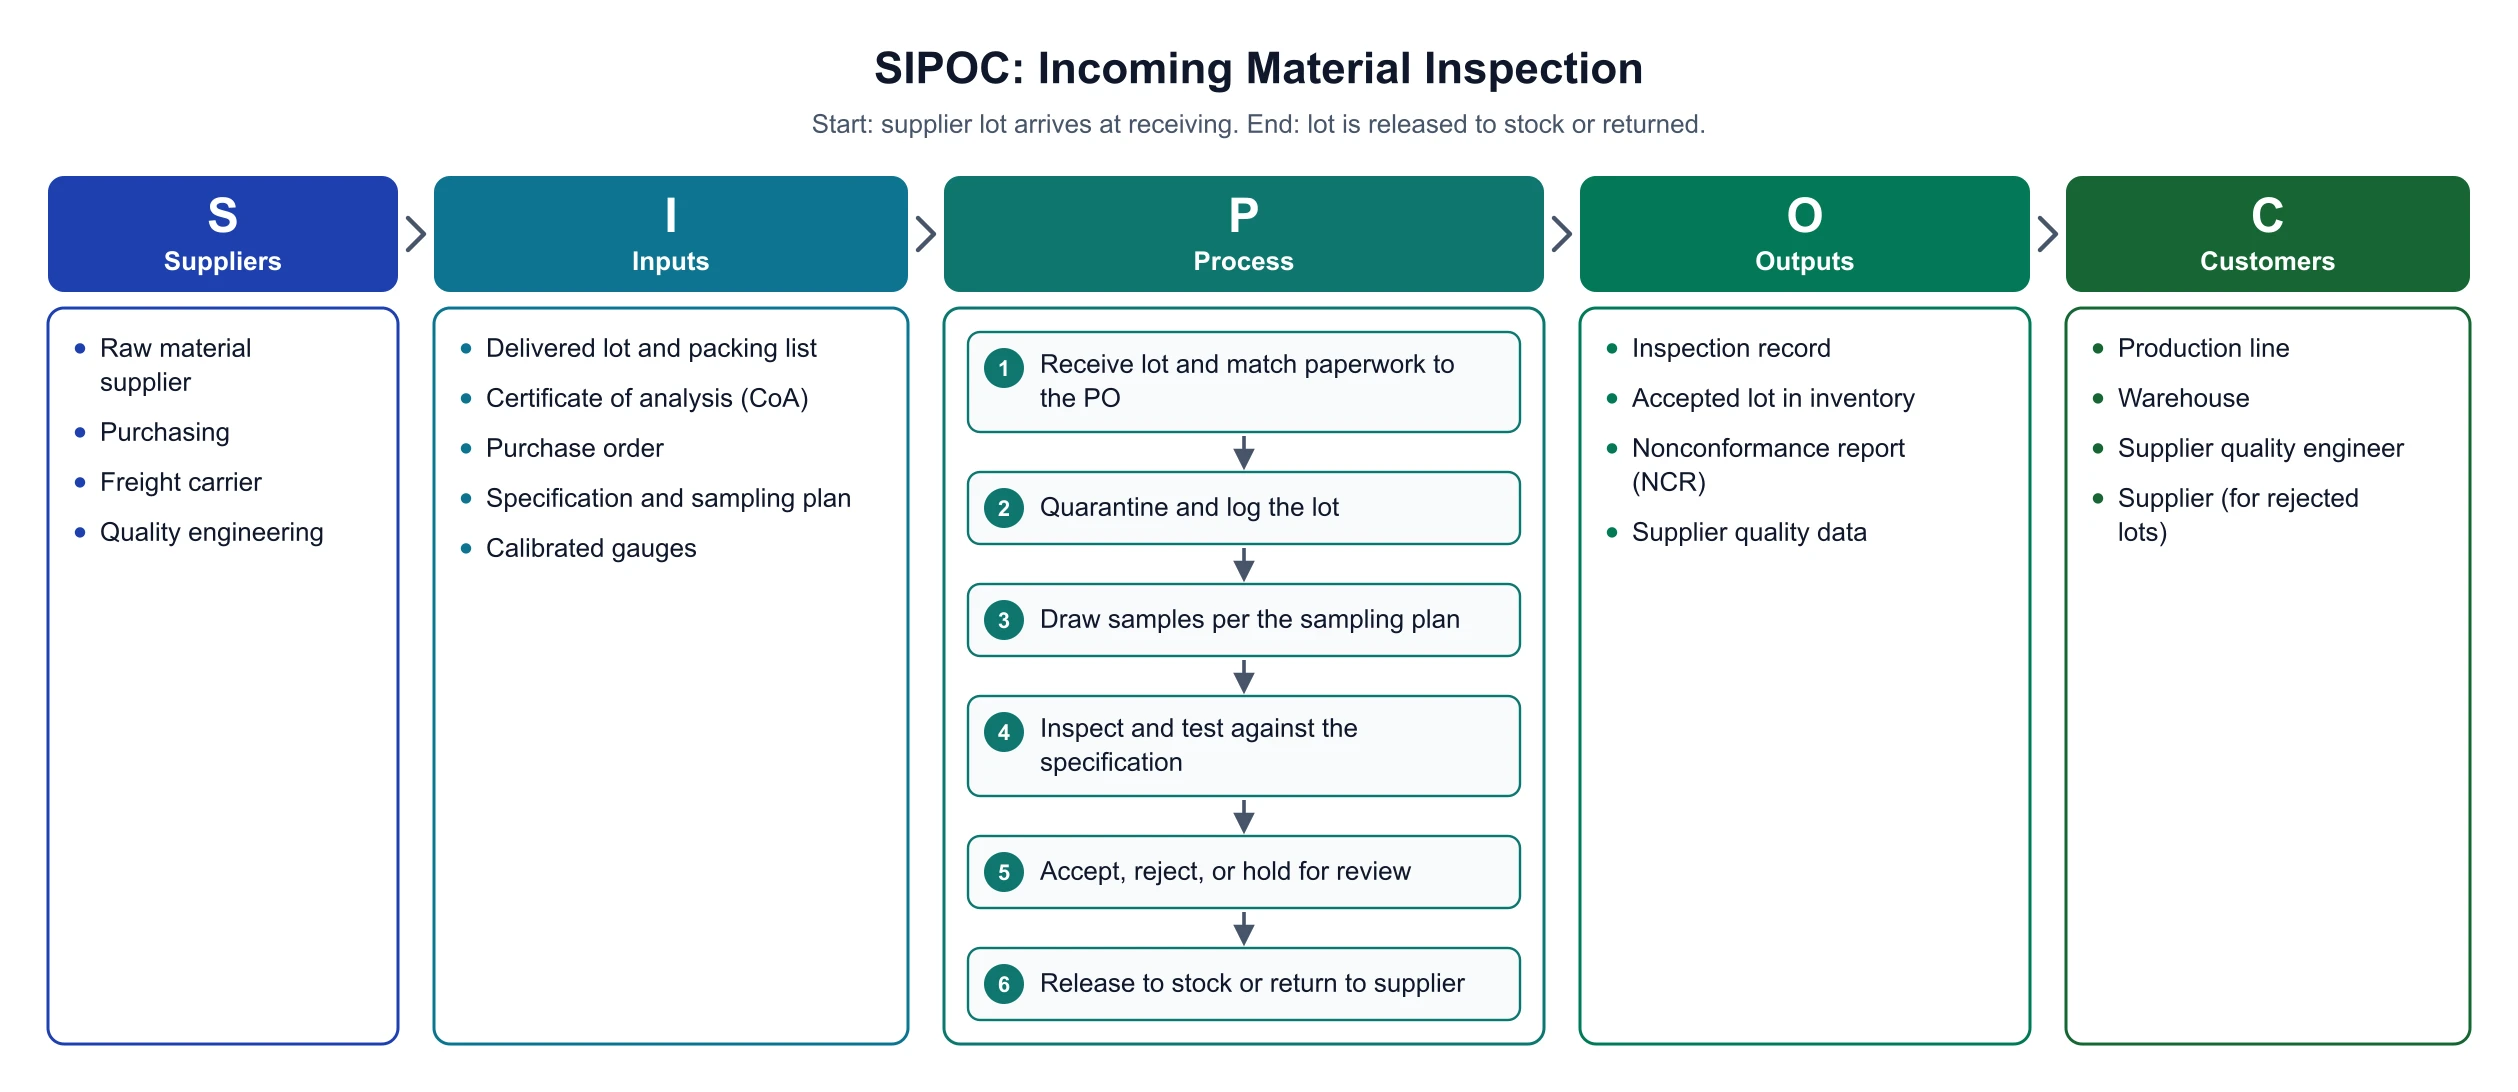
Manufacturing Incoming Inspection
Exact render: receiving inspection from lot arrival to release, with NCRs and supplier quality data as outputs.
Software Release Process
Exact render: a release train from scope freeze to a stable production version.
IT Help Desk Ticket Resolution
Exact render: ticket handling from report to closure, with SLA data as an output.
Blank SIPOC Template
Exact render: a printable blank template with writing lines and six numbered steps.
Is SIPOC lean or Six Sigma?
SIPOC is most closely associated with Six Sigma, where it is a standard tool in the Define phase of DMAIC, but it is not exclusive to it. Lean teams, ISO 9001 quality managers, business analysts, and IT service teams all use SIPOC to agree on the boundaries of a process before measuring or redesigning it. Some teams also add Requirements to the customer column (SIPOC-R) or note controls and measures under each step, which you can do in this editor by adding items.
What is COPIS?
COPIS is the same five columns read in reverse: Customers, Outputs, Process, Inputs, Suppliers. Some teams prefer it because it forces you to start from what the customer receives. The finished diagram is the same, so you can fill in this editor in COPIS order and still export a standard SIPOC layout.
Frequently Asked Questions
Related Process & Quality Tools
 Process
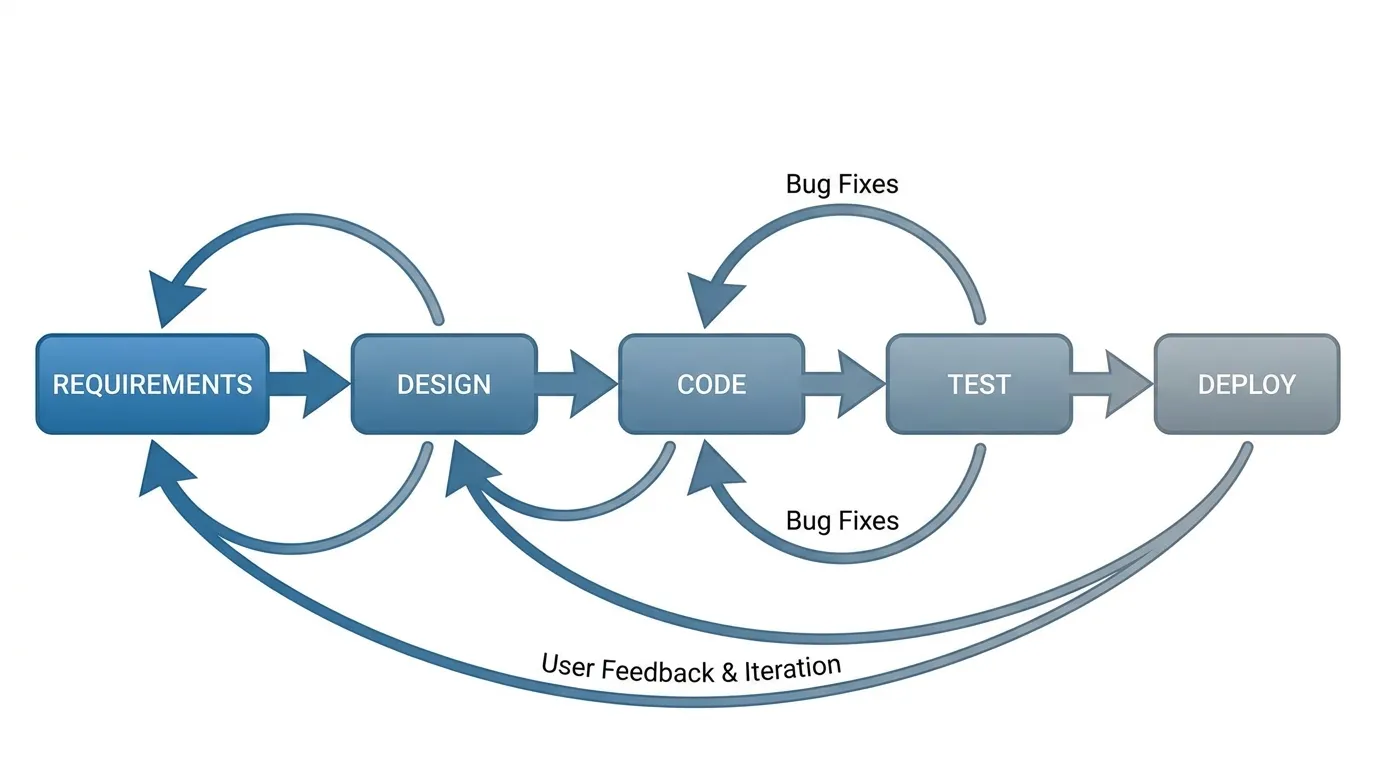
Workflow Diagram Generator
Turn the SIPOC process steps into a detailed workflow with decisions and handoffs.
 Process
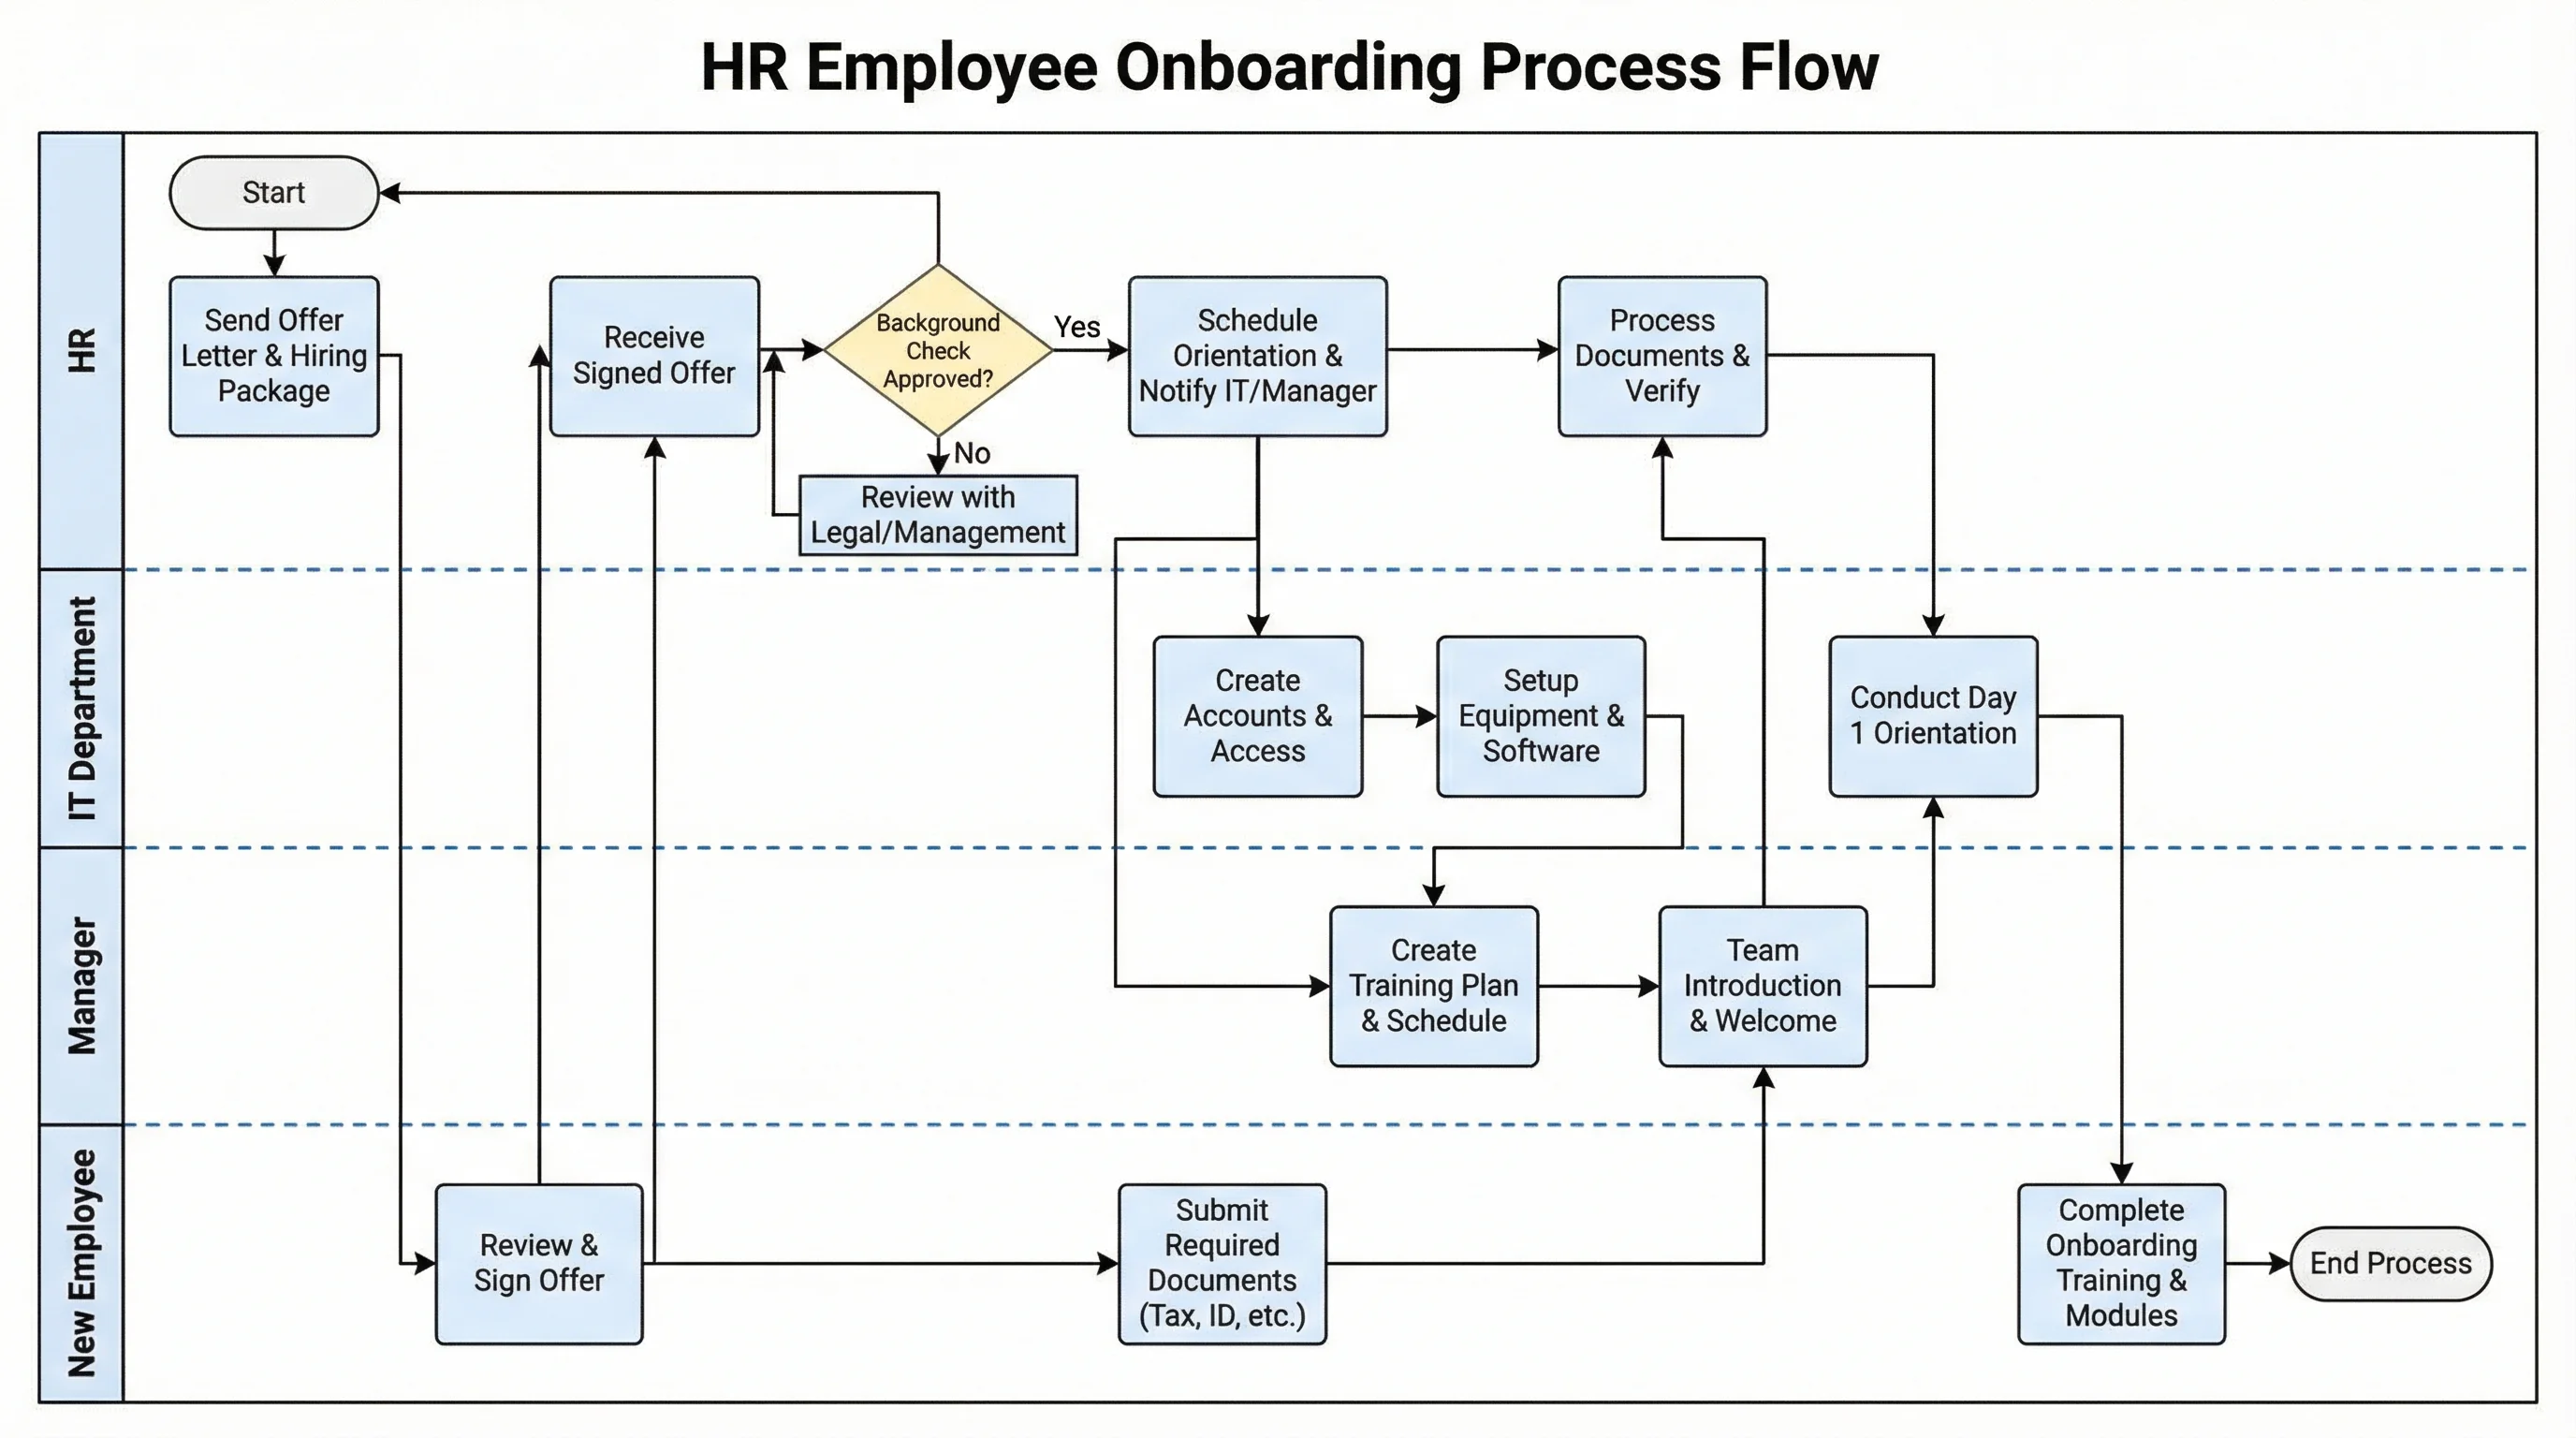
Swimlane Diagram Generator
Split the process by role or department to find handoff delays.
 Quality
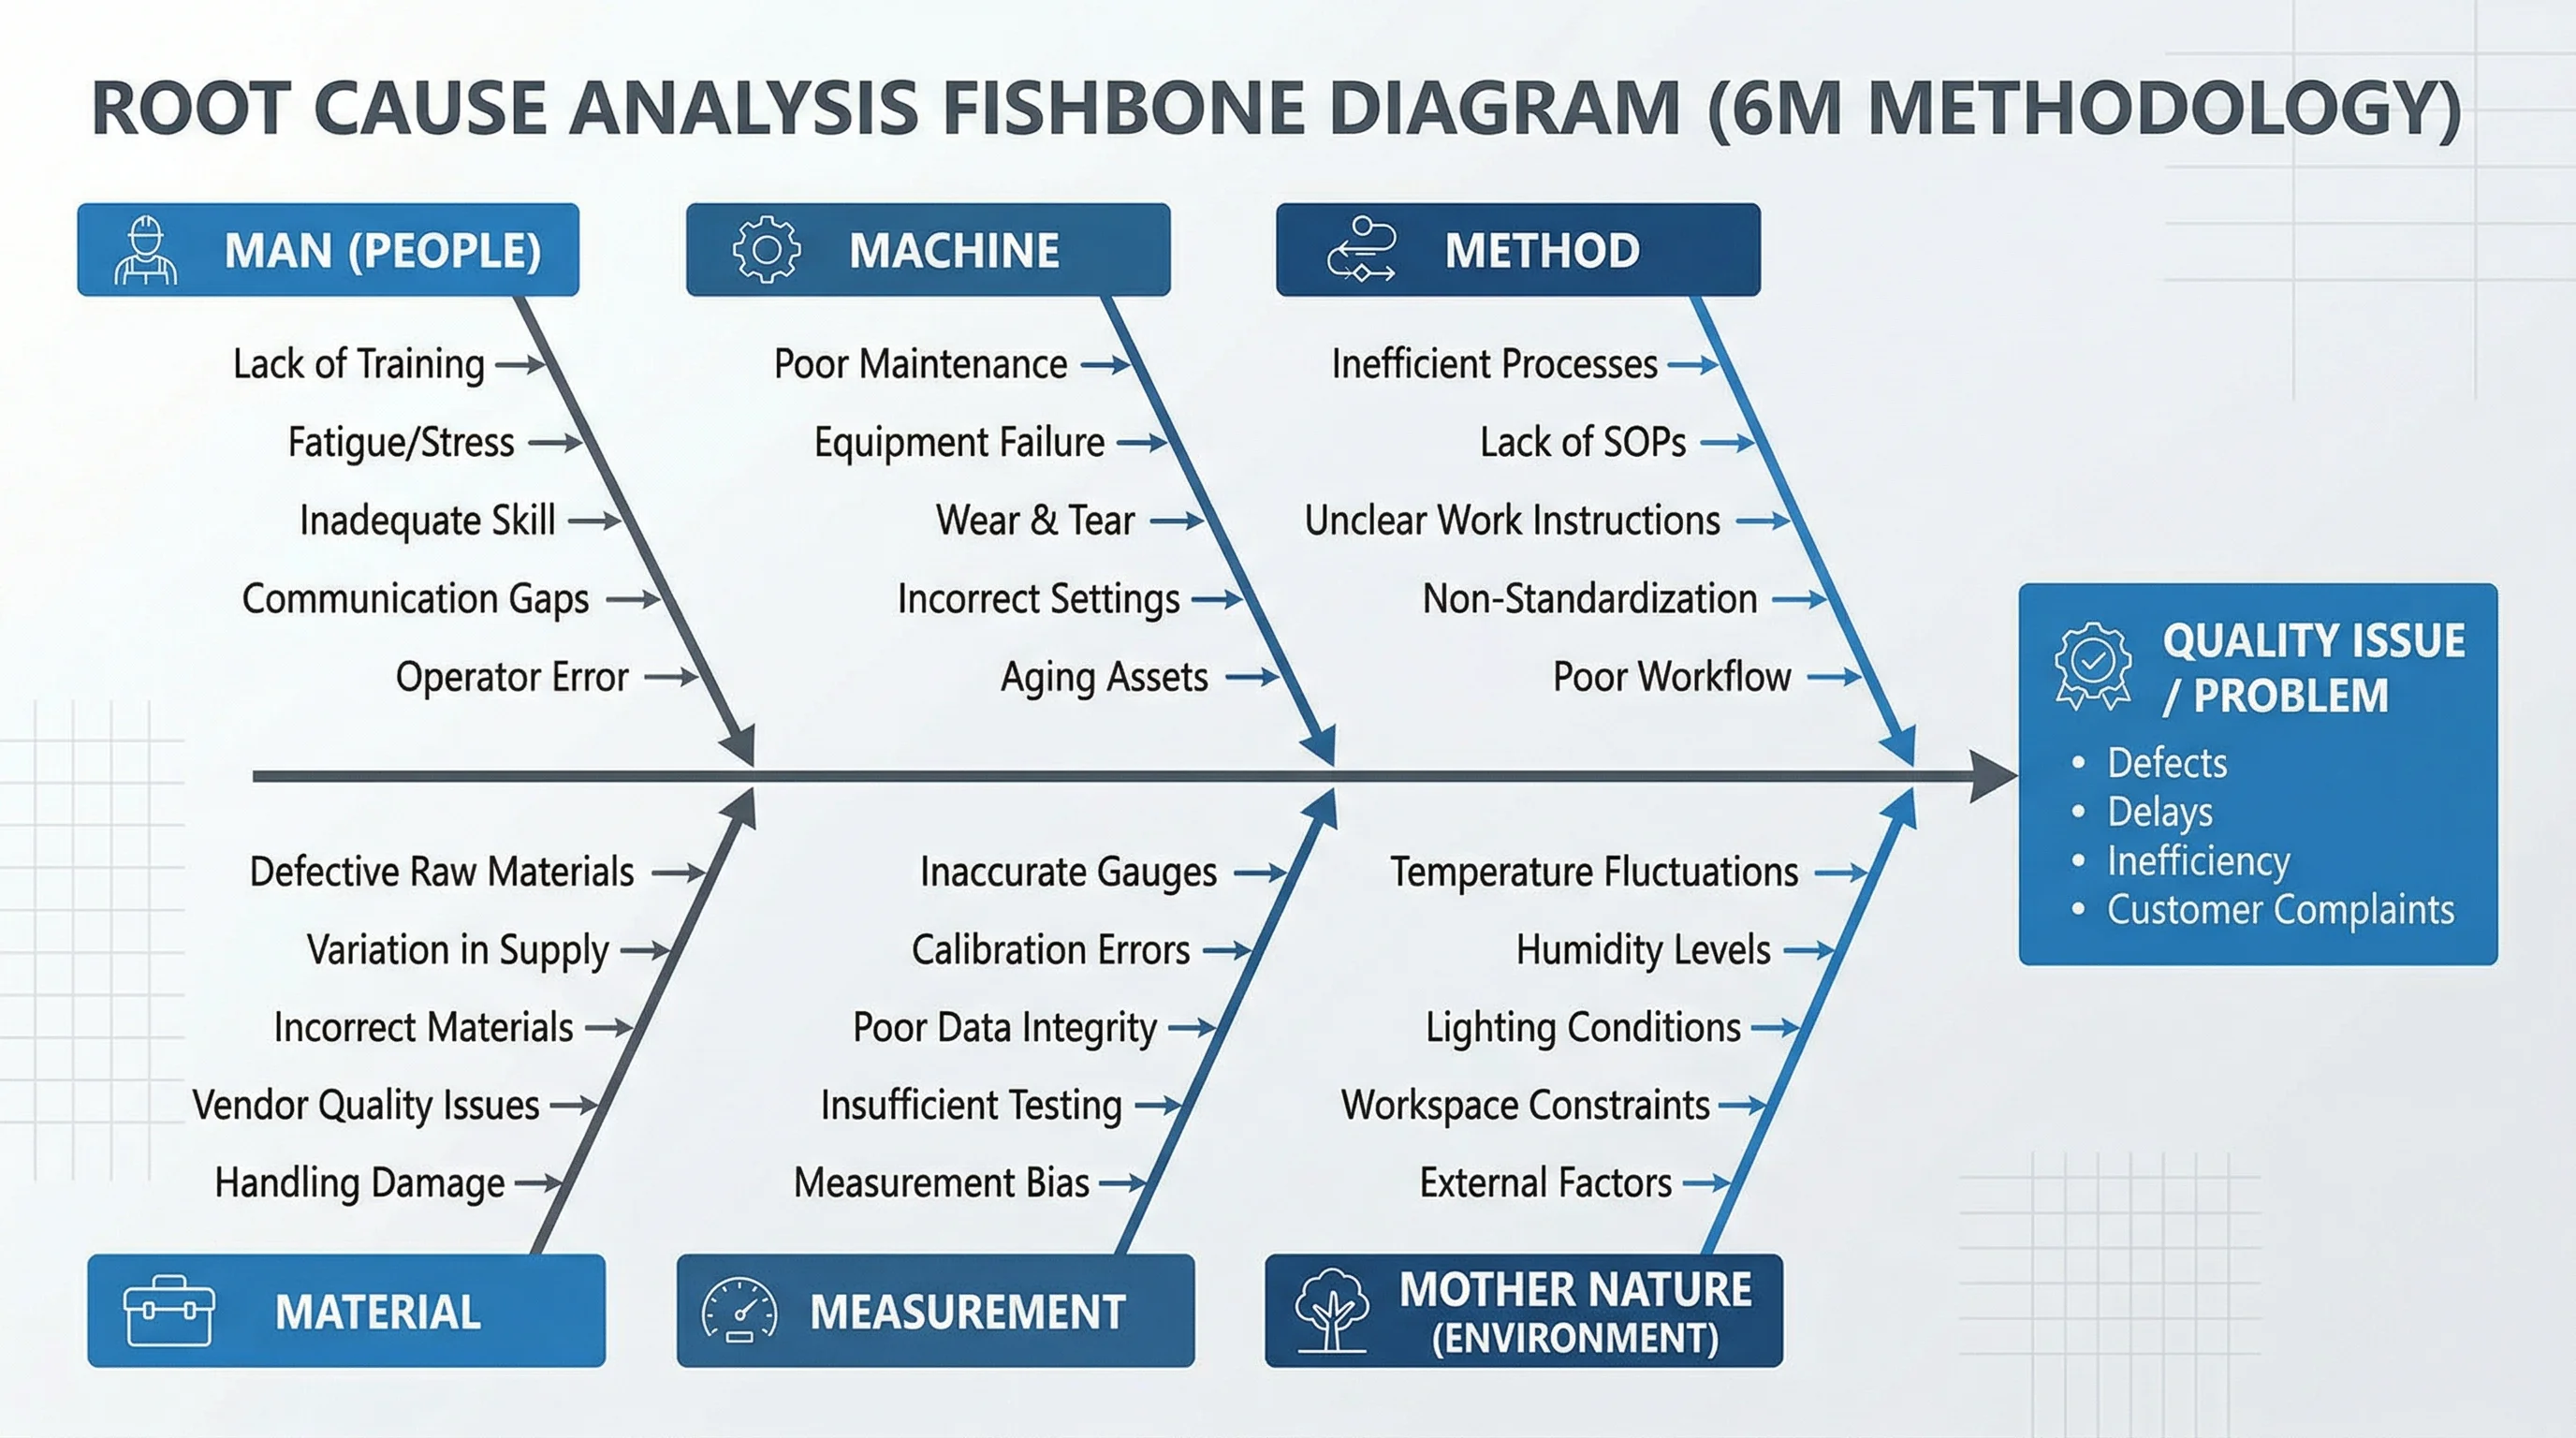
Fishbone Diagram Generator
Brainstorm root causes once the SIPOC has scoped the problem.
 Quality
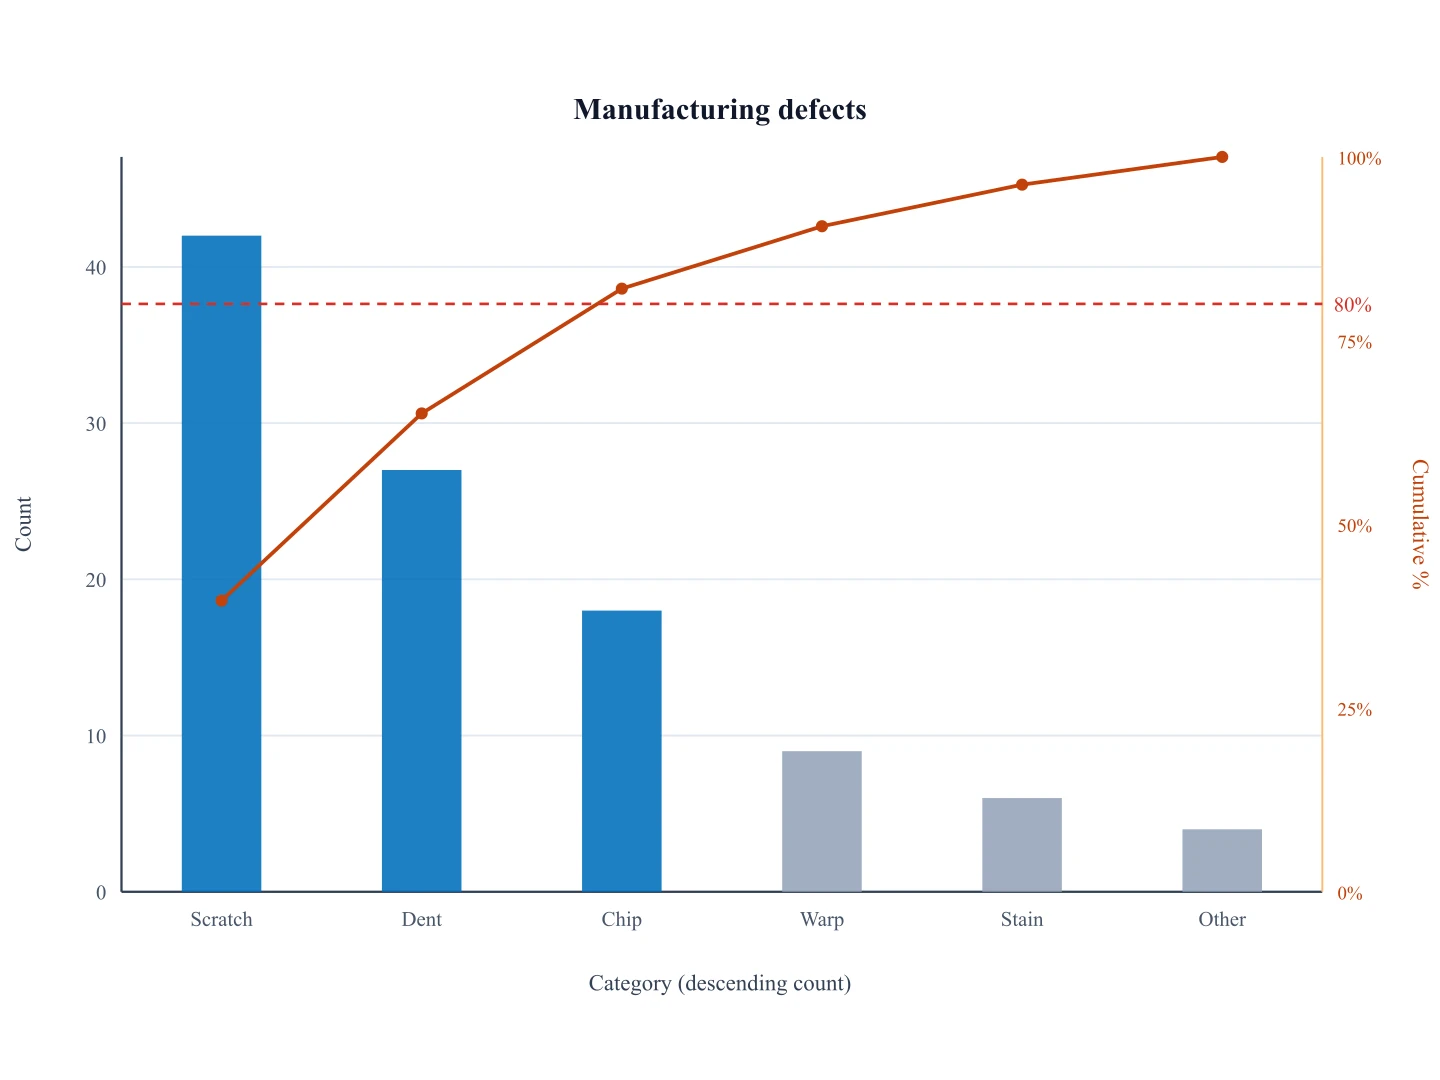
Pareto Chart Generator
Rank defect categories to decide where to focus first.
 Quality
Control Chart Generator
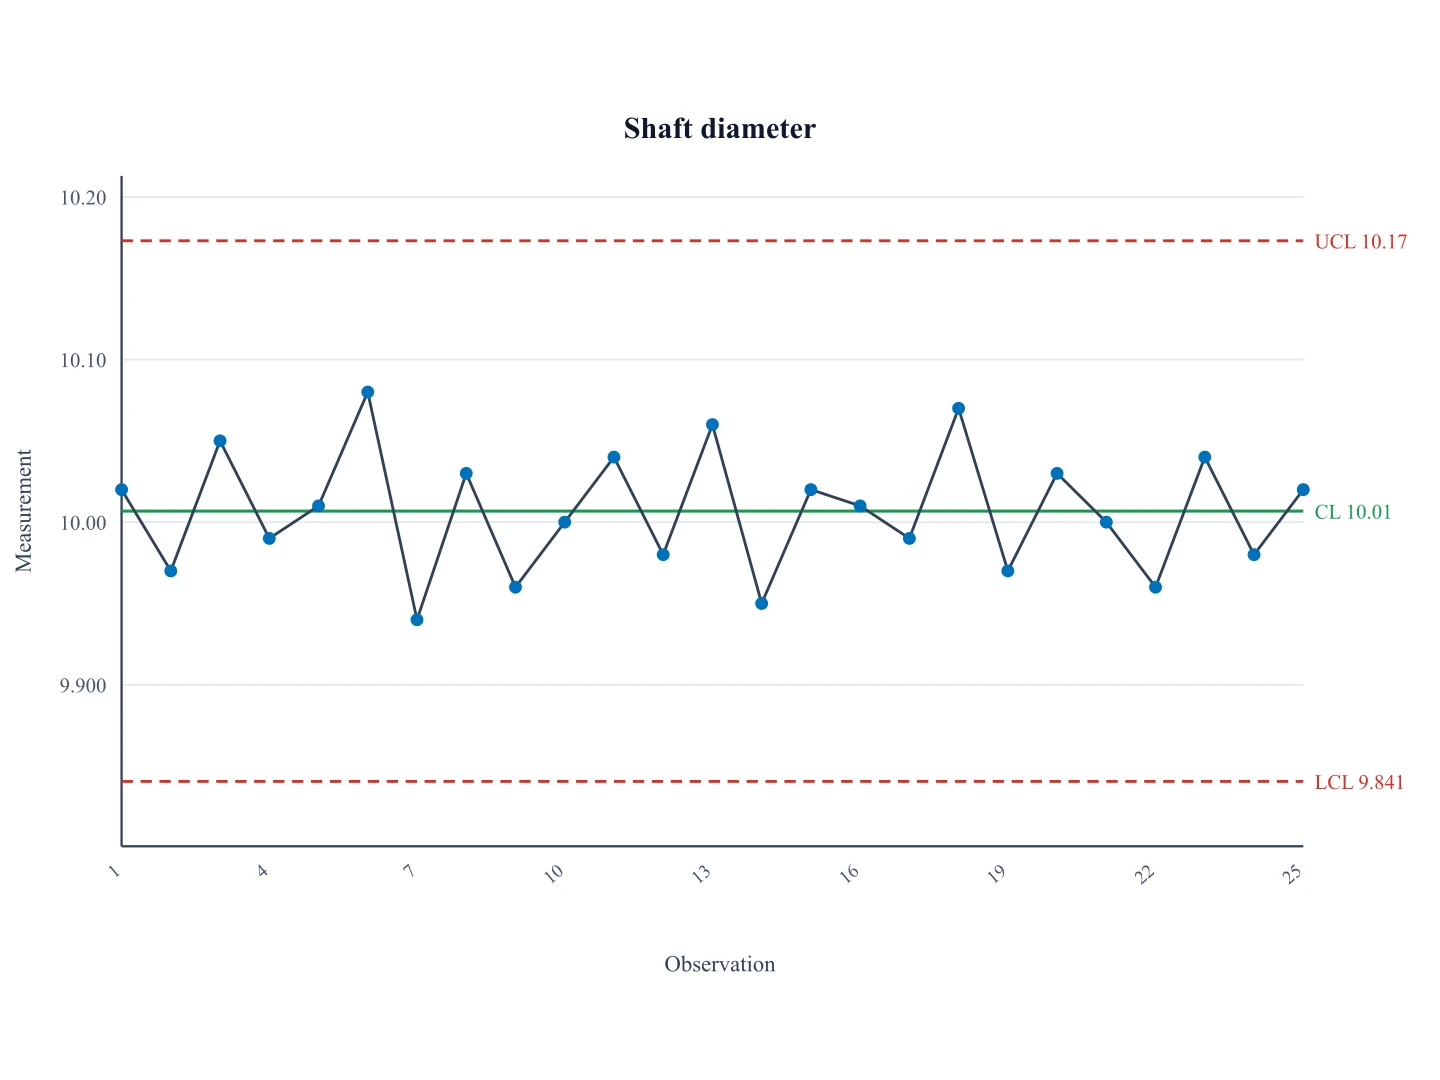
Monitor the improved process in the Control phase of DMAIC.