Issue Tree Generator with Driver Values
Write the root question, break it into branches and see the tree drawn left to right as you type. Paste an outline or CSV, mark hypotheses, add numbers for a driver tree, then export SVG, PNG, CSV or text.
Issue tree
Start with the root question and break it into branches. Up to 60 nodes and 7 levels.
Press Enter in a label to add the next node. Moving a node moves its branches with it.
Set a node to Driver and type a value on each driver leaf. Every node above them then shows the sum or the product of its driver branches; other nodes are left out, so a mostly qualitative tree can carry numbers on just a few branches. To subtract, enter the amount as a negative number, so profit = revenue + (−costs). A unit such as $, % or customers is only a label: enter percentages as decimals (0.2 for 20%).
Outline: one node per line; indent with Tab or spaces, or use a Markdown list (-, *, 1.). End a line with {hypothesis}, {driver, 120} or {product} to set the type, a leaf value or the rule. CSV: columns id,parent,label, plus optional type,value,rule; leave parent empty for the root.
17 nodes across 5 levels.
What is an issue tree?
An issue tree is a diagram that takes one problem, written as a question, and breaks it into smaller parts, level by level. The root sits on the left and each level to the right splits the node before it, so you can see every part of the problem on one page and decide which parts to examine first. It is also called a logic tree or, when the branches carry numbers, a driver tree.
The generator above draws the tree as you type. You can edit the nodes directly, paste an indented outline or a CSV from a spreadsheet, mark the end nodes as hypotheses and export the result.
How to make an issue tree
- 1
Write the root as a precise question
Name the decision-maker, the metric and the time frame: "Why did profit fall 20% year over year?" is workable, "Fix profitability" is not. Type it in the first row.
- 2
Split it into branches that do not overlap
Use the add-branch button to break a node into 2 to 5 parts. Good splits are mutually exclusive and together cover the whole: profit = revenue minus costs; revenue = volume times price.
- 3
Keep going until a branch can be tested
Stop splitting when you can answer a node with a data pull, a calculation or an interview. Mark those end nodes as hypotheses (diagnostic trees), or leave them as Question nodes that read as actions (solution trees).
- 4
Reorder and tidy
Move nodes up and down, or in and out a level. A moved node always takes its branches with it, and the picture redraws at once.
- 5
Add numbers if it is a driver tree
Tick "Driver tree: add numbers", type a value on each leaf and choose sum or product for each parent. Every parent recalculates as you type.
- 6
Export
Download SVG or PNG for a slide, the CSV for a spreadsheet, or the outline text to keep the tree as an editable list. Paste the outline or CSV back later to carry on editing.
Diagnostic, solution and driver trees
The layout is the same; the question you ask at each level decides which kind of tree you are building. Pick the type before you start, because mixing "why" and "how" branches on one tree is the most common reason a tree stops making sense.
| Type | Question at each level | What the ends are | Typical use |
|---|---|---|---|
| Diagnostic (why) tree | Why is this happening? | Each level asks "why?" or "what could explain it?". The ends are hypotheses you can prove or kill with data. | Falling sales, rising churn, missed deadlines, quality problems. |
| Solution (how) tree | How could we achieve this? | Each level asks "how?". The ends are actions or options you can compare and assign. | Growing revenue, cutting cost, entering a market, improving a process. |
| Driver tree | What moves this number? | Each level is a formula: the parent is the sum or product of its children. Leaves hold values. | Revenue and profit models, capacity planning, what-if sensitivity. |
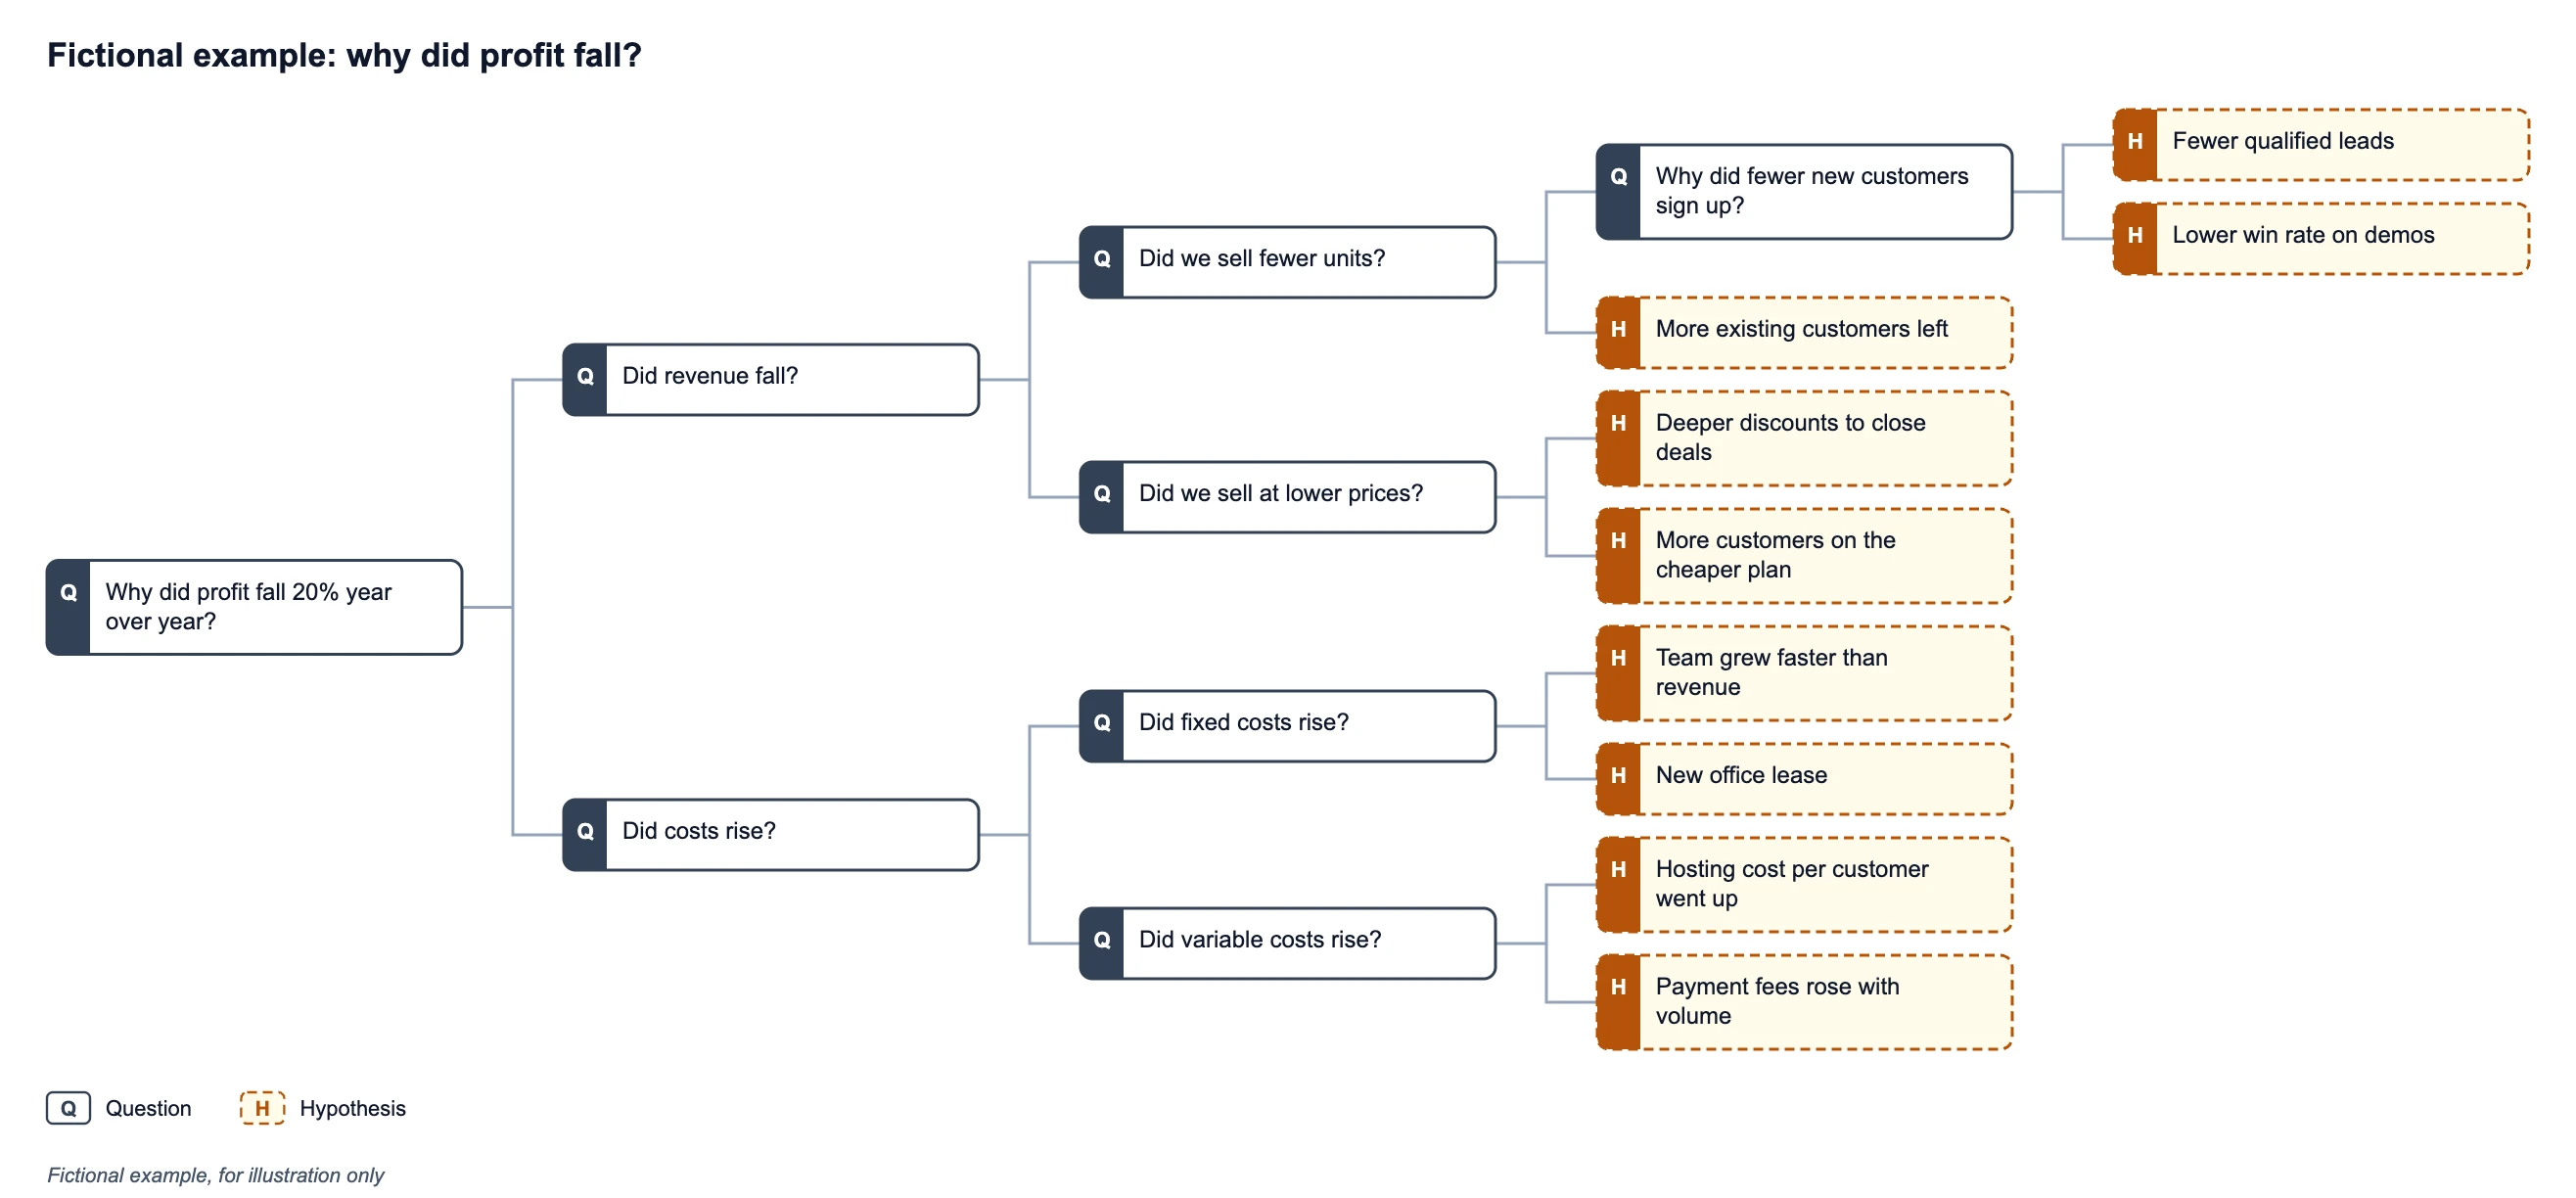
A diagnostic tree works best when it is hypothesis-driven: instead of collecting every fact first, you state a likely answer at the end of each branch, such as "win rate on demos fell", and then look for the one piece of data that would prove or kill it. Mark those end nodes as Hypothesis. Branches that fail the test are crossed out of the analysis, and the ones that survive tell you where to dig next.
Driver tree: turn the branches into a formula
Tick "Driver tree: add numbers" and each leaf gets a value box. Every node with branches then shows the sum or the product of its branches, whichever you choose, and the number updates as you type. There is no separate subtraction rule: to subtract, enter the amount as a negative number, so profit is revenue plus (minus costs).
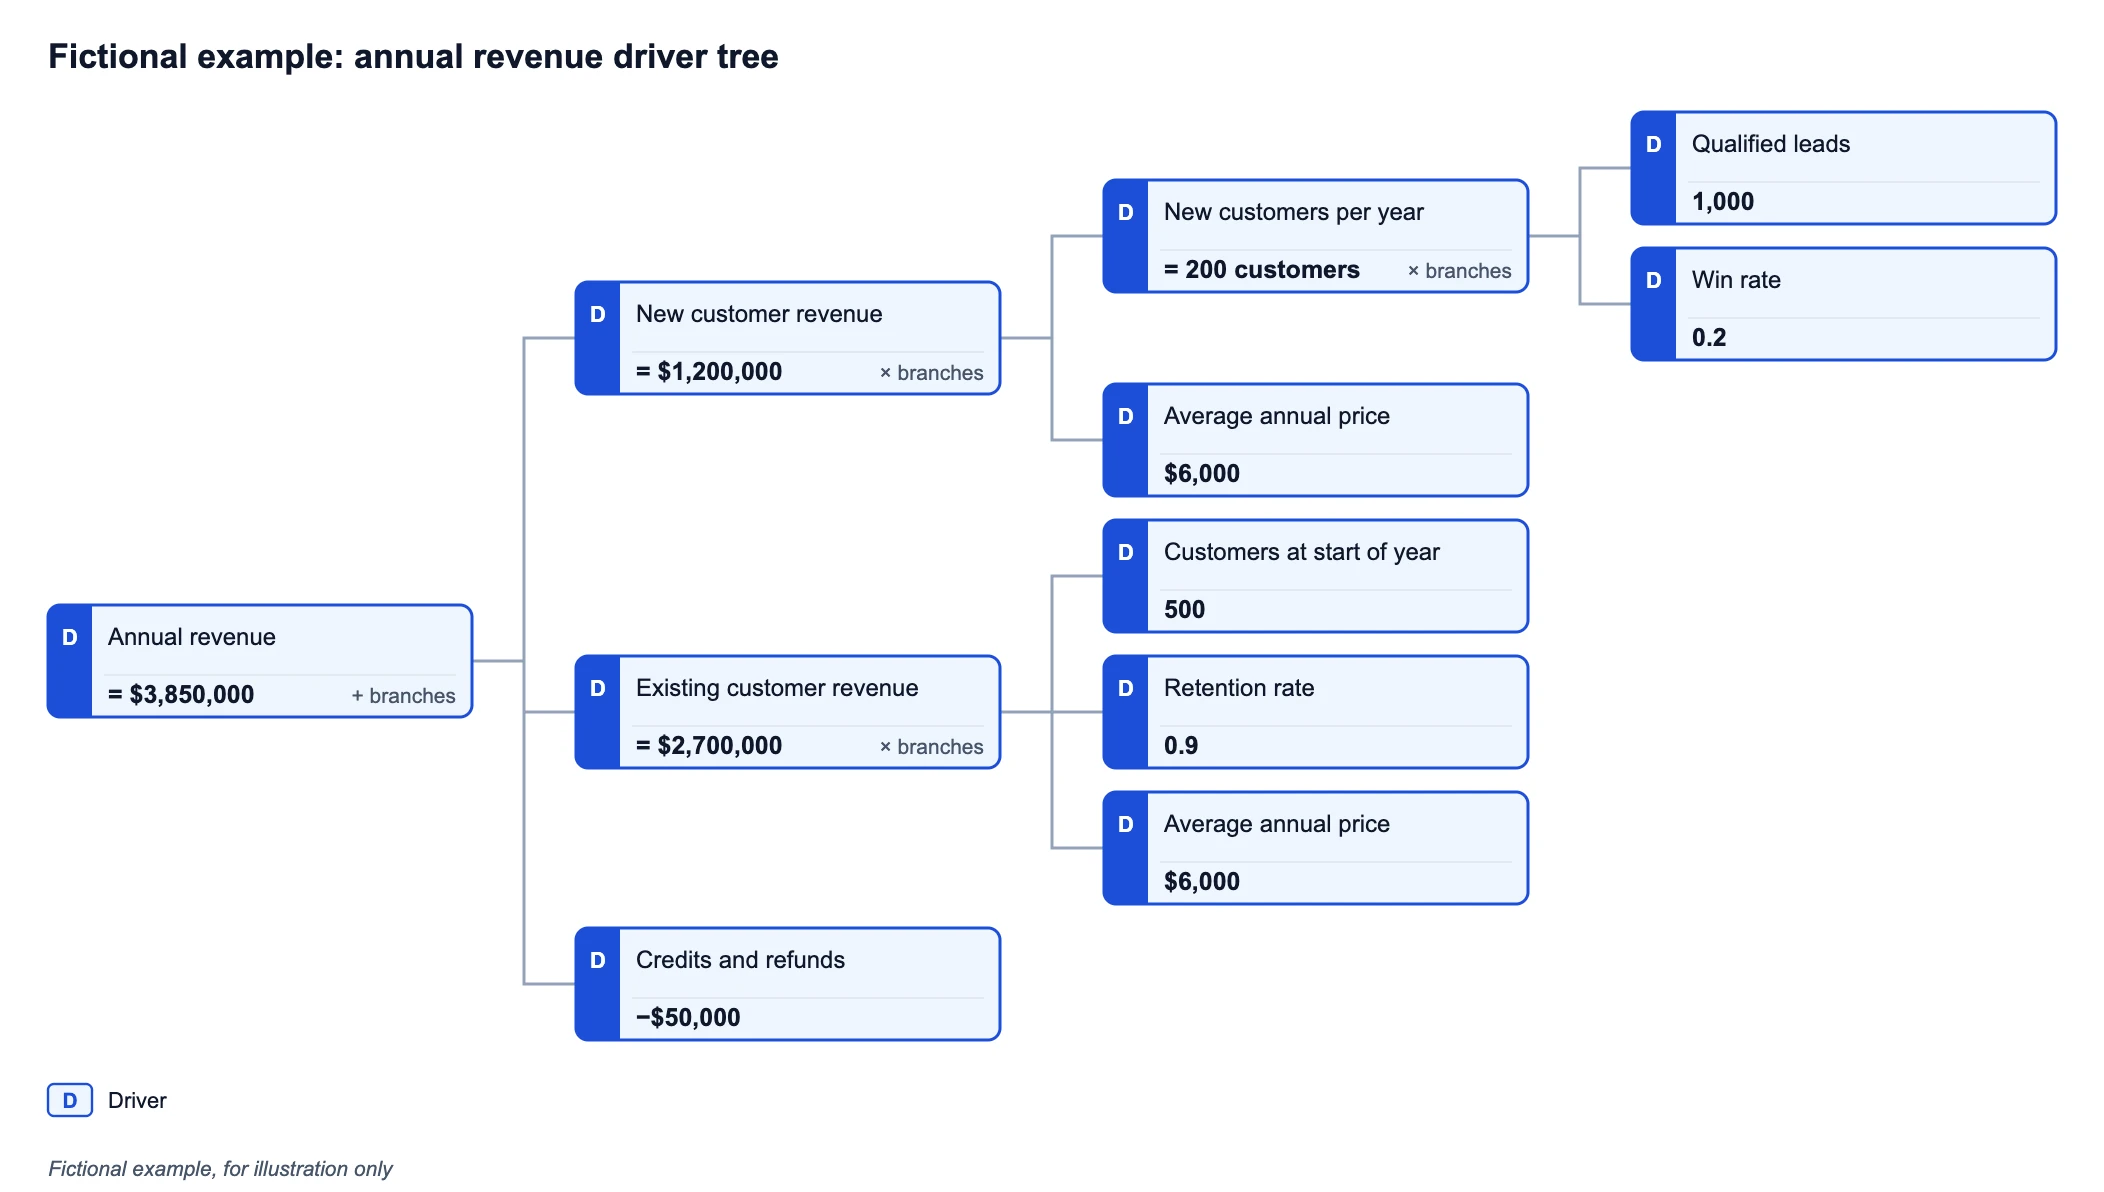
In the example below, new customers are 1,000 qualified leads times a 0.2 win rate, which is 200 customers. At an average price of $6,000 that is $1,200,000 of new customer revenue. Existing customers add 500 times a 0.9 retention rate times $6,000, which is $2,700,000. A credits line of minus $50,000 brings annual revenue to $3,850,000. Change the win rate and the whole chain recalculates, which makes it easy to see which lever moves the total most. A unit such as $ or % is only a label and never changes the maths, so enter a percentage as a decimal (0.2 for 20%), and type numbers without thousands separators.
Issue tree vs decision tree, fishbone and mind map
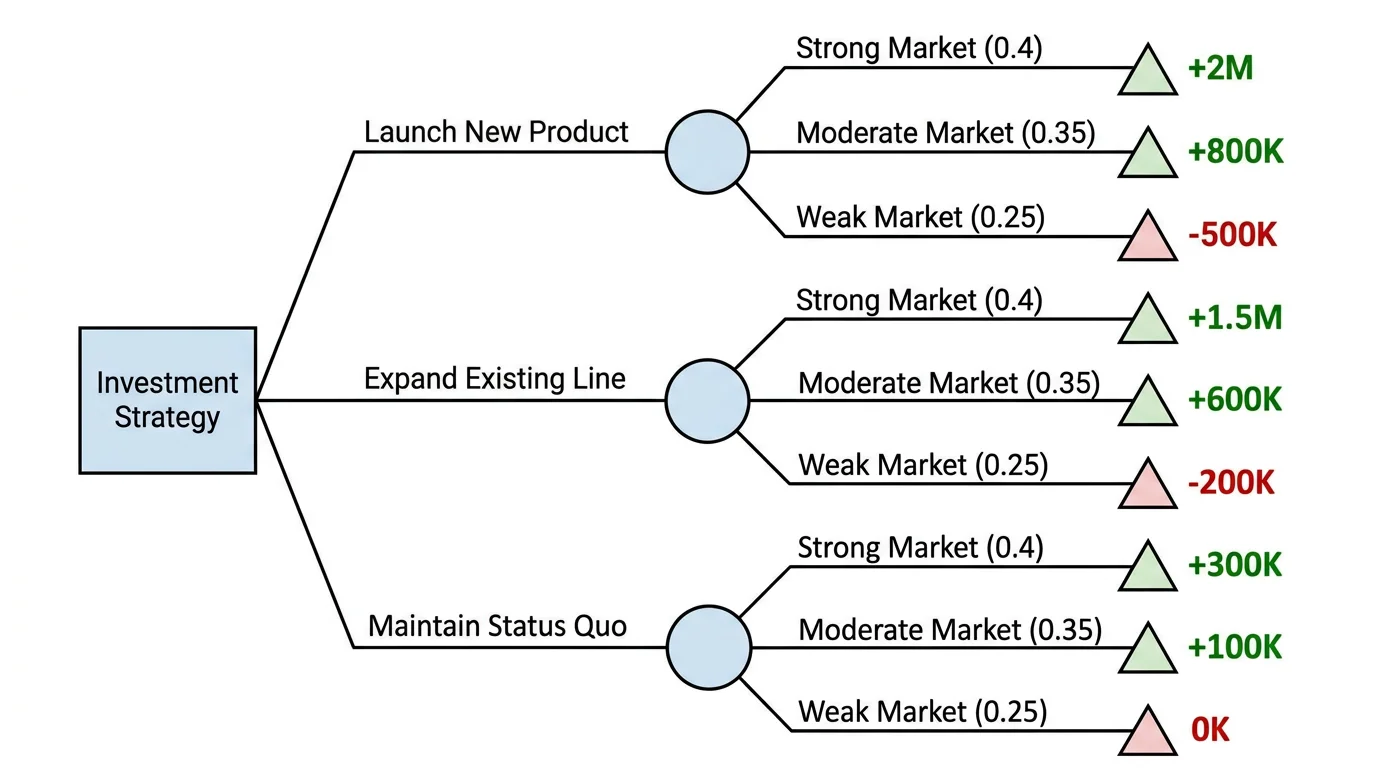
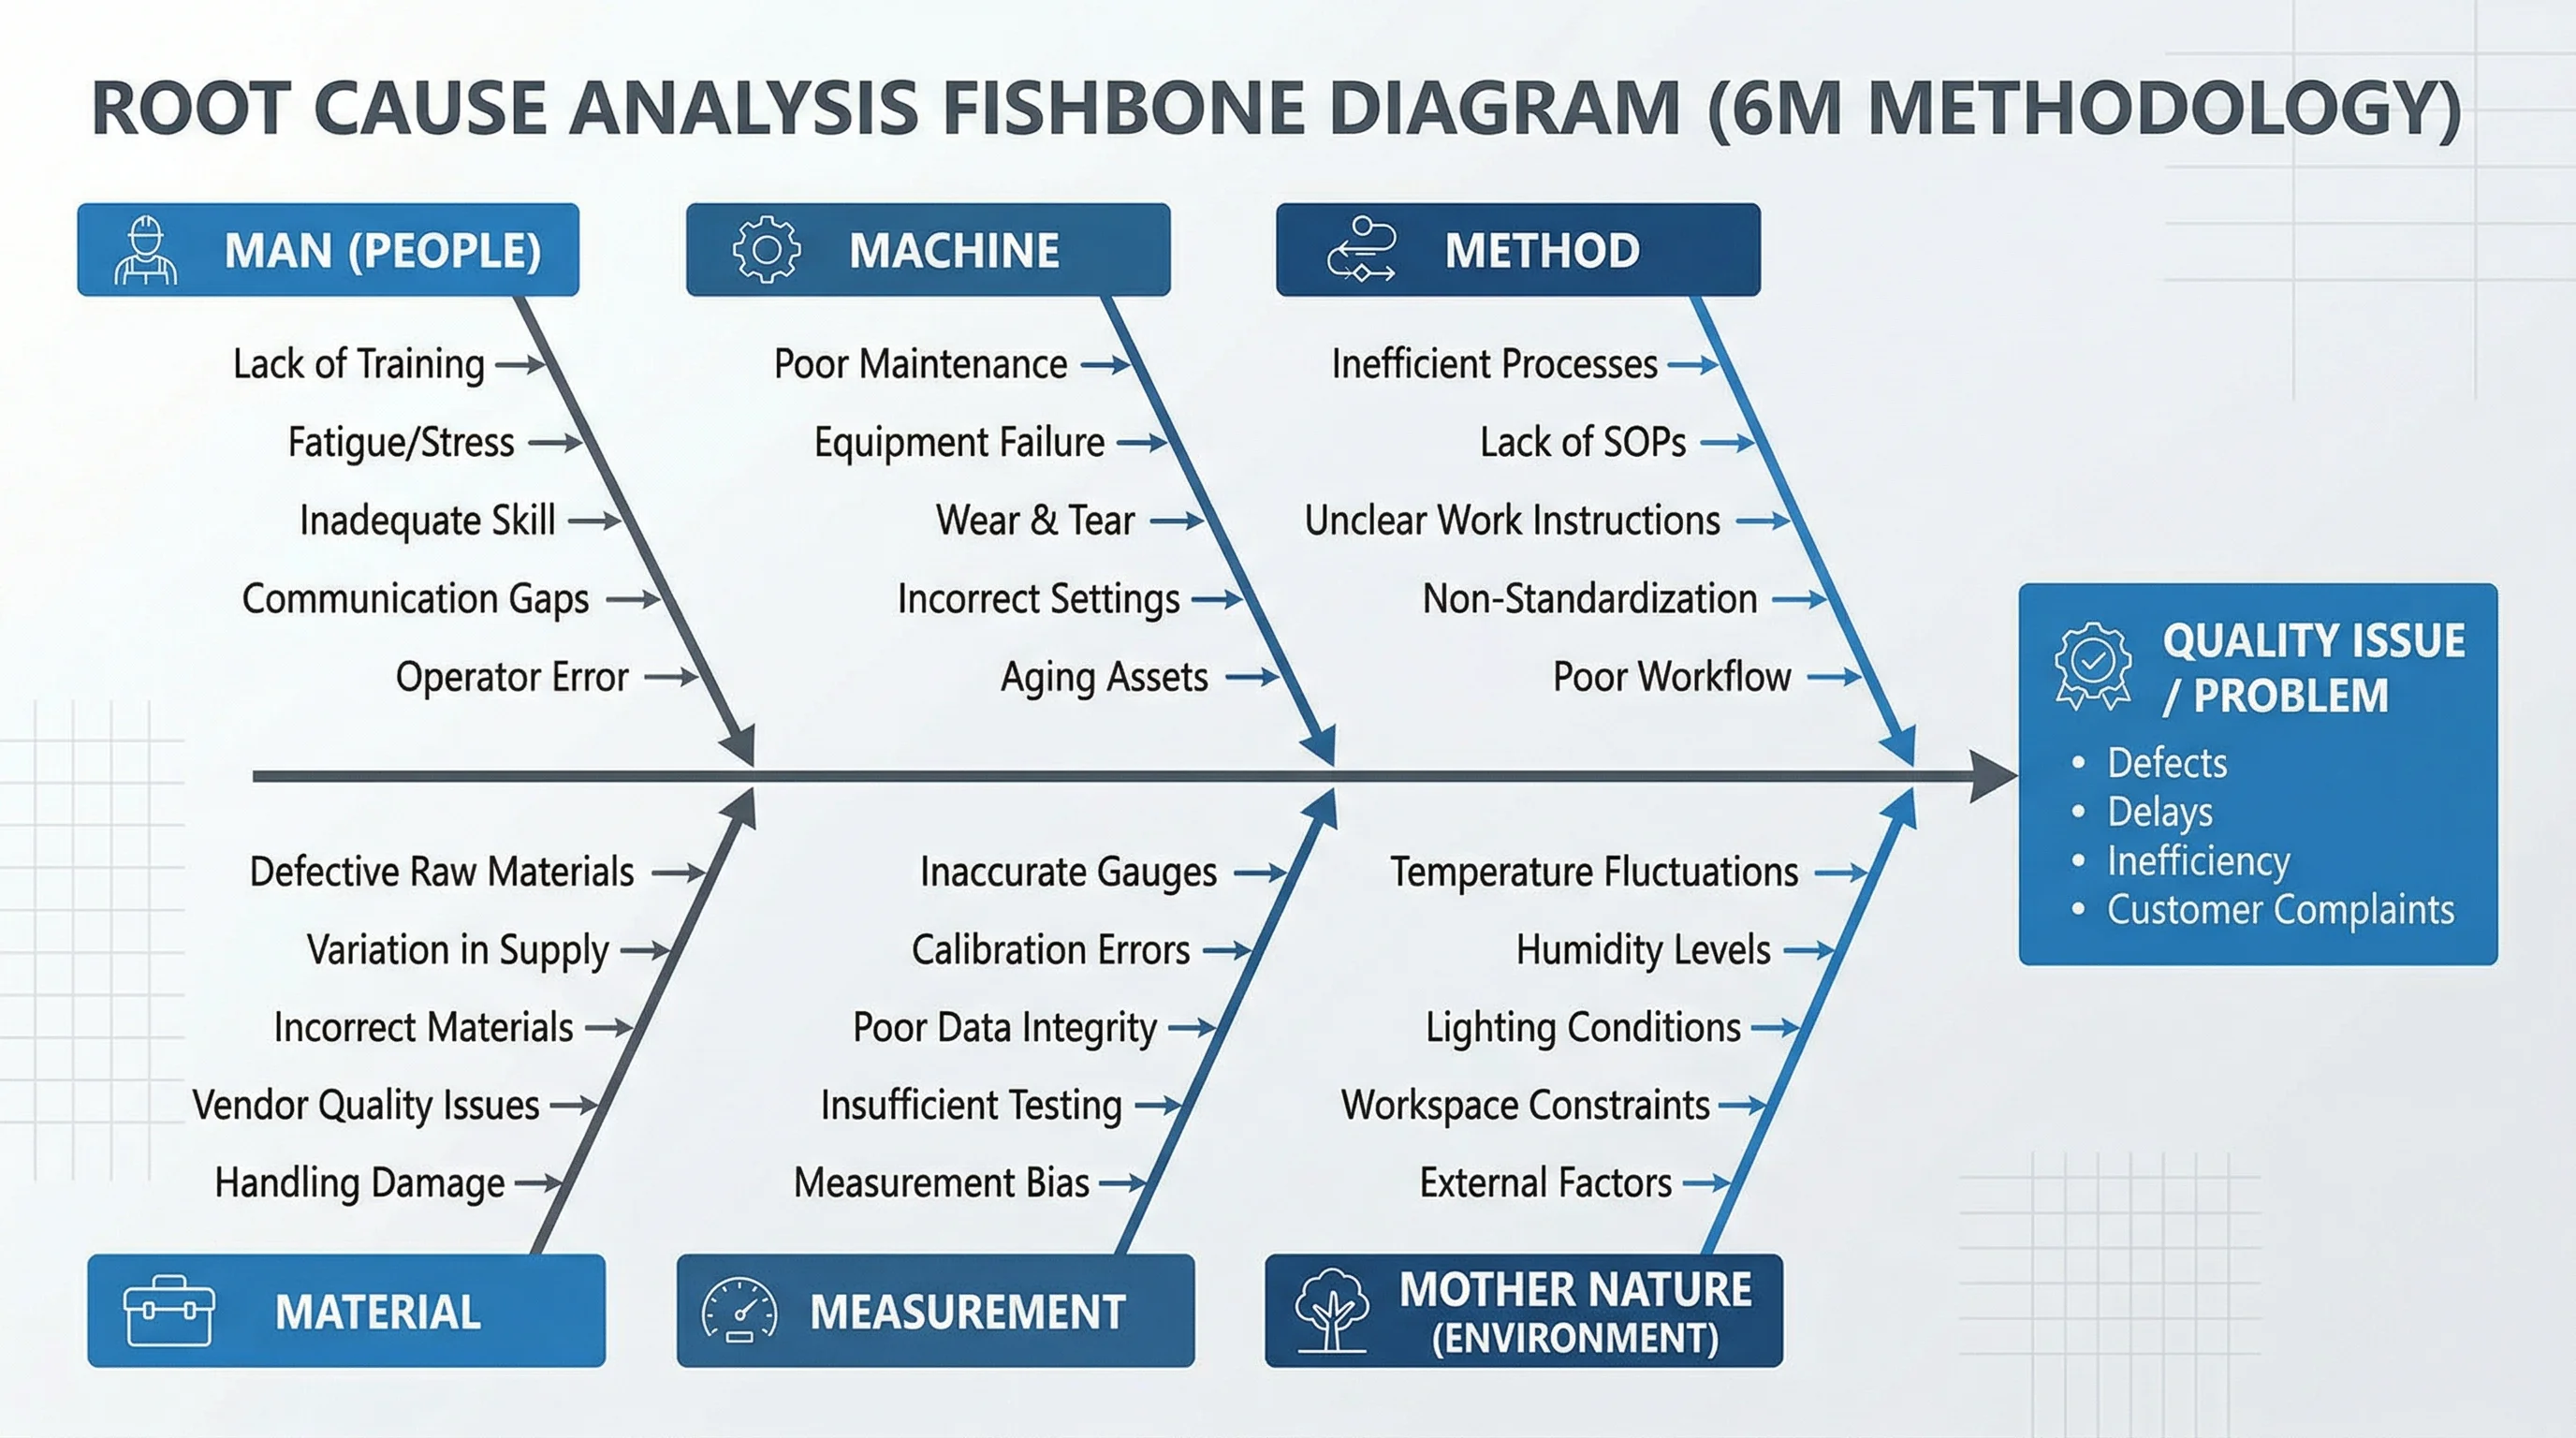
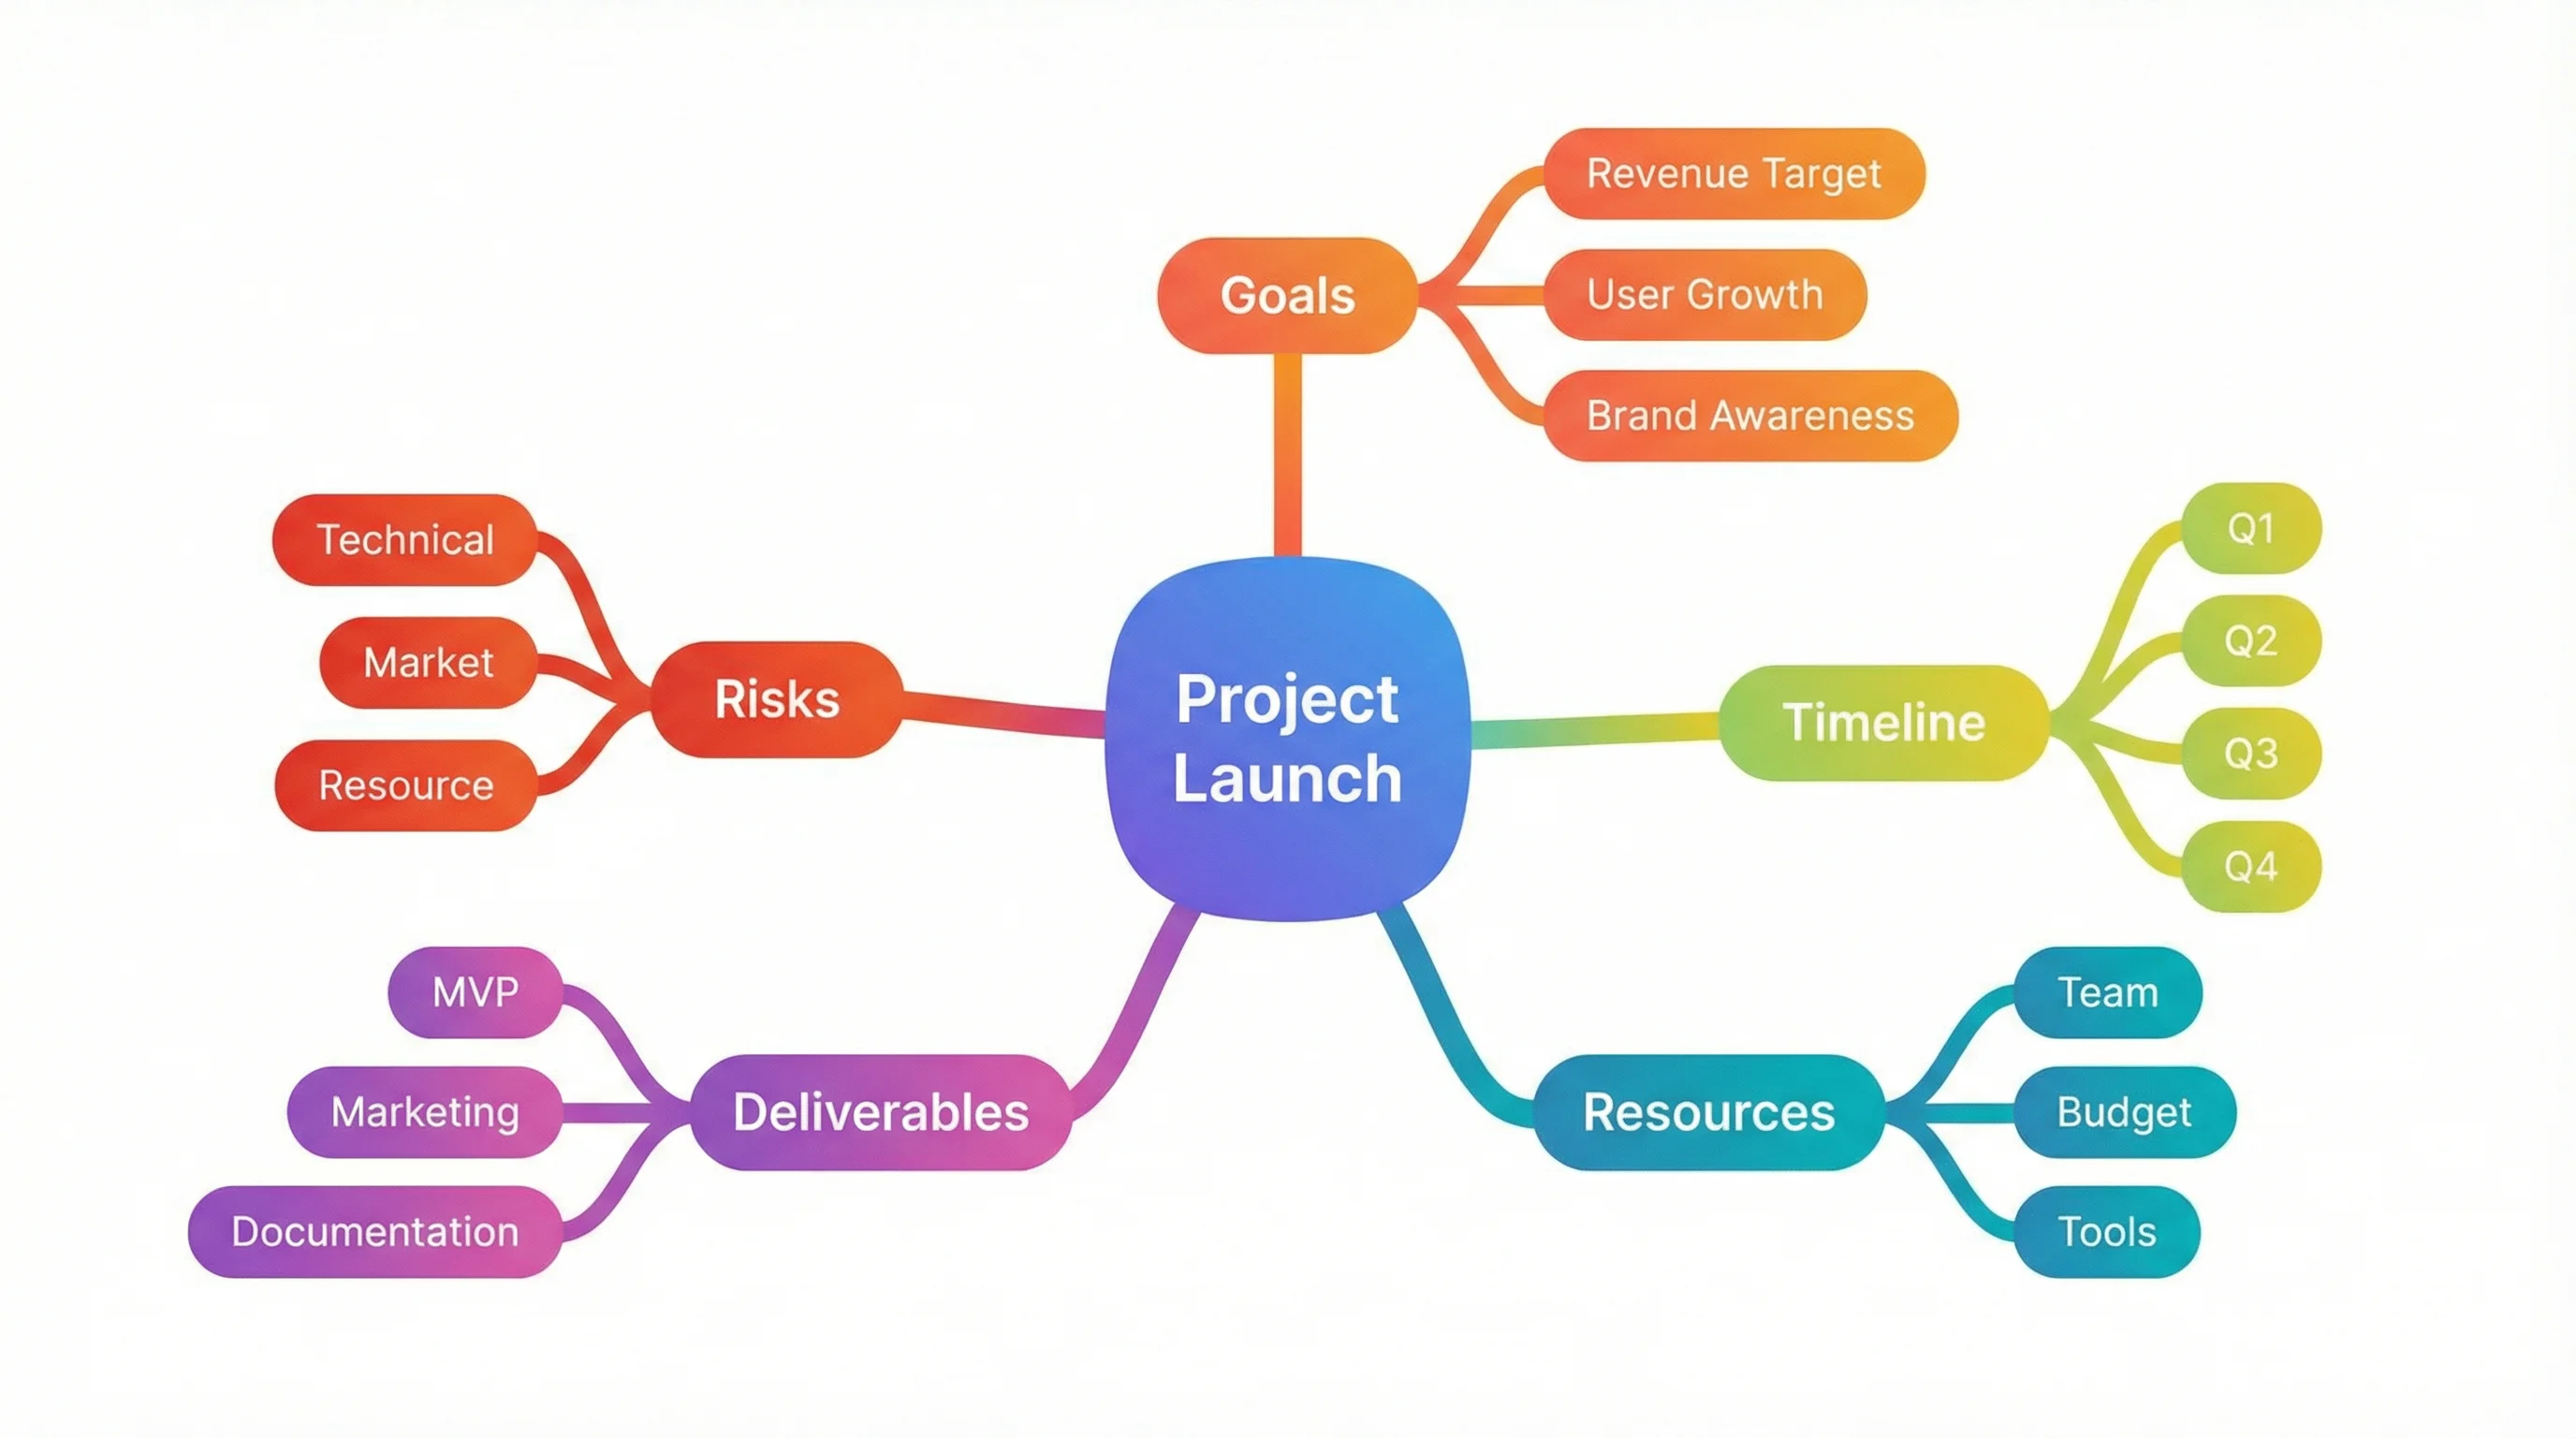
These four diagrams look alike but answer different questions. An issue tree splits a problem into parts; a decision tree compares choices under uncertainty; a fishbone diagram sorts the causes of one effect into fixed categories; and a mind map lets ideas spread in any direction.
| Diagram | Question it answers | Structure |
|---|---|---|
| Issue tree | Which parts of a problem should we look at? | Hierarchy of questions that splits one problem into non-overlapping parts |
| Decision tree | Which choice has the best expected outcome? | Choices, chance events and probabilities, ending in payoffs |
| Fishbone diagram | Which category of cause produced this effect? | One effect with causes grouped under fixed categories such as people or method |
| Mind map | What do I know or think about this topic? | Free association around a central idea, with no rule that branches must cover the whole |
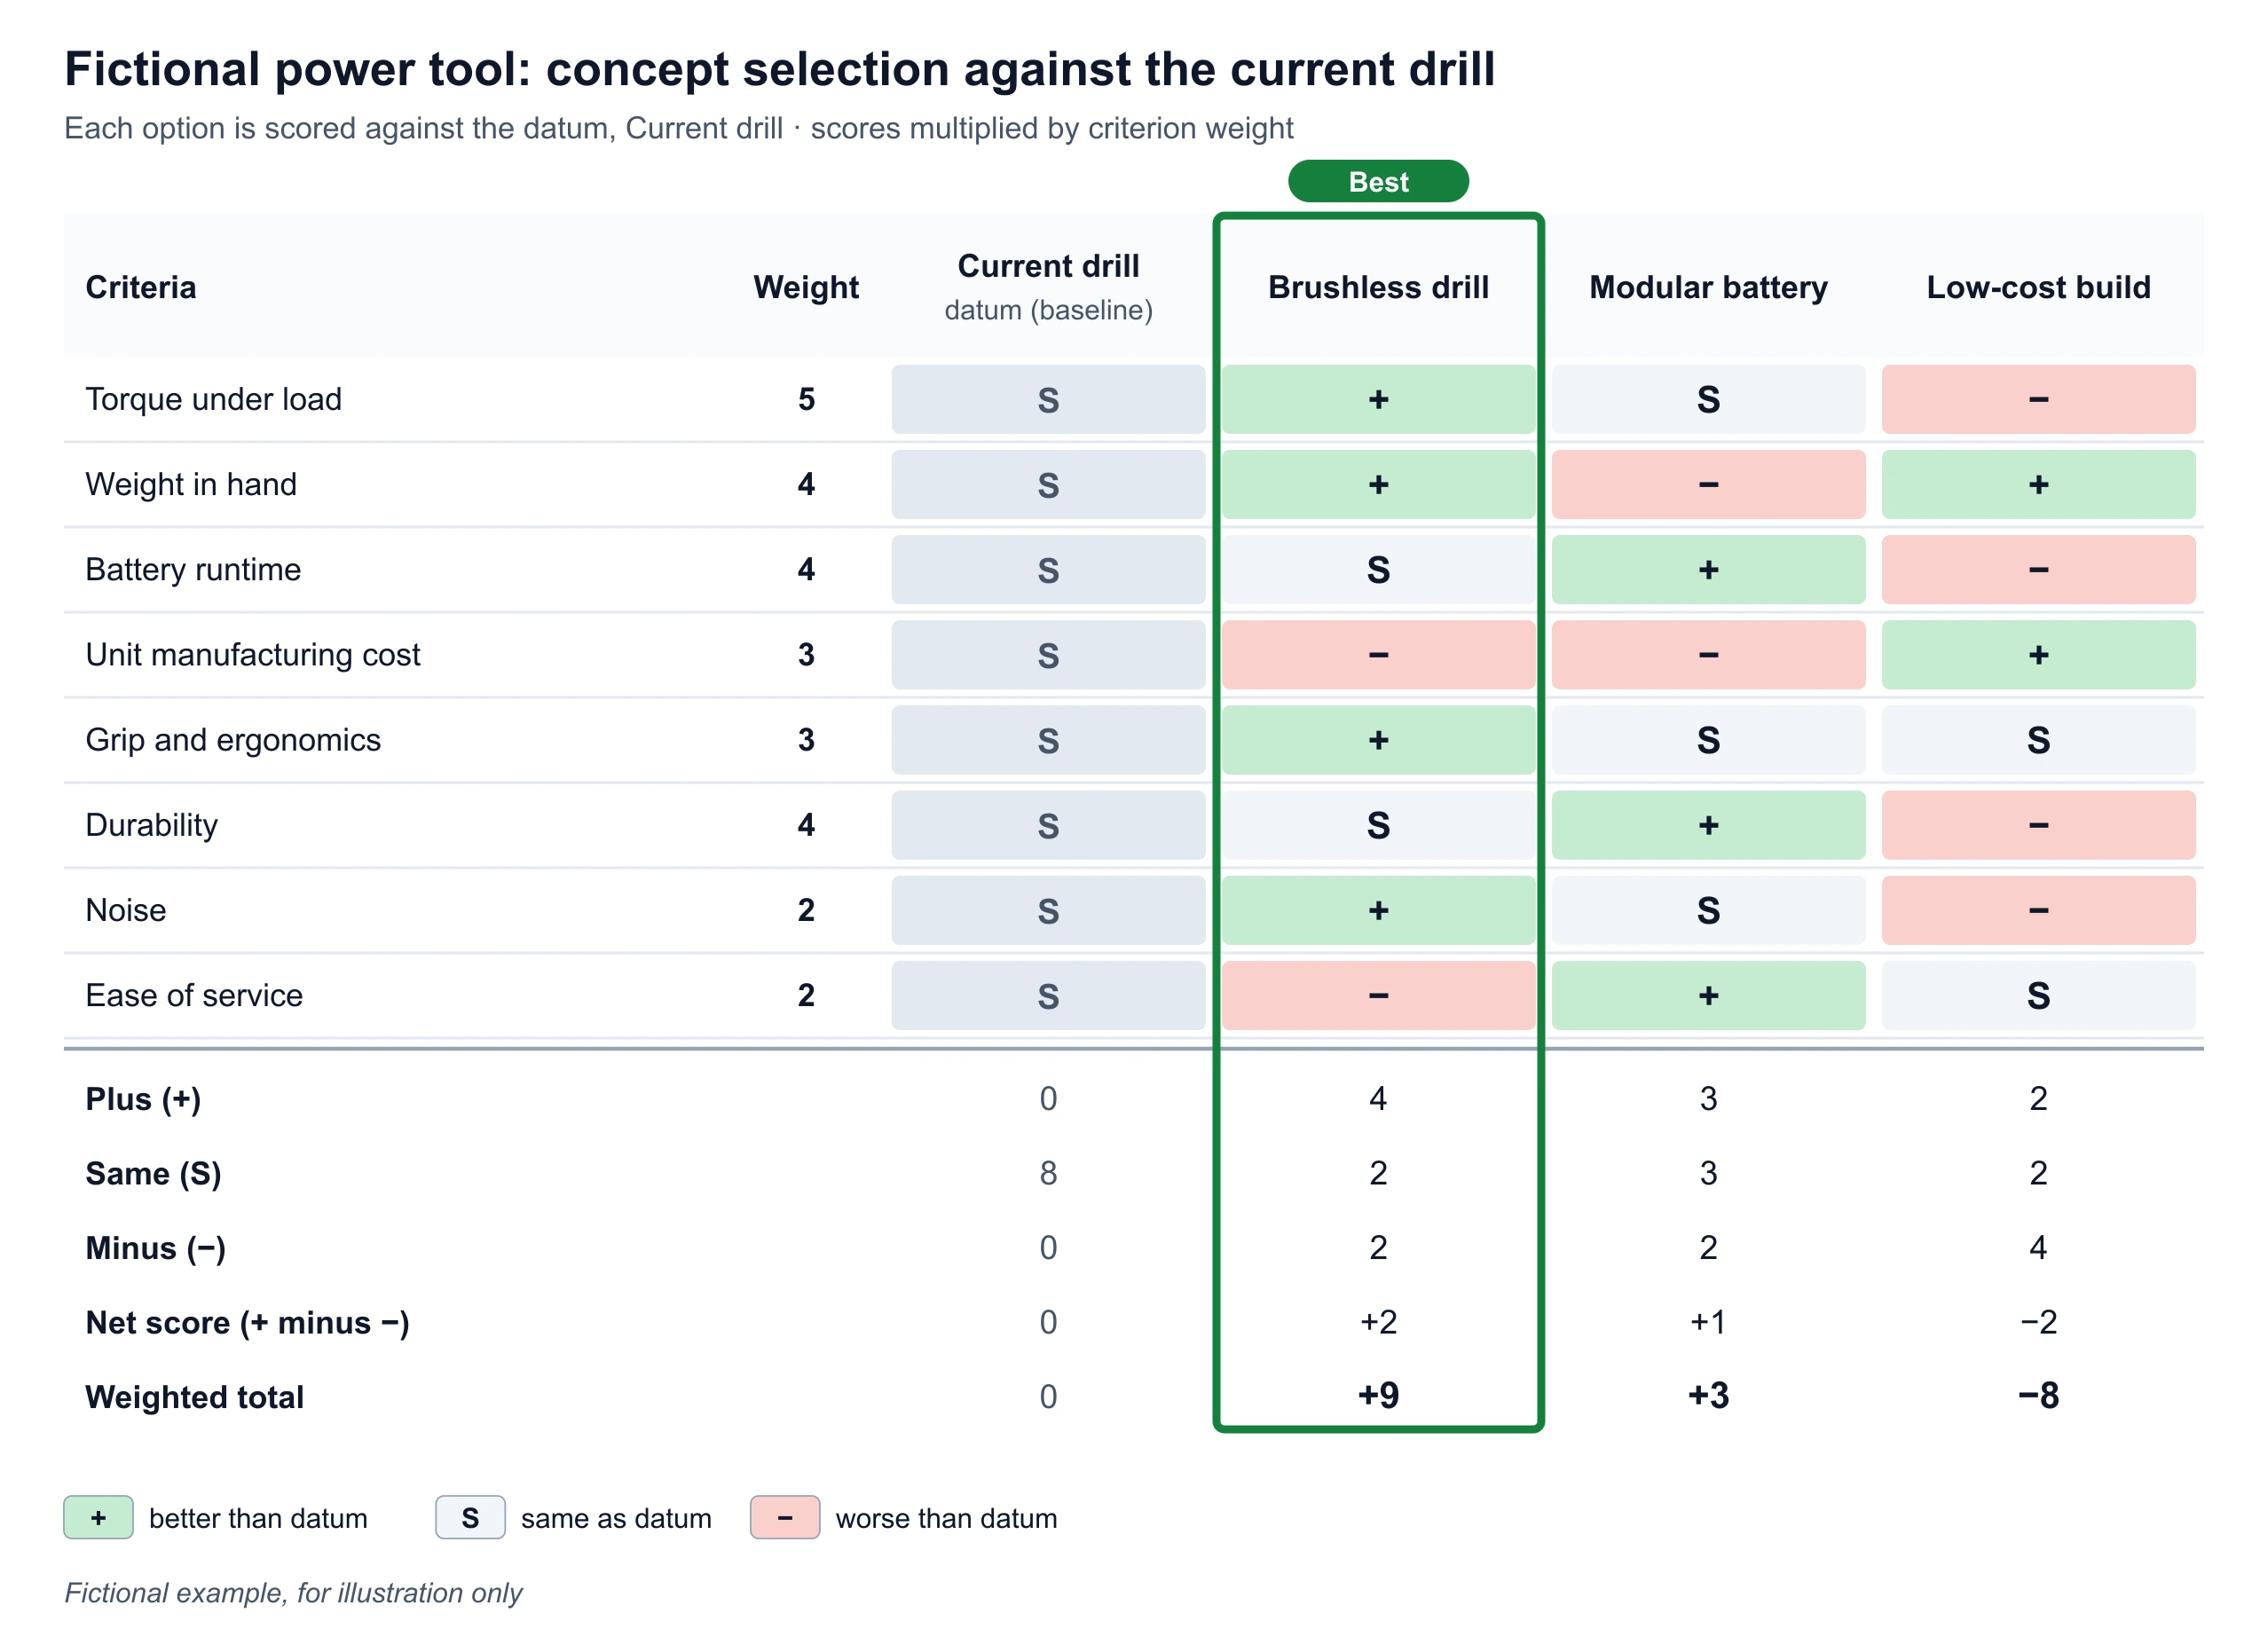
A common sequence is to brainstorm on a mind map, structure the problem as an issue tree, test the hypotheses, and then score the solution options with a Pugh matrix.
Common issue tree mistakes
- A root that is a topic, not a question. "Customer retention" invites a list of ideas; "Why did 12-month retention drop from 90% to 85%?" tells you what to split.
- Branches that overlap. If "marketing" and "ads" both appear on one level, the same cause is counted twice and the tree cannot be trusted as complete.
- Branches that leave a gap. Check each level by asking whether everything that could cause the parent is somewhere below it. If not, add an "other" branch or re-cut the split.
- Splitting on a different basis at the same level, for example by region on one branch and by product on its sibling. Pick one lens per level.
- Going deep on the first branch and stopping early on the rest. Aim for similar depth, then prioritize which branches to test first.
- Leaving the ends as vague topics. A leaf should be something you can check, such as "win rate on demos fell", not "sales issues".
Using it responsibly
The generator draws and calculates what you enter. It does not check that your branches are complete or non-overlapping, and it does not know whether your numbers are right. Treat the tree as a structured way to organize an analysis, and confirm the figures against your own data before sharing a driver tree with others.
Issue Tree Examples
Exact exports from the generator above, using fictional example data
Diagnostic Issue Tree: Why Did Profit Fall?
Exact render from fictional data: question nodes down to dashed hypothesis nodes, five levels deep.
Driver Tree: Annual Revenue from Four Levers
Exact render from fictional data: leaf values multiply and add up to $3,850,000.
Issue tree vs logic tree vs driver tree: are they the same thing?
The names overlap and different books use them differently. In this tool, "issue tree" is the general term for a hierarchy that breaks a problem into parts. A logic tree is the same structure described by its rule, that each level must be logically complete and non-overlapping. A driver tree is the quantitative version, where each parent is calculated from its children. You can build all three here: leave numbers off for a logic or issue tree, and switch them on for a driver tree.
What does MECE mean for an issue tree?
MECE stands for mutually exclusive, collectively exhaustive: the branches under a node should not overlap, and together they should cover everything the node could mean. This generator draws the structure you enter and does not check it for you, so test each split by asking "could one cause sit under two branches?" and "is anything missing?" before you rely on the tree.
Frequently Asked Questions
Related Problem-Solving Tools
 Research
Decision Tree Generator
Map choices, chance events and payoffs when you need to compare options.
 Quality
Fishbone Diagram Generator
Group the possible causes of one effect under categories such as people, method and machine.
 Research
Mind Map Generator
Brainstorm freely around a topic before you structure it into a tree.
 Business
Pugh Matrix Generator
Score the solution options your tree produced against a baseline.
 Business
Risk Heat Map Maker
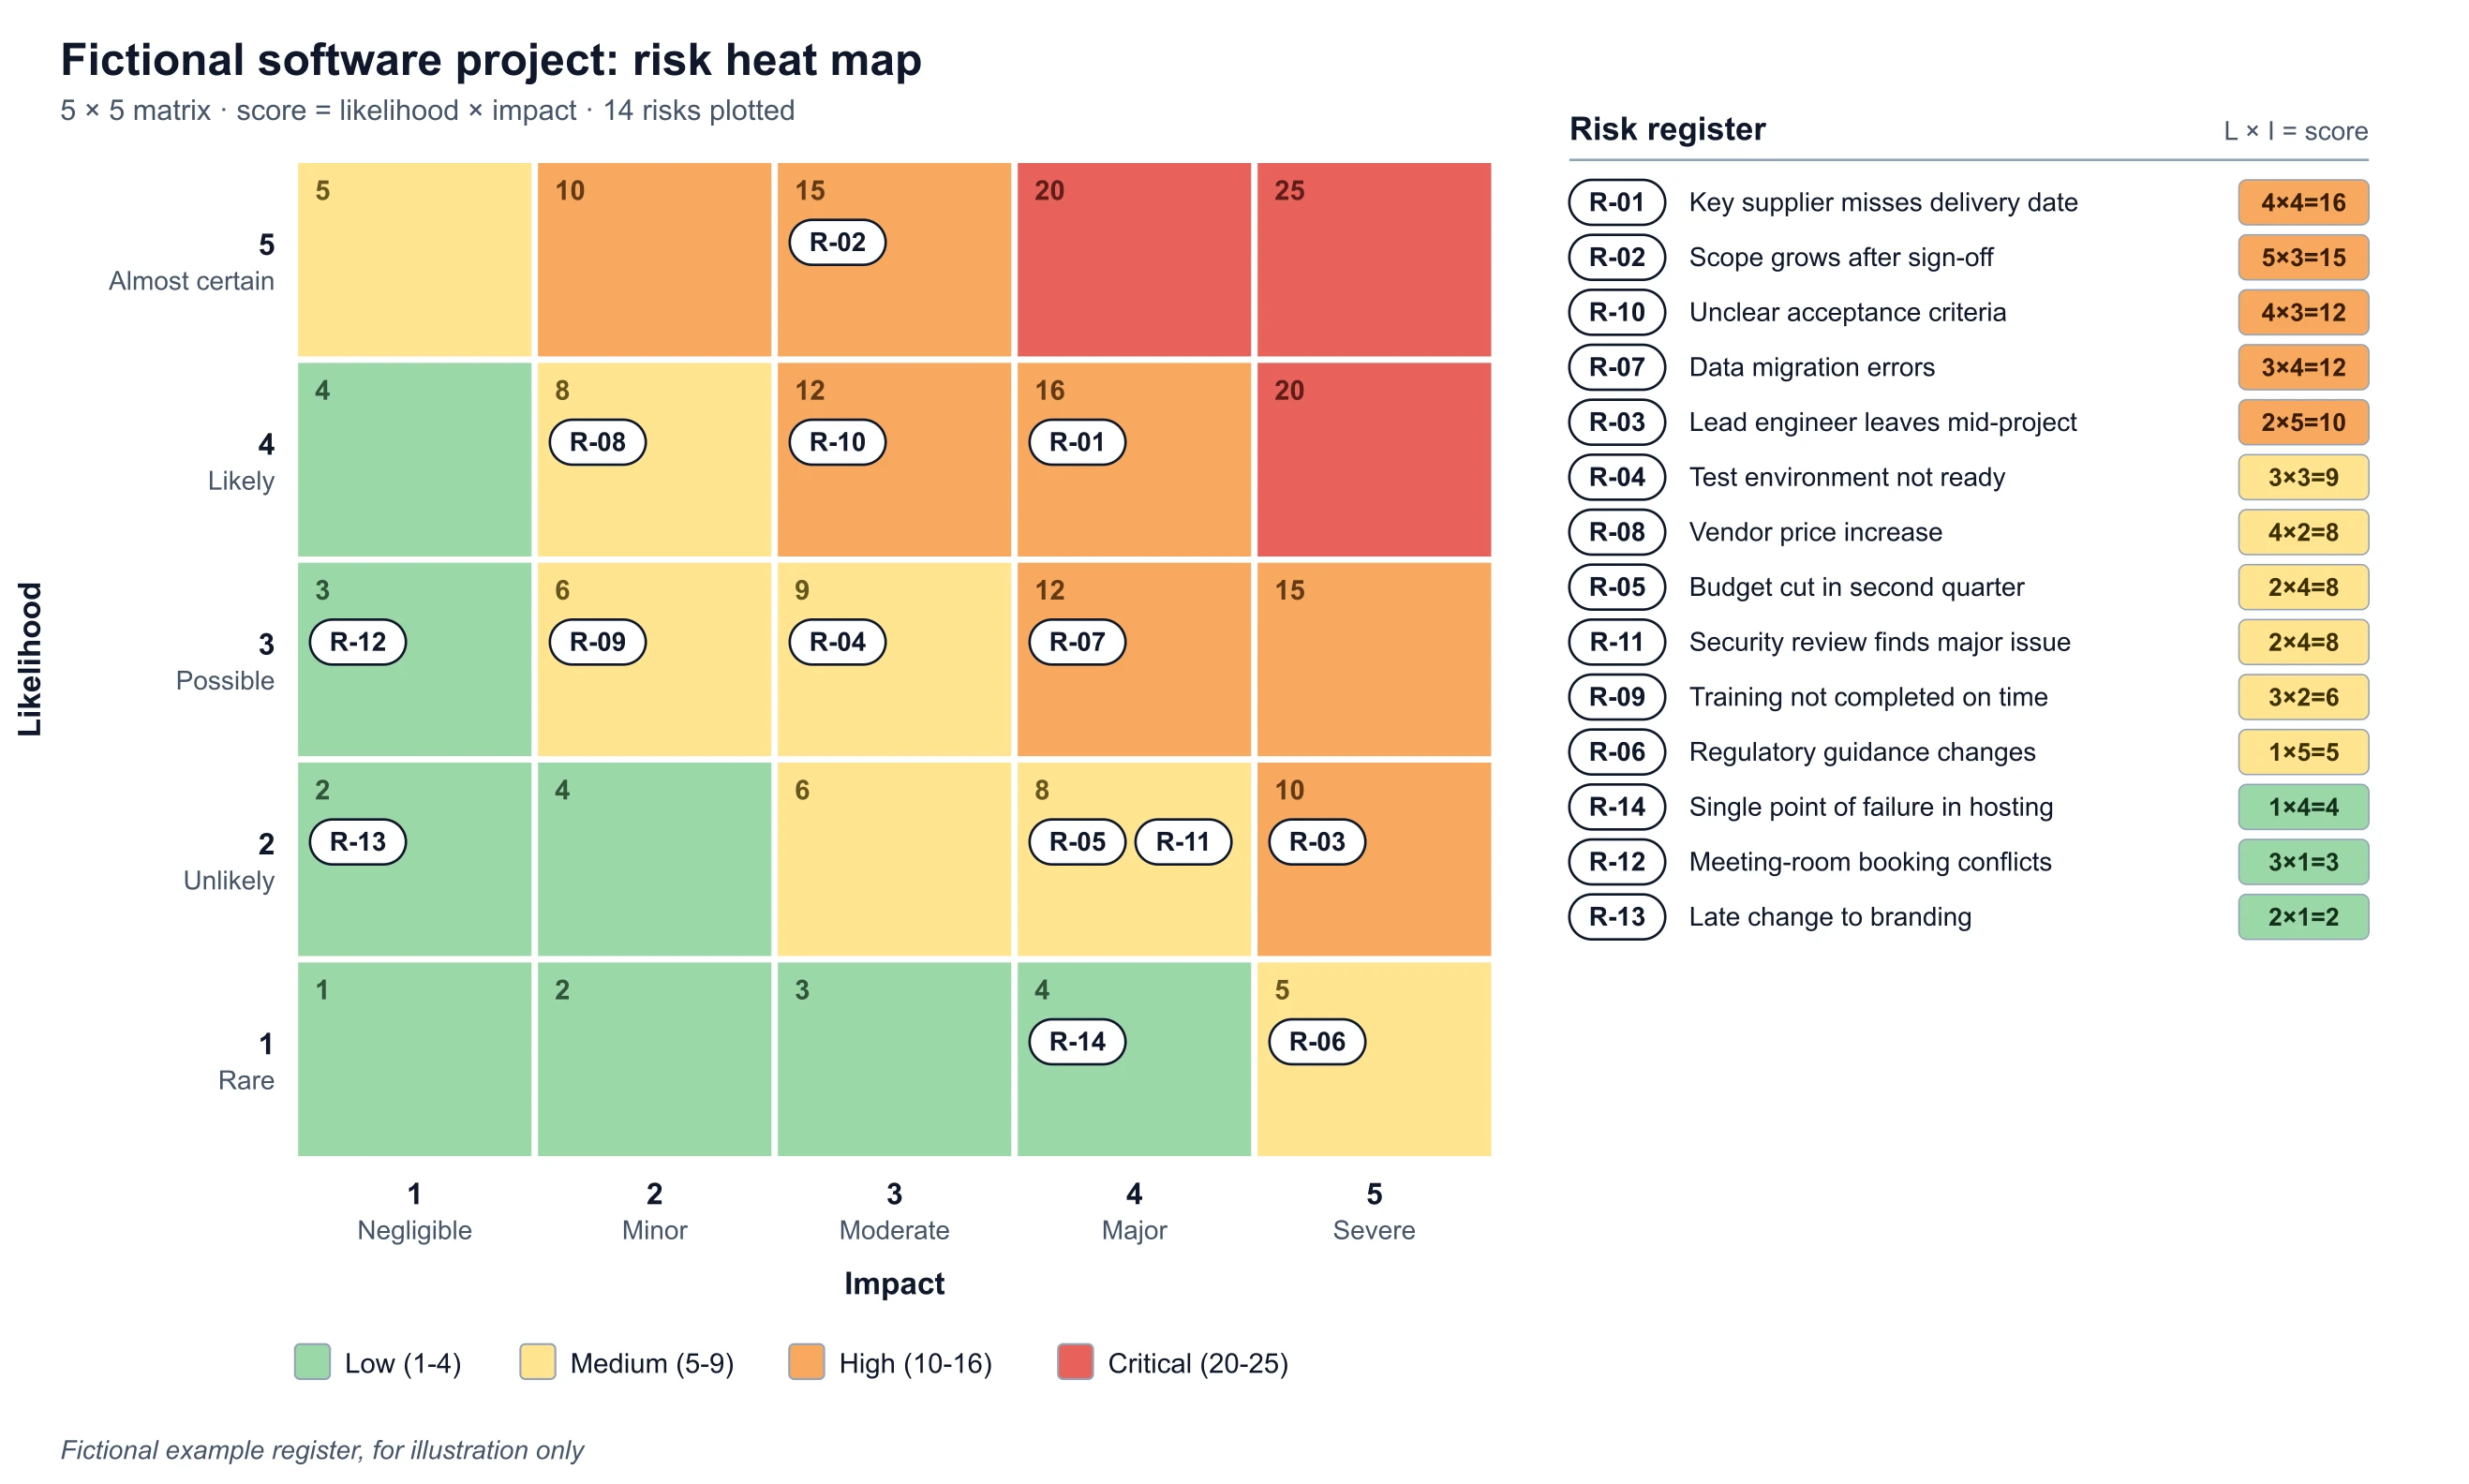
Rank the risks of the leading option on a likelihood and impact grid.