Ecomap Maker with Hartman Lines
Type the household in the center and the systems around it, such as school, work, health care and extended family. Pick the line for each relationship, add flow arrows and notes, import or export CSV, and download SVG or PNG. Everything is drawn in your browser.
Ecomap
Describe the household in the middle, then add the systems around it. 3 to 12 systems. Use fictional or de-identified details only.
Columns: system,relationship,flow,note. relationship is strong, tenuous or stressful. flow is none, to-center (toward the household), to-system or both. The center circle and title are set above and are not part of the CSV.
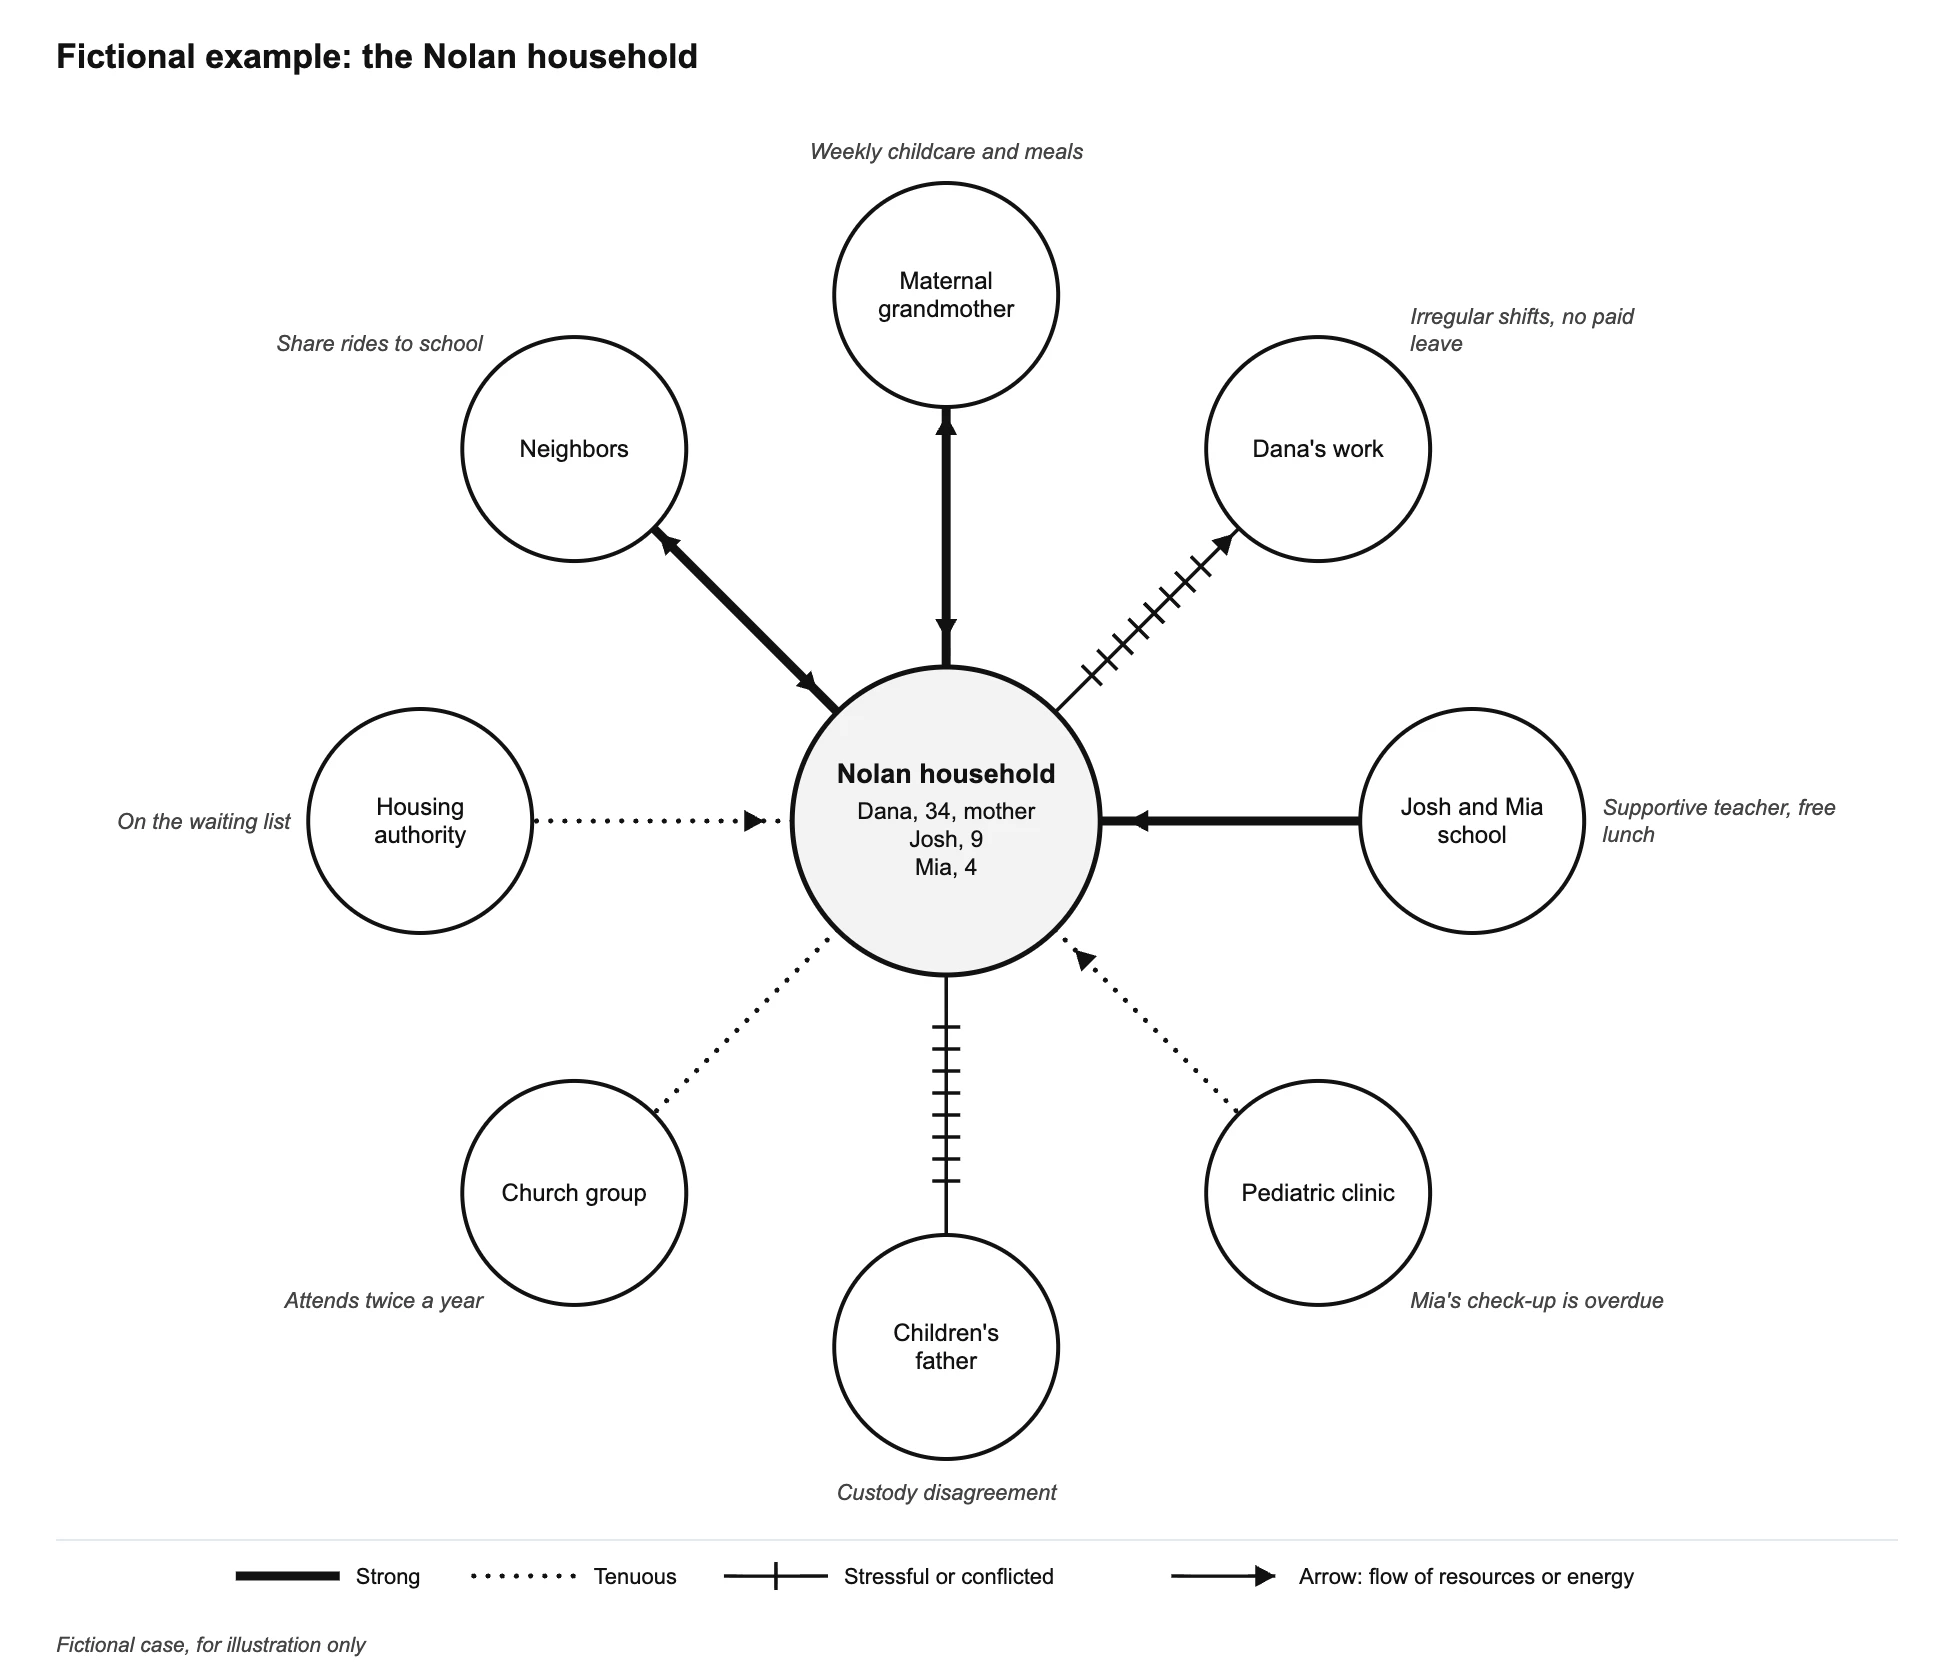
8 outside systems around Nolan household.
What is an ecomap?
An ecomap (also written eco-map) is a diagram of a person or household and the systems around them. The household goes in a large circle in the middle. Work, school, health care, extended family, friends, faith, housing and other systems each get a circle of their own, and a line between the center and each circle shows what that connection is like. Social workers, nurses and family medicine teachers use it to see, on one page, where a person gets support, where it is thin and where it causes stress.
The generator above draws the ecomap as you type. Add systems, choose the line and the arrow for each one, write a short note, and export the result. The legend is part of the image.
Ecomap symbols and what they mean
The conventions below follow Ann Hartman's article Diagrammatic Assessment of Family Relationships (Social Casework, October 1978), which introduced the ecomap. The quoted phrases are from that article.
| Symbol | Meaning | Source wording |
|---|---|---|
| Thick solid line | Strong or important connection | Hartman: "a solid or thick line represents an important or strong connection". |
| Dotted line | Tenuous connection | Hartman: "a dotted line a tenuous connection". |
| Line crossed by short marks | Stressful or conflicted relationship | Hartman: "jagged marks across the line". |
| Arrow along the line | Direction of the flow of resources, energy or interest | An arrow toward the center means the household receives; away means it gives; both means mutual. |
Reference: Hartman, A. (1978). Diagrammatic assessment of family relationships. Social Casework, 59(8), 465-476. Hartman dates the design of the eco-map to 1975; the article is the 1978 publication.
How to make an ecomap
- 1
Name the center
Type the person or household in the center circle. Add household members, one per line, with the details the assessment needs, such as age and role. Use first names, initials or a code, never a full real identity.
- 2
List the systems around it
Add one row per outside system: work, school, health care, extended family, friends, faith community, housing, income support, recreation and any other part of the life space. Rows can be moved up and down, and the diagram redraws as you type.
- 3
Choose the line
For each system pick Strong, Tenuous or Stressful. Strong is a thick solid line, tenuous is a dotted line, and stressful is a thin line crossed by short marks.
- 4
Add an arrow if energy or resources flow
Pick into the household, out to the system, or both ways. Leave it on No arrow when you only want to show that a connection exists.
- 5
Write a short note
A few words next to the system, for example "weekly childcare" or "waiting list", say more than the line style can. The note is printed outside the circle so it never covers a line.
- 6
Export
Download SVG or PNG for a case file or a slide, or the CSV to keep the systems as an editable table. Paste or upload the CSV later to carry on editing.
Ecomap vs genogram
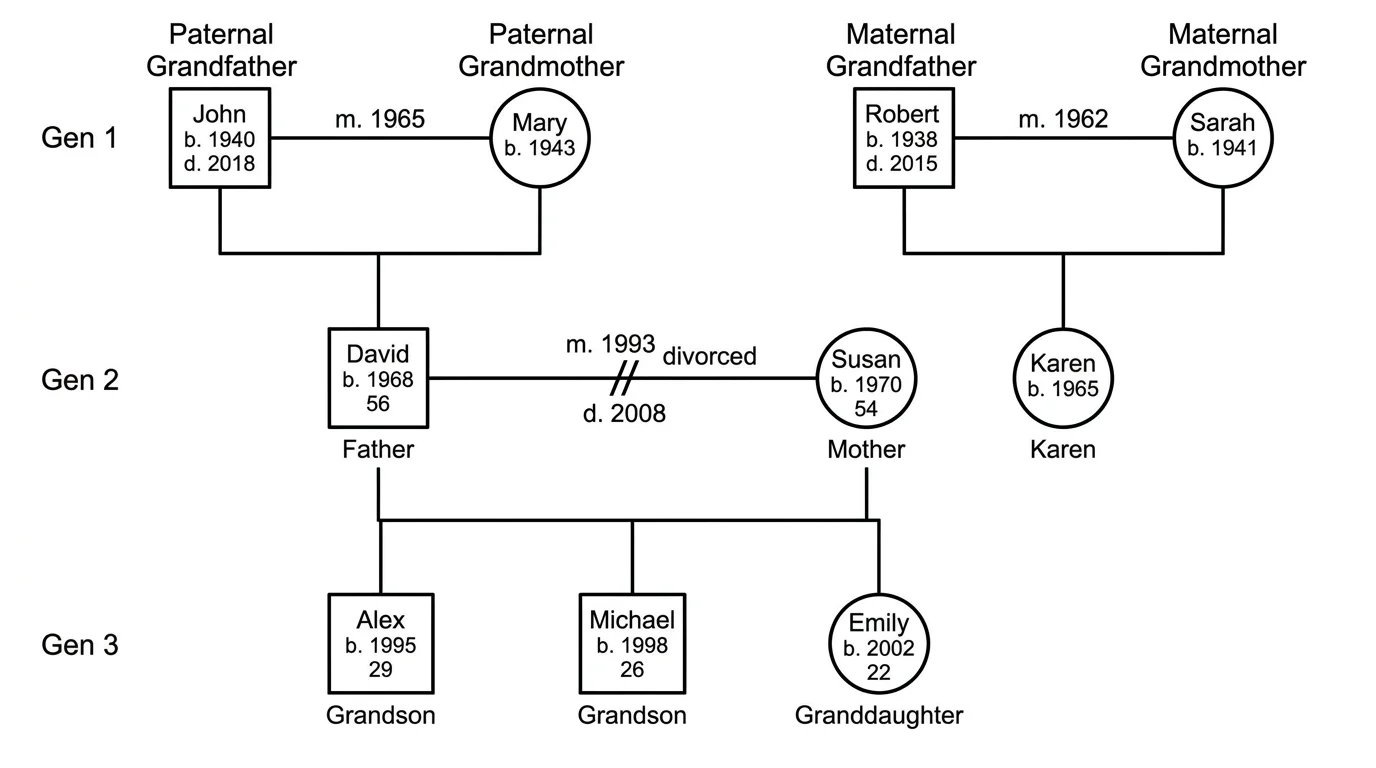
The two diagrams answer different questions and are often used side by side. A genogrammaps the family itself: who its members are, how they are related and what patterns run across generations. An ecomap leaves the family structure inside the center circle and maps what lies outside it. Hartman's 1978 article describes both.
| Diagram | What it shows | Question it answers | Lines |
|---|---|---|---|
| Ecomap | The household and the systems around it | Who and what is connected to this person or family, and how well is it working? | Strong, tenuous and stressful lines, plus flow arrows |
| Genogram | Family members and their relationships across generations | Who is in this family, how are they related, and what patterns repeat? | Squares and circles joined by marriage and descent lines, with relationship lines between members |
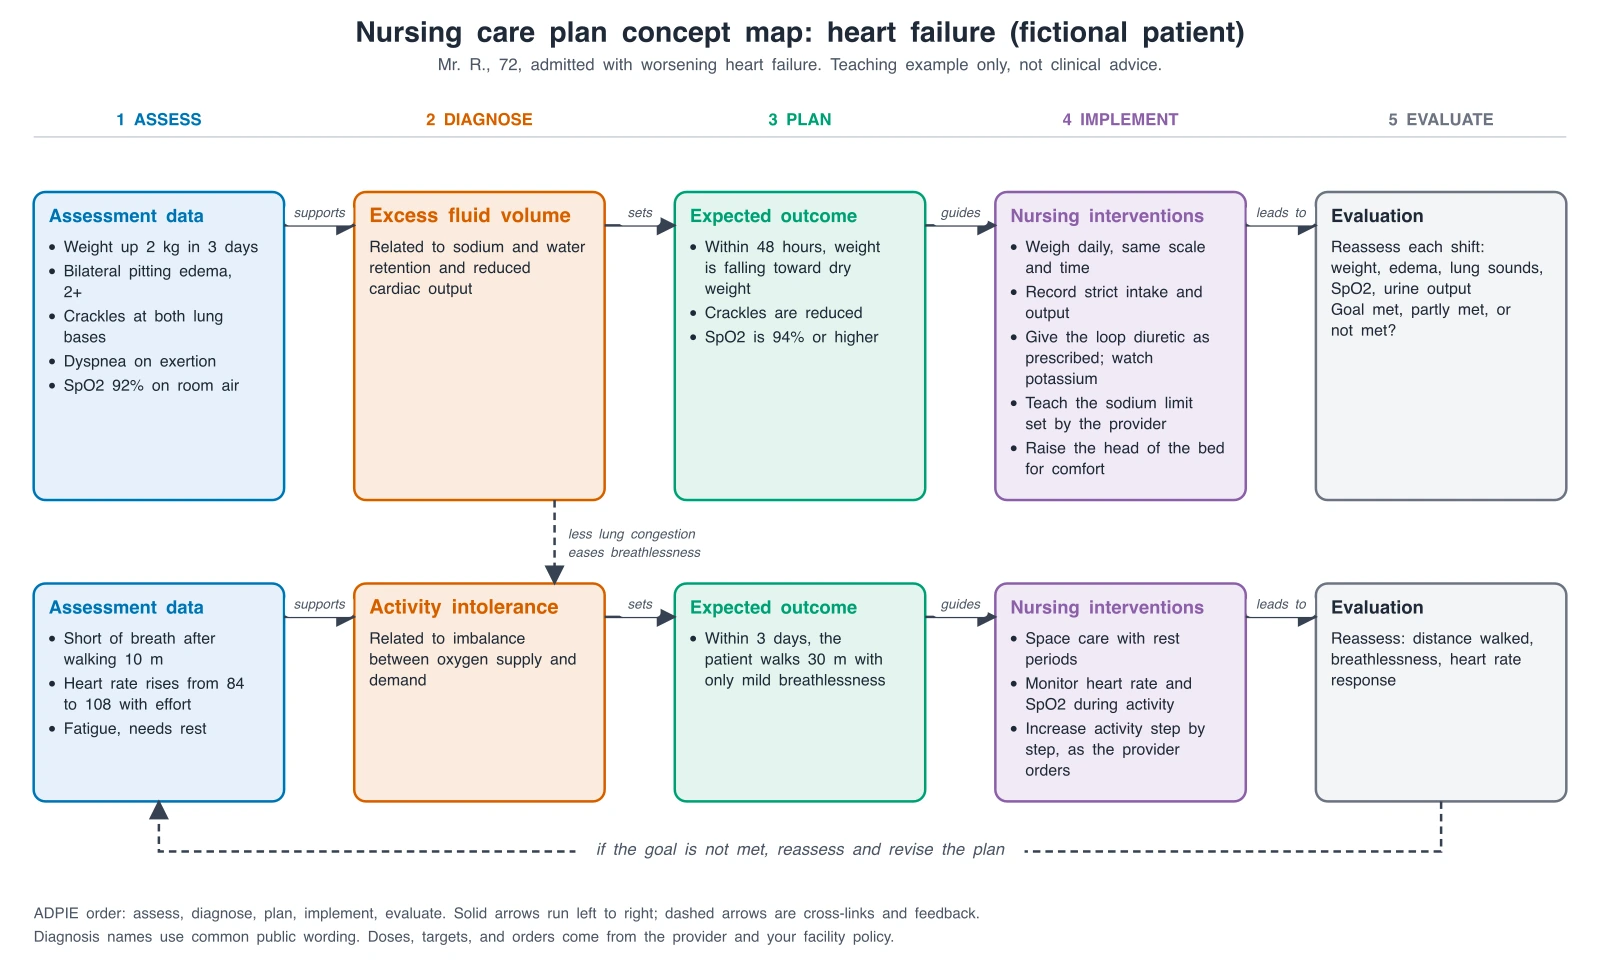
A common sequence is to draw the genogram first to understand the family, then the ecomap to see what supports and stresses it. For nursing students the same case can then feed a nursing concept map, and for a general picture of how ideas connect there is a concept map generator.
Example: an older adult living alone
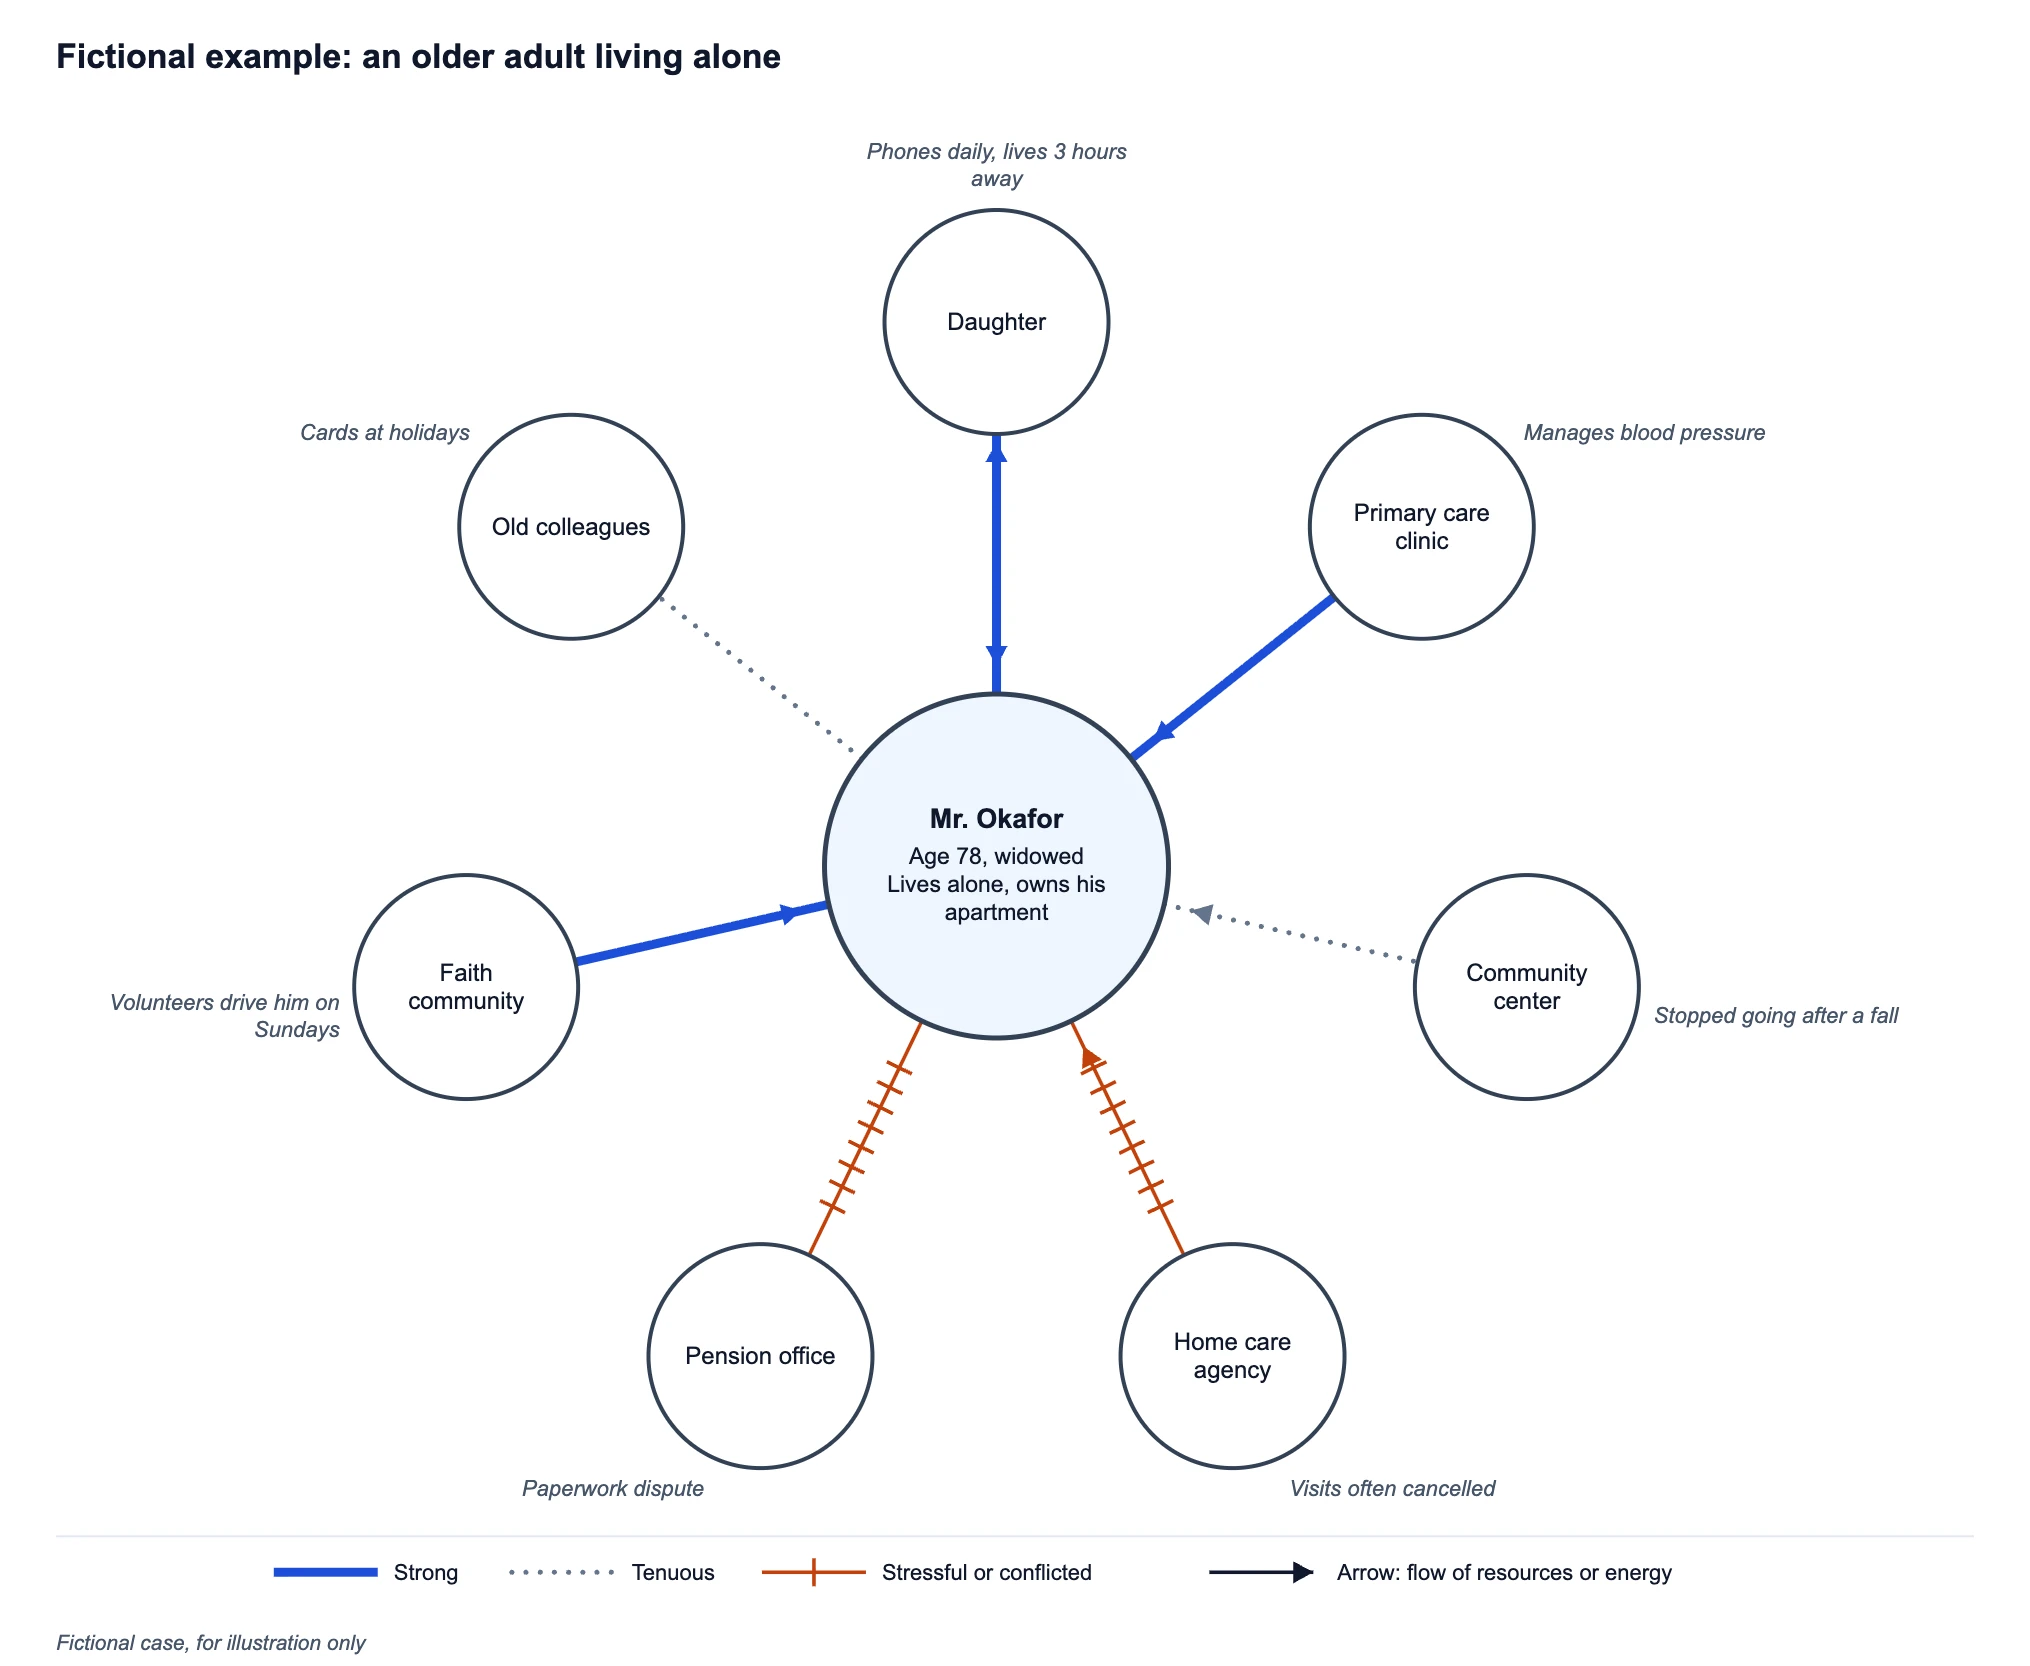
The second example shows a fictional older adult with seven systems. The tie to his daughter is strong and runs both ways, and primary care and the faith community are strong and flow toward him. The community center is a tenuous tie since a fall, the old colleagues are a thin tie with no flow, and the home care agency and the pension office are stressful. Read at a glance, the picture says that the support exists but is unevenly delivered, which is the kind of question to take into the next conversation with the person.
Common ecomap mistakes
- Drawing the family but not the services. An ecomap that shows only relatives is a partial genogram; the point is the outside systems and how they relate to the household.
- Using the line style for everything. A dotted line says the tie is thin, not that it is bad. If the relationship is harmful, use the stressful line, and say why in the note.
- Leaving out the absence. A system that should be present and is not, such as no regular doctor, is information. Add it with a tenuous line and a note.
- Putting everything on one level of detail. Group small contacts, such as "neighbors", and keep separate circles for the systems that matter for the assessment.
- Treating the picture as the assessment. The ecomap organizes what the person and worker know at one point in time. It is a starting point for questions, not a conclusion.
- Using real identifying details in a file that will be shared. Remove names, addresses, dates of birth and anything that could identify the person before the diagram leaves the case file.
Privacy and responsible use
Ecomaps often describe people in difficult circumstances. Use fictional or de-identified details, follow your agency or school policy on records, and treat the diagram as a prompt for conversation with the person, not a verdict about them. The generator draws what you type, runs in your browser and does not check, interpret or diagnose anything.
Ecomap Examples
Exact exports from the generator above, using fictional cases
Family Ecomap: A Fictional Household and Eight Systems
Exact render from a fictional case: strong ties to grandmother, school and neighbors; stressful lines to work and the children's father.
Older Adult Ecomap: Support and Gaps
Exact render from a fictional case: where help flows in, where it is thin and where the relationship is under strain.
Where do the line conventions come from?
The ecomap was designed in 1975 by Ann Hartman and published in "Diagrammatic Assessment of Family Relationships" (Social Casework, October 1978, 59(8), 465-476). In that article a solid or thick line is an important or strong connection, a dotted line is a tenuous connection, and jagged marks across a line show a stressful or conflicted relationship. Arrows along the line show the flow of resources, energy or interest. This generator uses those three lines and the arrow as its legend.
Do all textbooks use the same lines?
Not exactly. Later guides, agency forms and course handouts adapt the notation: some draw the strong tie with a heavier or doubled line, some use a dashed rather than a dotted line for a tenuous tie, and the stressful tie appears as a zigzag, a hatched line or a line with slashes across it. Hartman herself noted that workers who used the map as an interview tool often found the three-line code too constraining and asked the client to describe the connection instead. If your course or agency requires a different convention, use the note column to say what each line means, and check which one your assignment expects.
Frequently Asked Questions
Related Tools
 Medical
Genogram Maker
Map the family itself across generations, then use the ecomap for the systems around it.
 Medical
Nursing Concept Map Generator
Build a care plan concept map from a fictional case, with exact reference diagrams.
 Research
Concept Map Generator
Show how ideas connect with linking phrases when the question is knowledge, not support systems.
 Research
Mind Map Generator
Brainstorm freely around a topic before you decide what belongs on the ecomap.