Org Chart Maker for Any Team Structure
Build a clear organizational chart in seconds. Describe your team — who reports to whom, which departments exist, and how many levels — and the org chart maker draws a clean hierarchy with labeled roles and reporting lines, then export PNG, free.
Org Chart Generator
Free to try ·
Your org chart will appear here
Describe your organization structure and click Generate
Org Chart Examples
Hierarchical, flat, matrix, and divisional structures across companies and teams
Corporate Org Chart
The classic top-down hierarchy: one leader at the top, executives below, teams beneath them.
Flat Startup Org Chart
A flat structure with few levels — ideal for startups and small, self-managing teams.
Department Org Chart
Zoom into a single department to show directors, managers, leads, and their teams.
Matrix Org Chart
A matrix structure with dual reporting — solid lines to managers, dotted lines to projects.
Non-Profit Org Chart
Board at the top, executive director below, and program teams organized by function.
Project Team Org Chart
A temporary project structure: sponsor, project manager, and workstream leads with their members.
What is an organizational chart?
An organizational chart — an org chart — is a diagram that shows how a company or team is structured: who reports to whom, which roles exist, and how departments fit together. Each box is a person or position, and the lines between boxes are reporting relationships. Read from the top down, an org chart answers three questions at a glance: who leads, who reports to whom, and where each role sits in the hierarchy. This org chart maker turns a plain description of your team into exactly that — a clean, labeled hierarchy with proper reporting lines.
How to make an org chart from your team
- List your roles and positions — start with the person or role at the top, then work down level by level.
- Note the reporting lines — for each role, decide who they report to so the hierarchy is unambiguous.
- Describe it in plain English in the generator: who is at the top, what departments exist, how many levels, and any special structure (flat, matrix, divisional).
- Generate the org chart, review the layout, and export it as an image to drop into a slide deck, onboarding doc, or company wiki.
Types of organizational structure
- Hierarchical: the classic top-down pyramid — one leader at the top, layers of management below, and clear single reporting lines. The most common structure for established companies.
- Flat: few or no middle-management layers, so most people report directly to the top. Common in startups and small teams that value speed and autonomy.
- Matrix: people report to two managers at once — usually a functional manager and a project or product manager. Solid lines show the primary reporting line and dotted lines the secondary one.
- Divisional: the company is split into semi-independent divisions by product, region, or market, each with its own internal hierarchy.
Reading roles and reporting lines
In an org chart, vertical position shows seniority and the connecting lines show authority. A solid line means a direct reporting relationship — that person manages the people below them. A dotted line means an indirect or advisory relationship, often used in matrix organizations where someone supports a second manager without reporting to them formally. Boxes at the same level are peers. Getting these lines right is what turns a box-and-line picture into an accurate map of how decisions and accountability flow through your organization.
When to use an org chart
Org charts are most valuable when people need to understand a structure quickly. HR teams use them for onboarding so new hires can see where they fit and who their manager is. Leaders use them for headcount planning, restructures, and spotting gaps or overloaded managers. They are a staple of pitch decks, company handbooks, and intranet pages, and they make cross-team projects easier by showing who owns what. Whenever someone asks "who runs this team?" or "who do I talk to about X?", an up-to-date org chart is the fastest answer.
Tips for a clear org chart
Keep each box to a role and a name rather than a paragraph, and stay consistent — if one box shows a title, they all should. Limit the number of levels you show at once; for a large company, build a high-level chart of departments and link to detailed charts per team rather than cramming everyone into one diagram. Use color or grouping to distinguish departments, reserve dotted lines for genuine secondary reporting, and avoid crossing lines where you can. A chart that fits on one screen and reads top to bottom without backtracking is far more useful than an exhaustive one nobody can follow.
Frequently Asked Questions
Related Diagram Tools
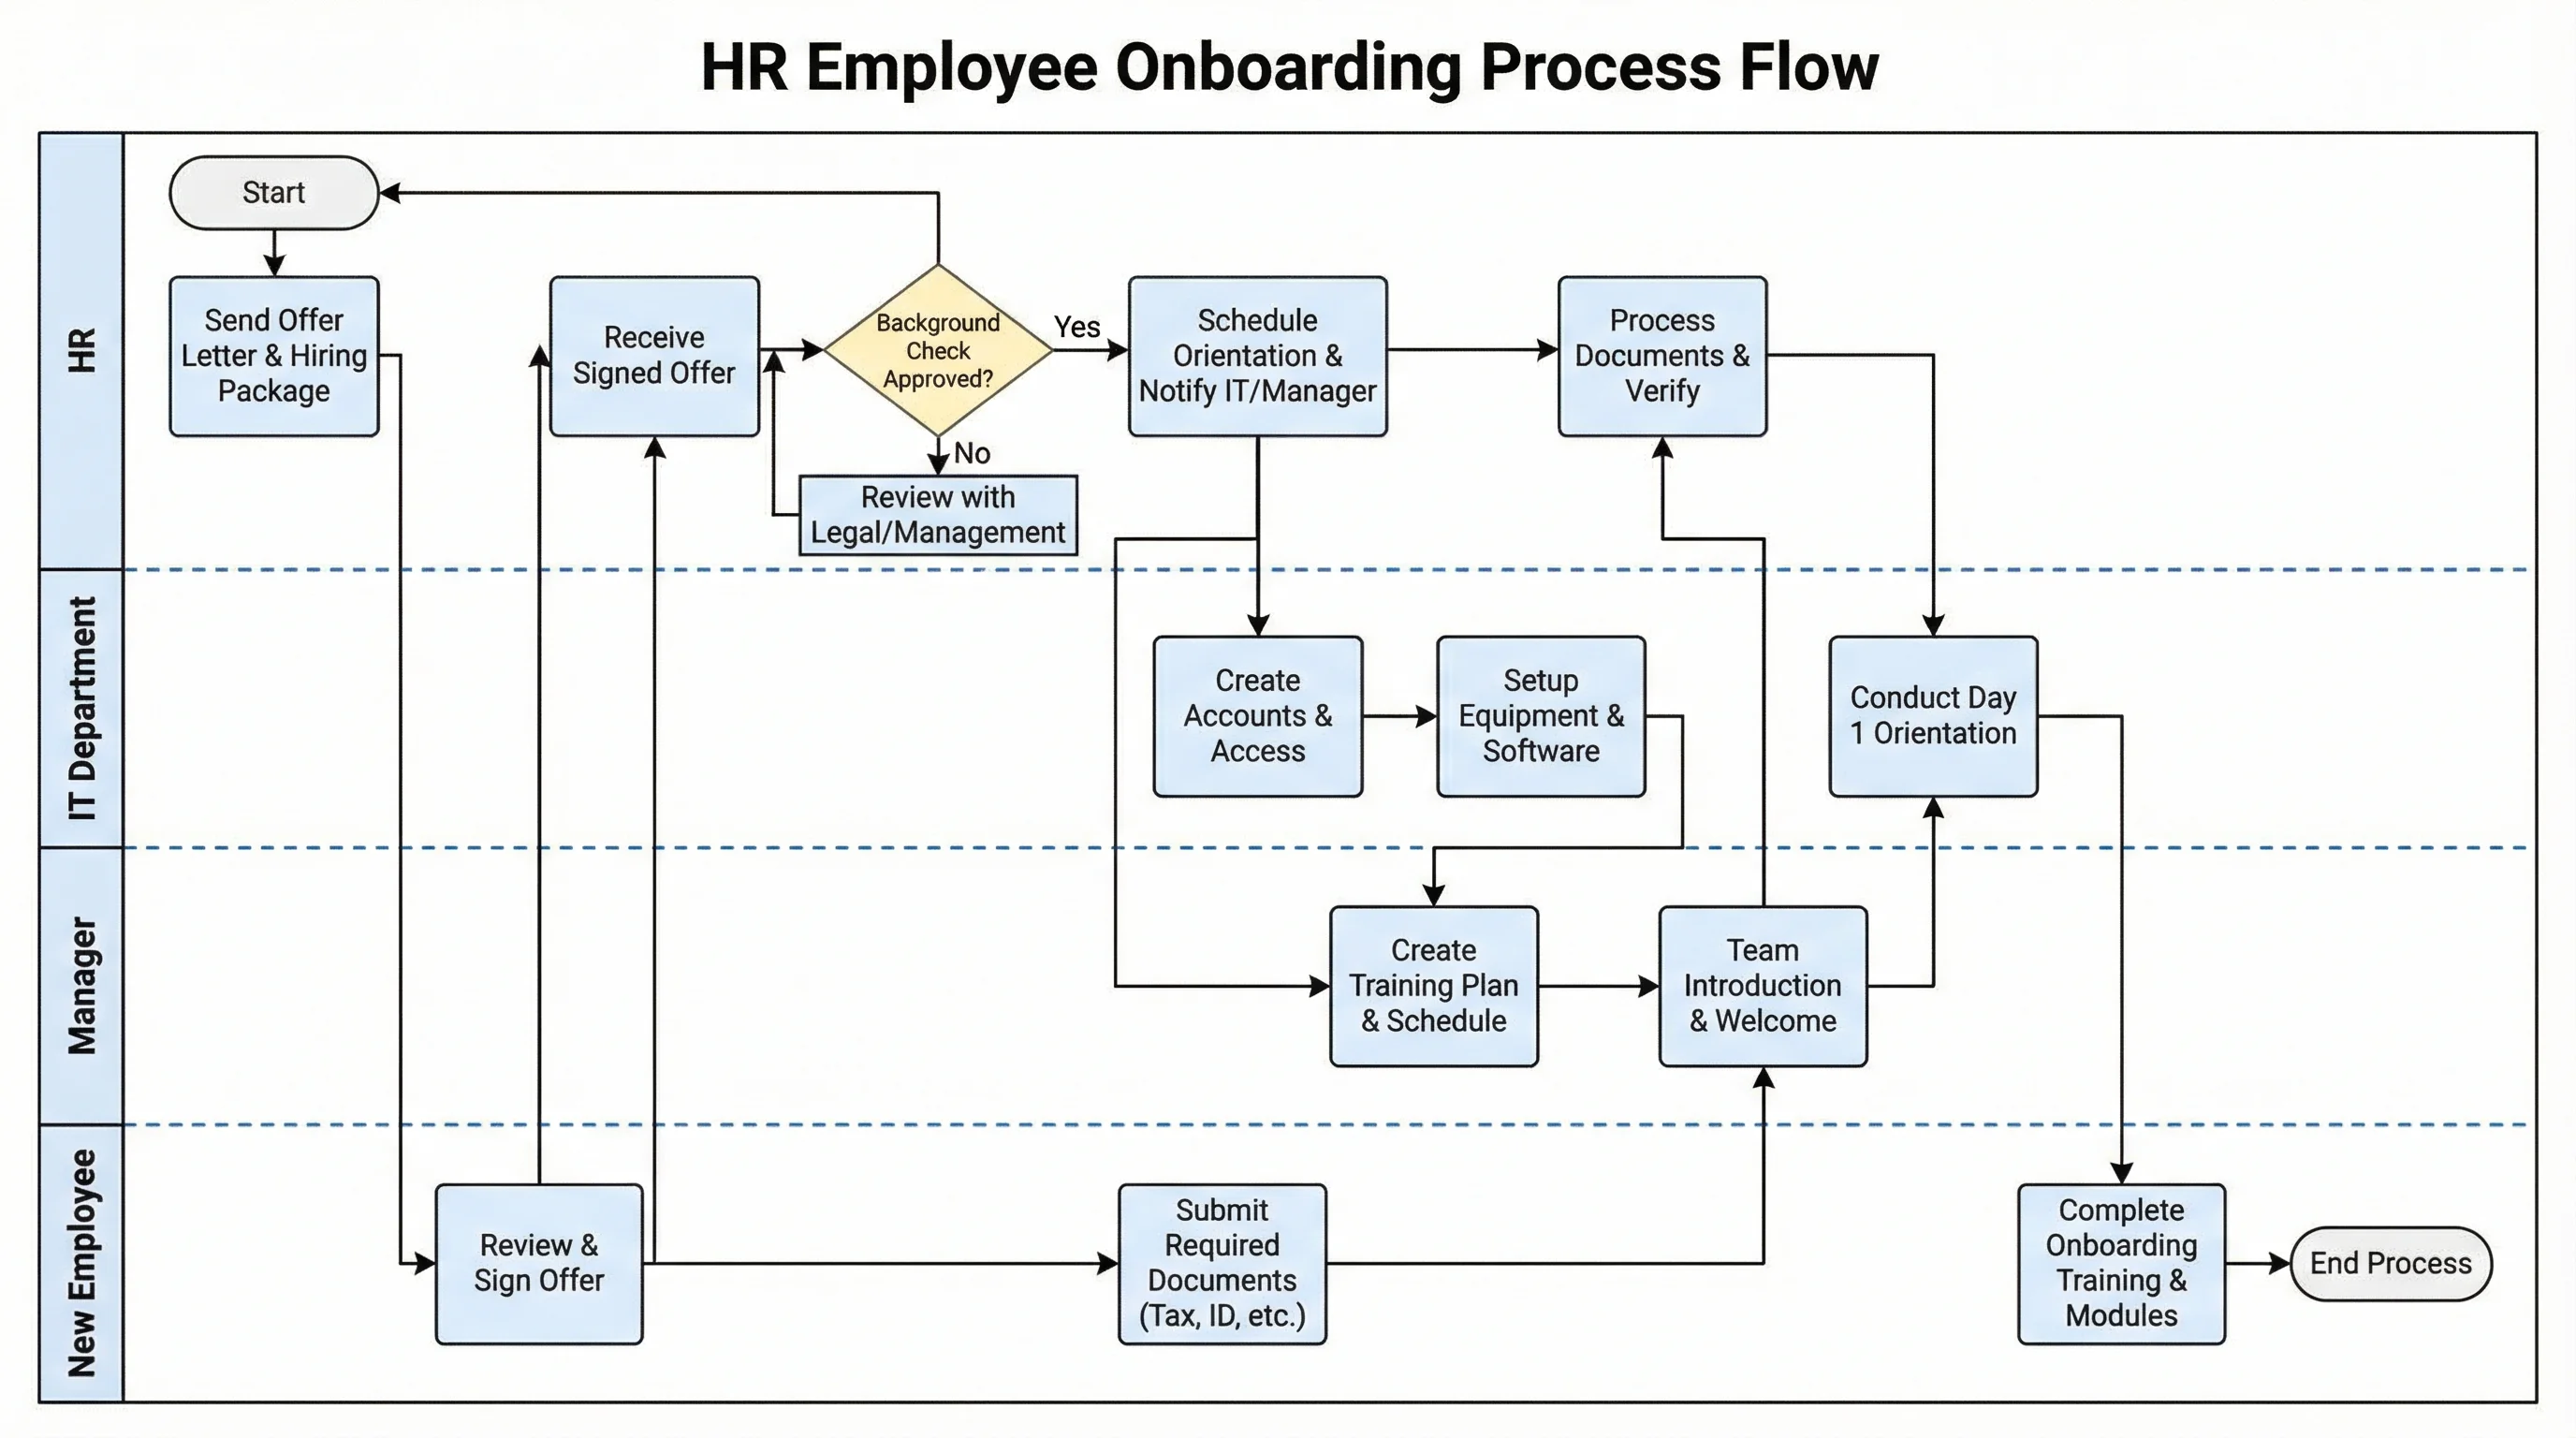 Visualization
Tree Diagram Generator
Build branching tree diagrams for hierarchies, decisions, and breakdowns.
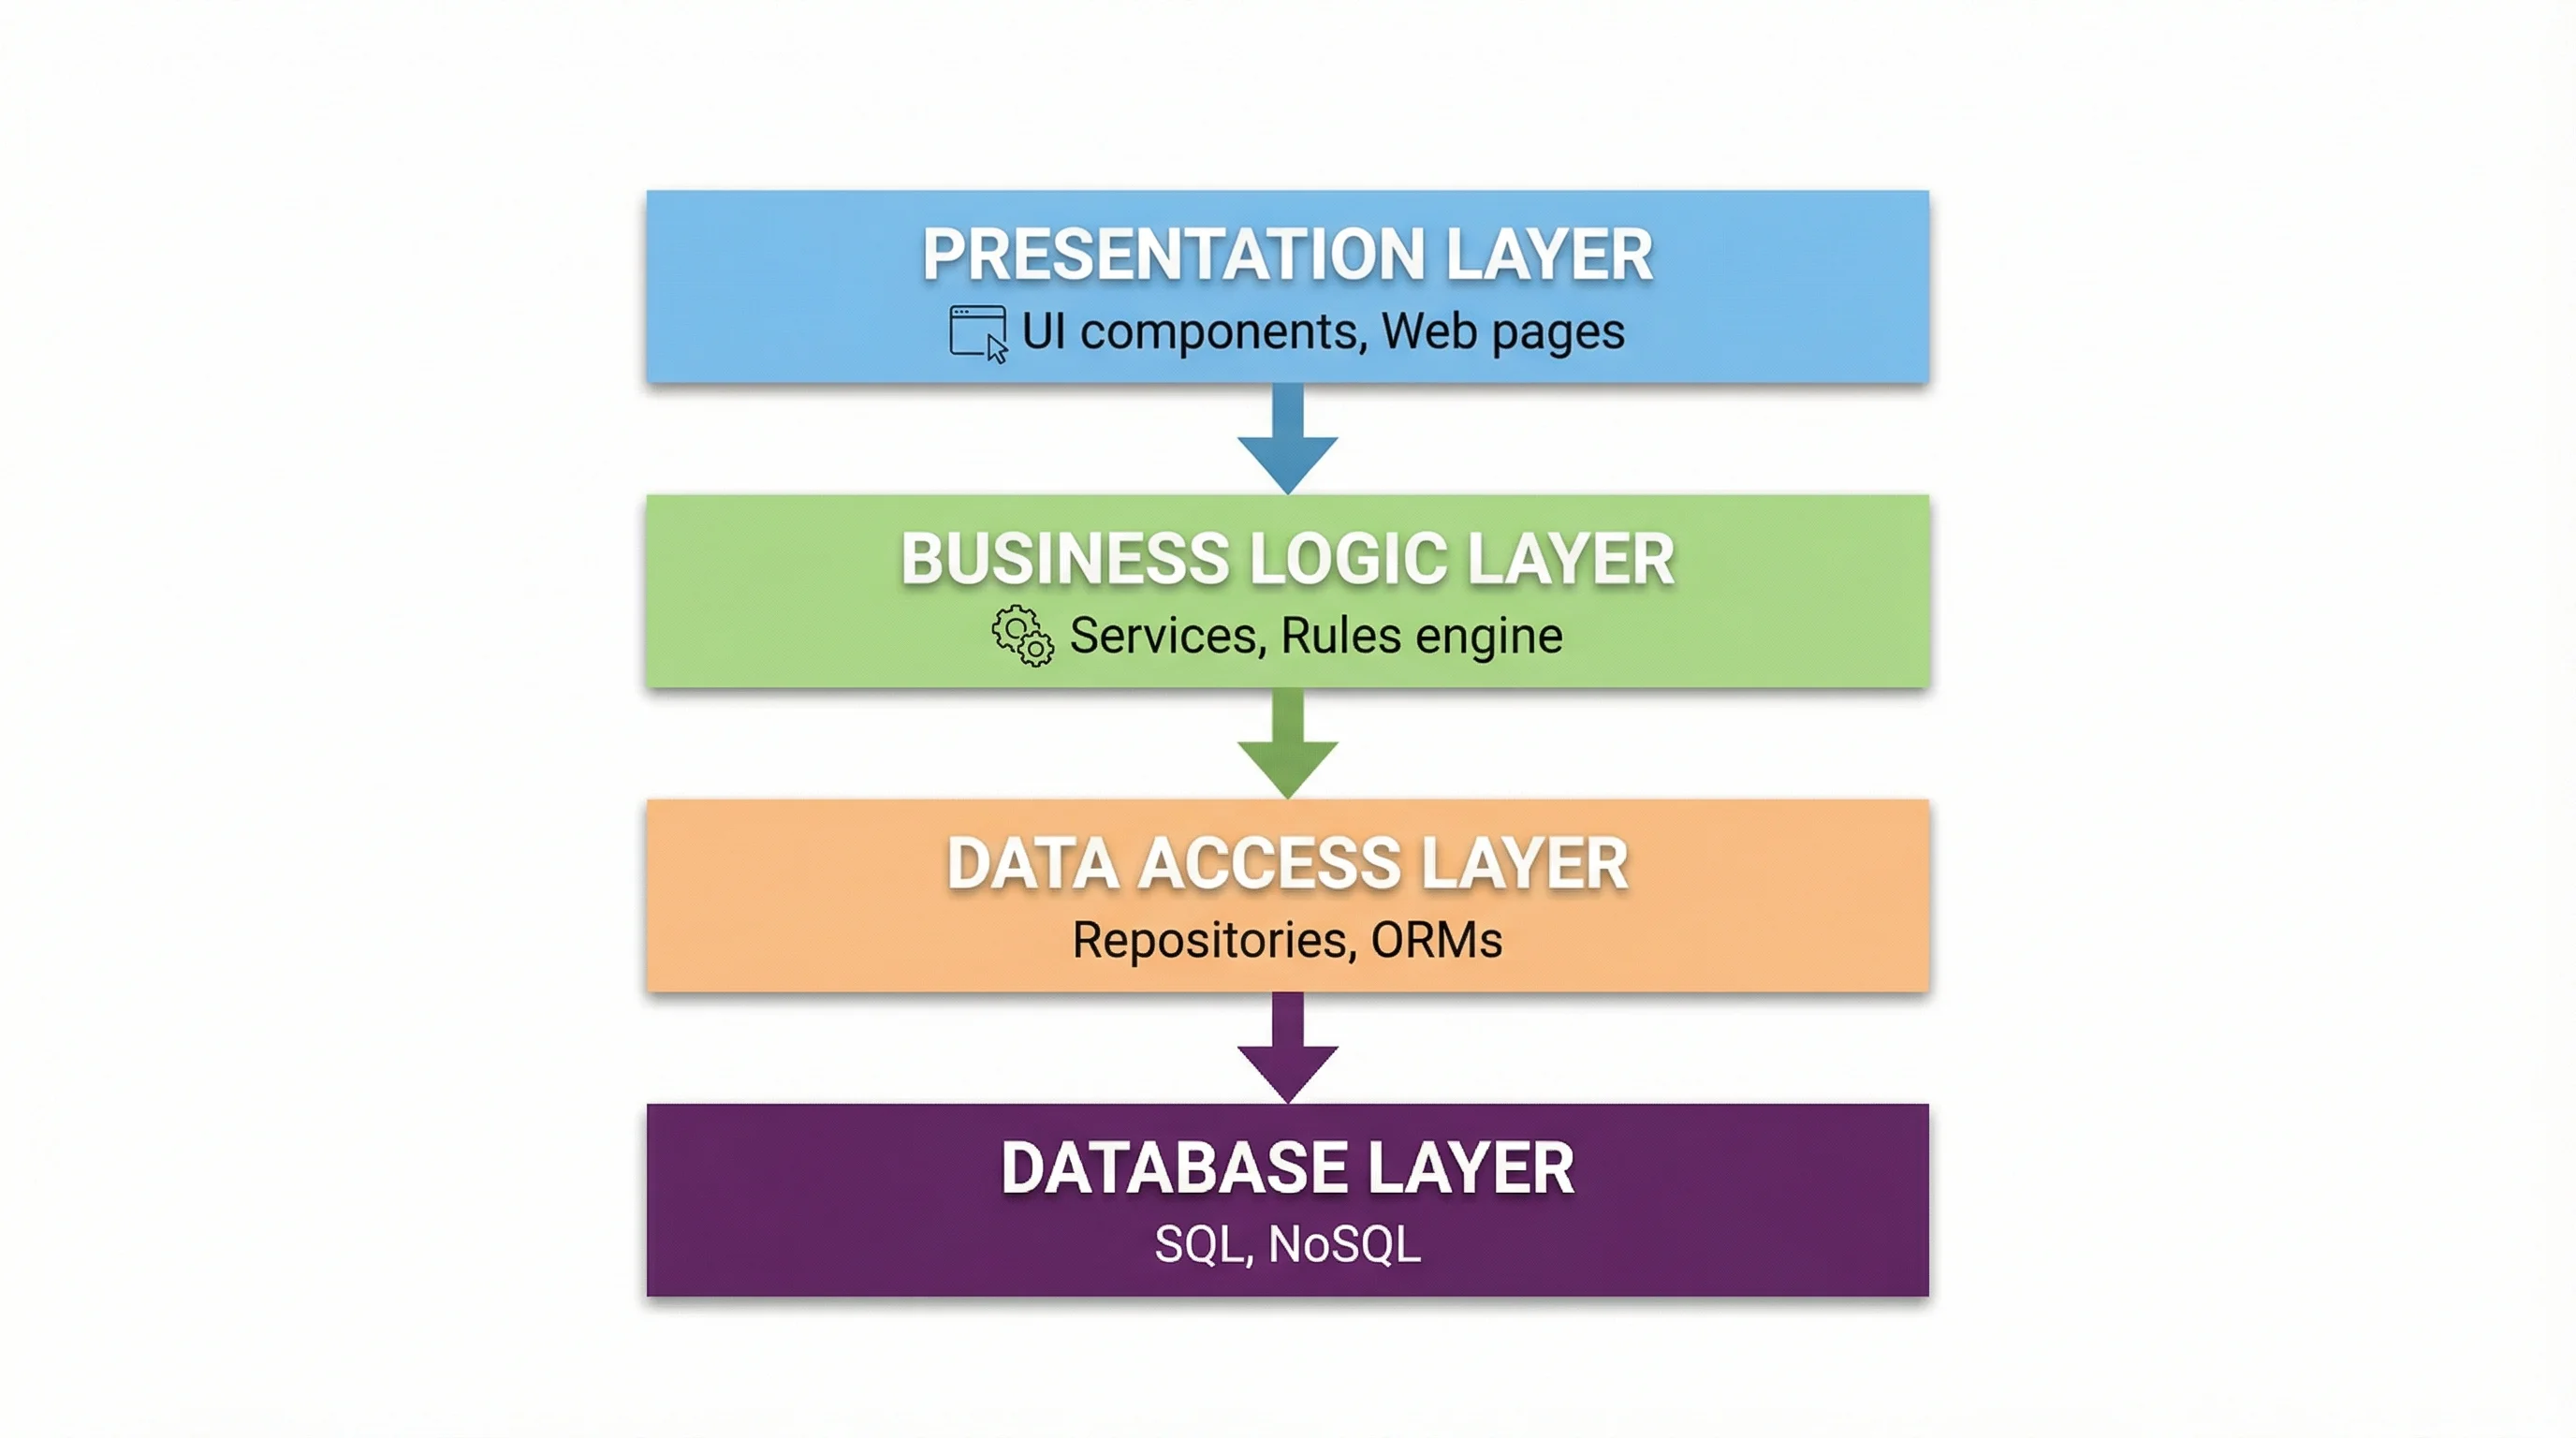 Education
Mind Map Generator
Turn a central topic into an organized mind map with branches and sub-branches.
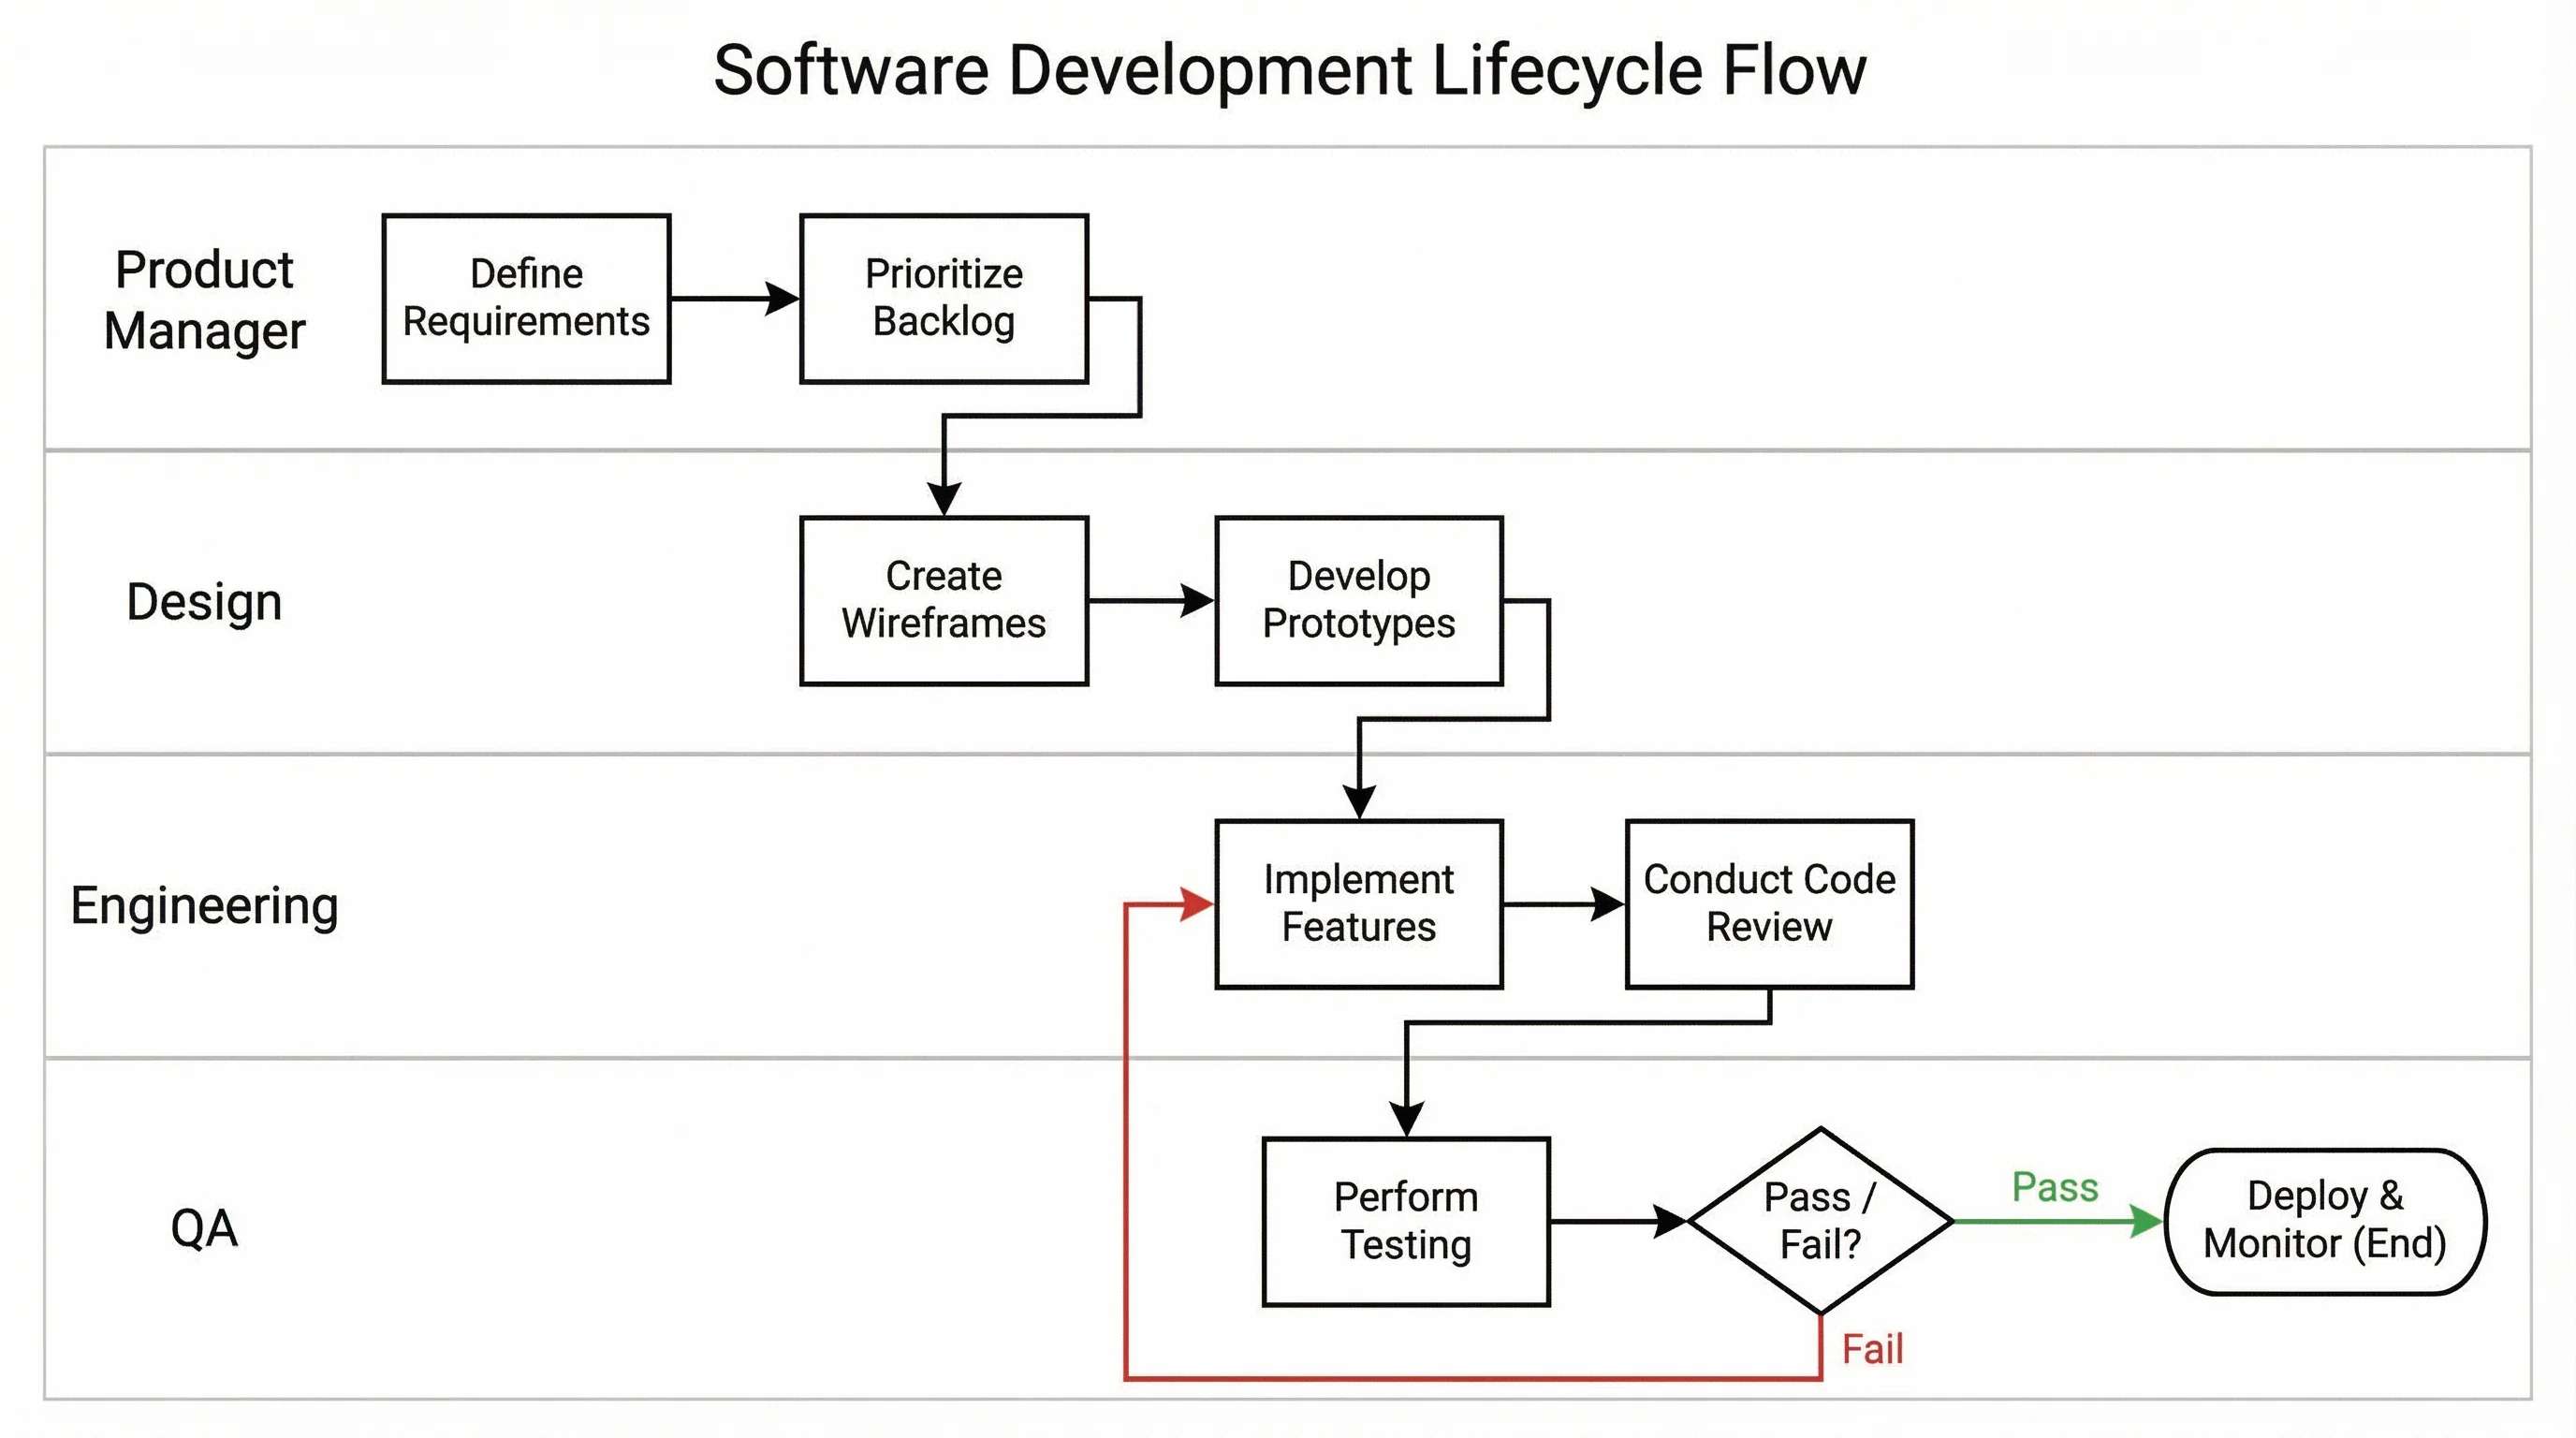 Visualization
AI Flowchart Generator
Create clear flowcharts for processes, workflows, and decision logic.