Fishbone Diagram Maker for Cause & Effect Analysis
Make a fishbone (Ishikawa) diagram online for root cause analysis. Type your effect and categories for a precise, auto-laid-out cause-and-effect diagram, or describe one for an AI illustration — then export SVG, free.
Type your effect and categories — builds an exact, labeled cause-and-effect diagram as SVG, free
Cause & effect
Exact Ishikawa diagram, rendered as SVG.
6 categories · 12 causes
Bones alternate above and below the spine and scale to fit your causes — nothing overlaps.
Ishikawa cause-and-effect diagram · spine, alternating category bones, and labeled cause sub-lines. Download an editable SVG for slides, reports, and quality reviews.
Fishbone Diagram Maker
Free to try ·
Your fishbone diagram will appear here
Describe the cause-and-effect diagram you want
Fishbone Diagram Examples
6M manufacturing, service, project, healthcare, and environmental diagrams
6M Manufacturing Fishbone
The classic 6M template for manufacturing: six category bones branching off the spine into the defect at the head.
Assembly Line Root Cause
Root cause analysis on a production line — each bone groups the potential causes of an out-of-spec defect rate.
Service Cause & Effect
A service-industry fishbone — the 4S/people-process style categories work just as well for non-manufacturing problems.
Project Delay Analysis
Project management use — map the contributing causes behind a schedule slip before deciding what to fix.
Patient Safety Investigation
Incident investigation in healthcare — a structured way to surface every contributing factor behind a safety event.
Environmental Impact Fishbone
A sustainability example — grouping causes by domain makes a complex environmental problem easier to act on.
What is a fishbone (Ishikawa) diagram?
A fishbone diagram — also called an Ishikawa diagram or cause-and-effect diagram — is a visual tool that maps the possible causes of a single problem so a team can find its root cause. The problem, or "effect", sits in a box at the head of the fish on the right. A horizontal spine runs into it, and major cause categories branch off the spine like ribs, each carrying smaller "bones" for the specific causes within that category. Invented by Japanese quality expert Kaoru Ishikawa, it is one of the seven basic tools of quality and a staple of root cause analysis — and this maker places the spine, head, category bones, and causes for you, exactly, every time.
The parts of a fishbone diagram
- Effect (head): the problem or outcome you are analyzing, written in the box on the right — for example "High Product Defect Rate" or "Late Delivery". A sharp, specific effect keeps the whole diagram focused.
- Spine: the central horizontal arrow that points into the head. Every category connects to it.
- Category bones: the main branches angled off the spine, one per cause category. They are the buckets you sort potential causes into so the analysis stays organized.
- Causes: the short sub-lines coming off each category bone — the actual factors that might contribute to the effect. You can keep asking "why?" to add deeper sub-causes.
Common category frameworks: 6M, 4S, and 4P
The fastest way to start a fishbone is with a ready-made set of categories. In manufacturing the classic is the 6M: Method, Machine, Material, Manpower (People), Measurement, and Mother Nature (Environment) — the default template in this tool. For service industries the 4S framework is common: Surroundings, Suppliers, Systems, and Skills. Marketing and product teams often use the 4P set: Policies, Procedures, People, and Plant (or Product, Price, Place, Promotion in a marketing-mix sense). These frameworks are starting points, not rules — you can rename, add, or remove categories to fit your problem. This maker handles anywhere from 2 to 8 categories and re-balances the layout automatically as you add them.
Root cause analysis with the 5 Whys
A fishbone diagram and the 5 Whys technique work hand in hand. The fishbone helps you brainstorm broadly — laying out every plausible cause across all categories — while the 5 Whys drills down narrowly. Pick a promising cause on a bone and ask "why does this happen?" up to five times, adding each answer as a deeper sub-cause, until you reach a root cause you can actually act on. The diagram keeps the whole investigation visible, so the team can see how a surface symptom traces back to its source. The goal is not to list every possible cause, but to identify the few root causes that, once fixed, prevent the problem from recurring.
Two ways to make a fishbone diagram here
- Precise builder: type the effect and your categories (one per line, with causes after a colon) and the tool computes the spine, head box, alternating category bones, and cause sub-lines automatically — correctly spaced and labeled every time, with nothing to drag or align. Start from the built-in 6M sample and edit it.
- AI illustration mode: describe the problem in plain English and the tool generates a polished, presentation-ready fishbone illustration with color-coded branches and styling.
- Use the precise builder when structure and accuracy matter (a quality review, a report, a worksheet); use AI mode when you want a styled graphic for a slide or handout.
How to use the fishbone diagram maker
- Enter the effect — the specific problem you are analyzing — in the head field.
- List your categories one per line as "Name: cause1, cause2"; start from the 6M sample and rename or replace categories to fit your situation.
- Add the specific causes after each colon; the tool spaces the bones above and below the spine and labels everything so it stays readable.
- Use the 5 Whys to refine the most likely causes, then download a clean, editable SVG for slides, reports, and reviews — or switch to AI mode for a styled illustration.
Where fishbone diagrams are used
Fishbone diagrams show up wherever teams need to understand why something is going wrong. In quality and manufacturing they drive Six Sigma and lean root cause analysis for defects, scrap, and downtime. In business and operations they untangle customer complaints, missed deadlines, and process failures. In healthcare they structure incident and patient-safety investigations. In project management they expose the contributing causes behind a schedule slip or budget overrun. And in education they teach students structured problem solving and critical thinking — a clear, low-overhead way to break a big question into organized parts. Because this maker exports an editable SVG, the diagram drops straight into a slide deck, A3 report, lab write-up, or worksheet without any redrawing.
Frequently Asked Questions
Related Diagram Tools
 Diagrams
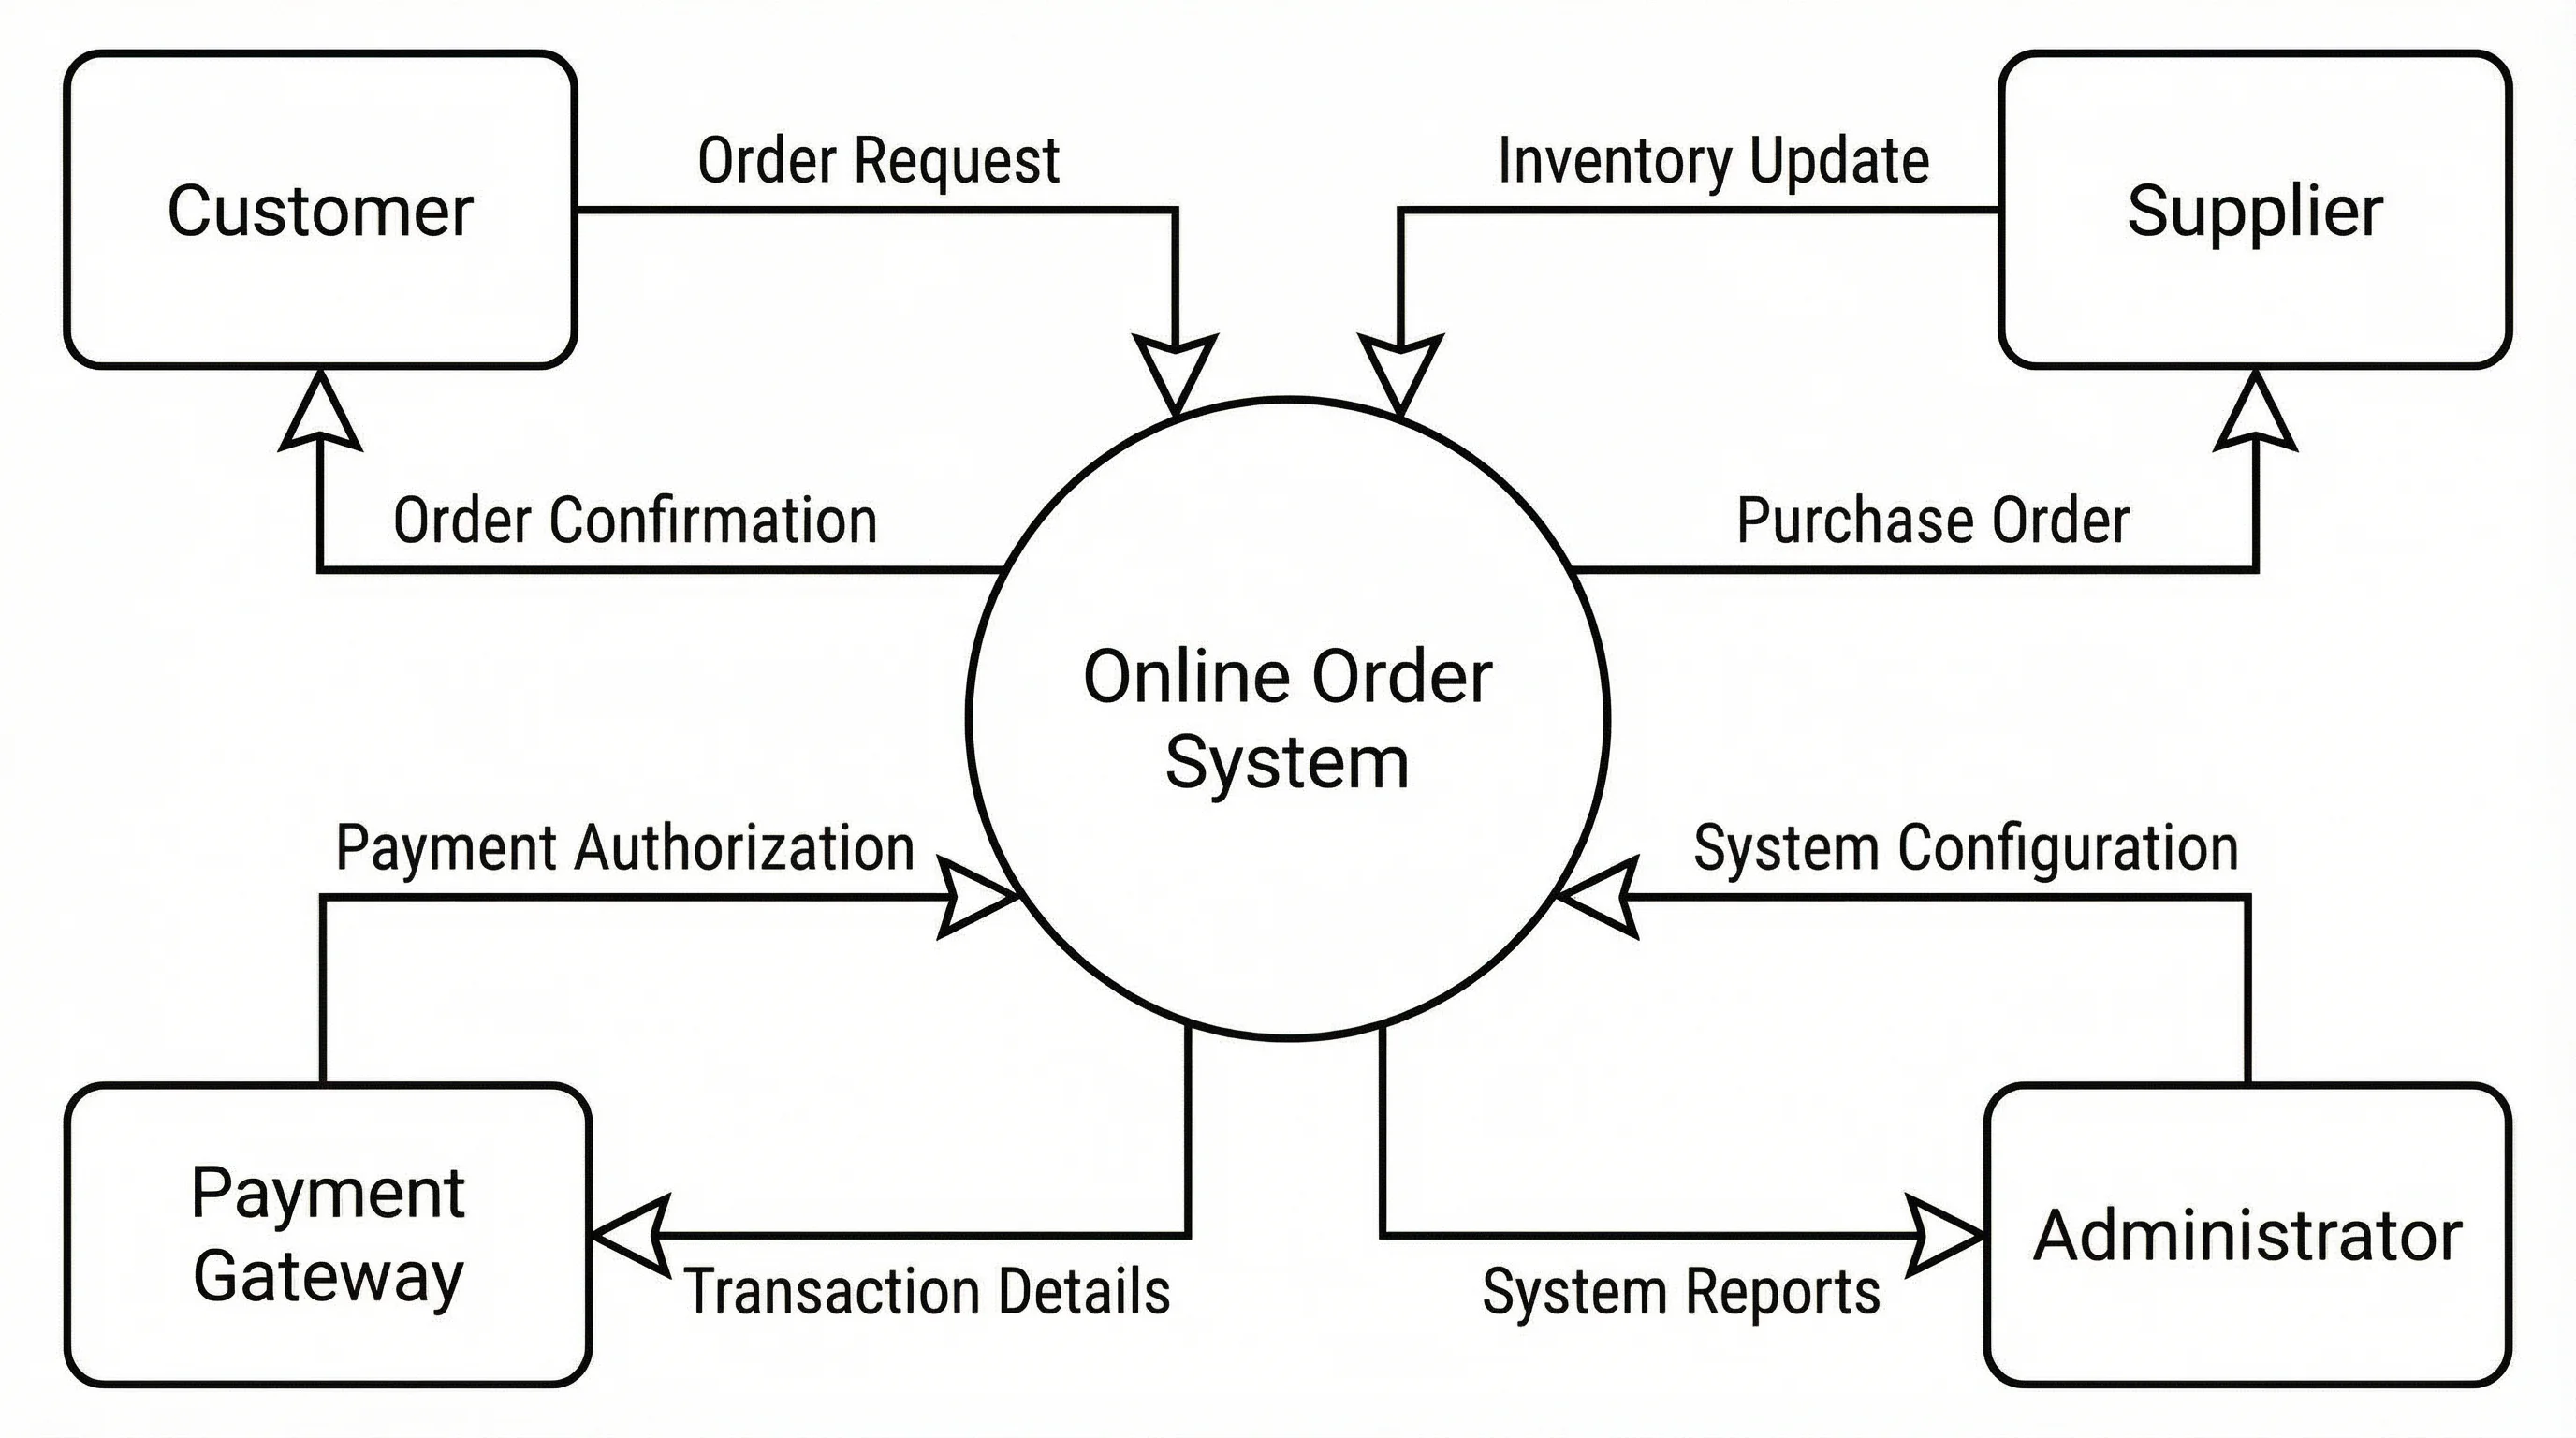
Data Flow Diagram Generator
Map how data moves through a system with a clear, labeled data flow diagram.
 Diagrams
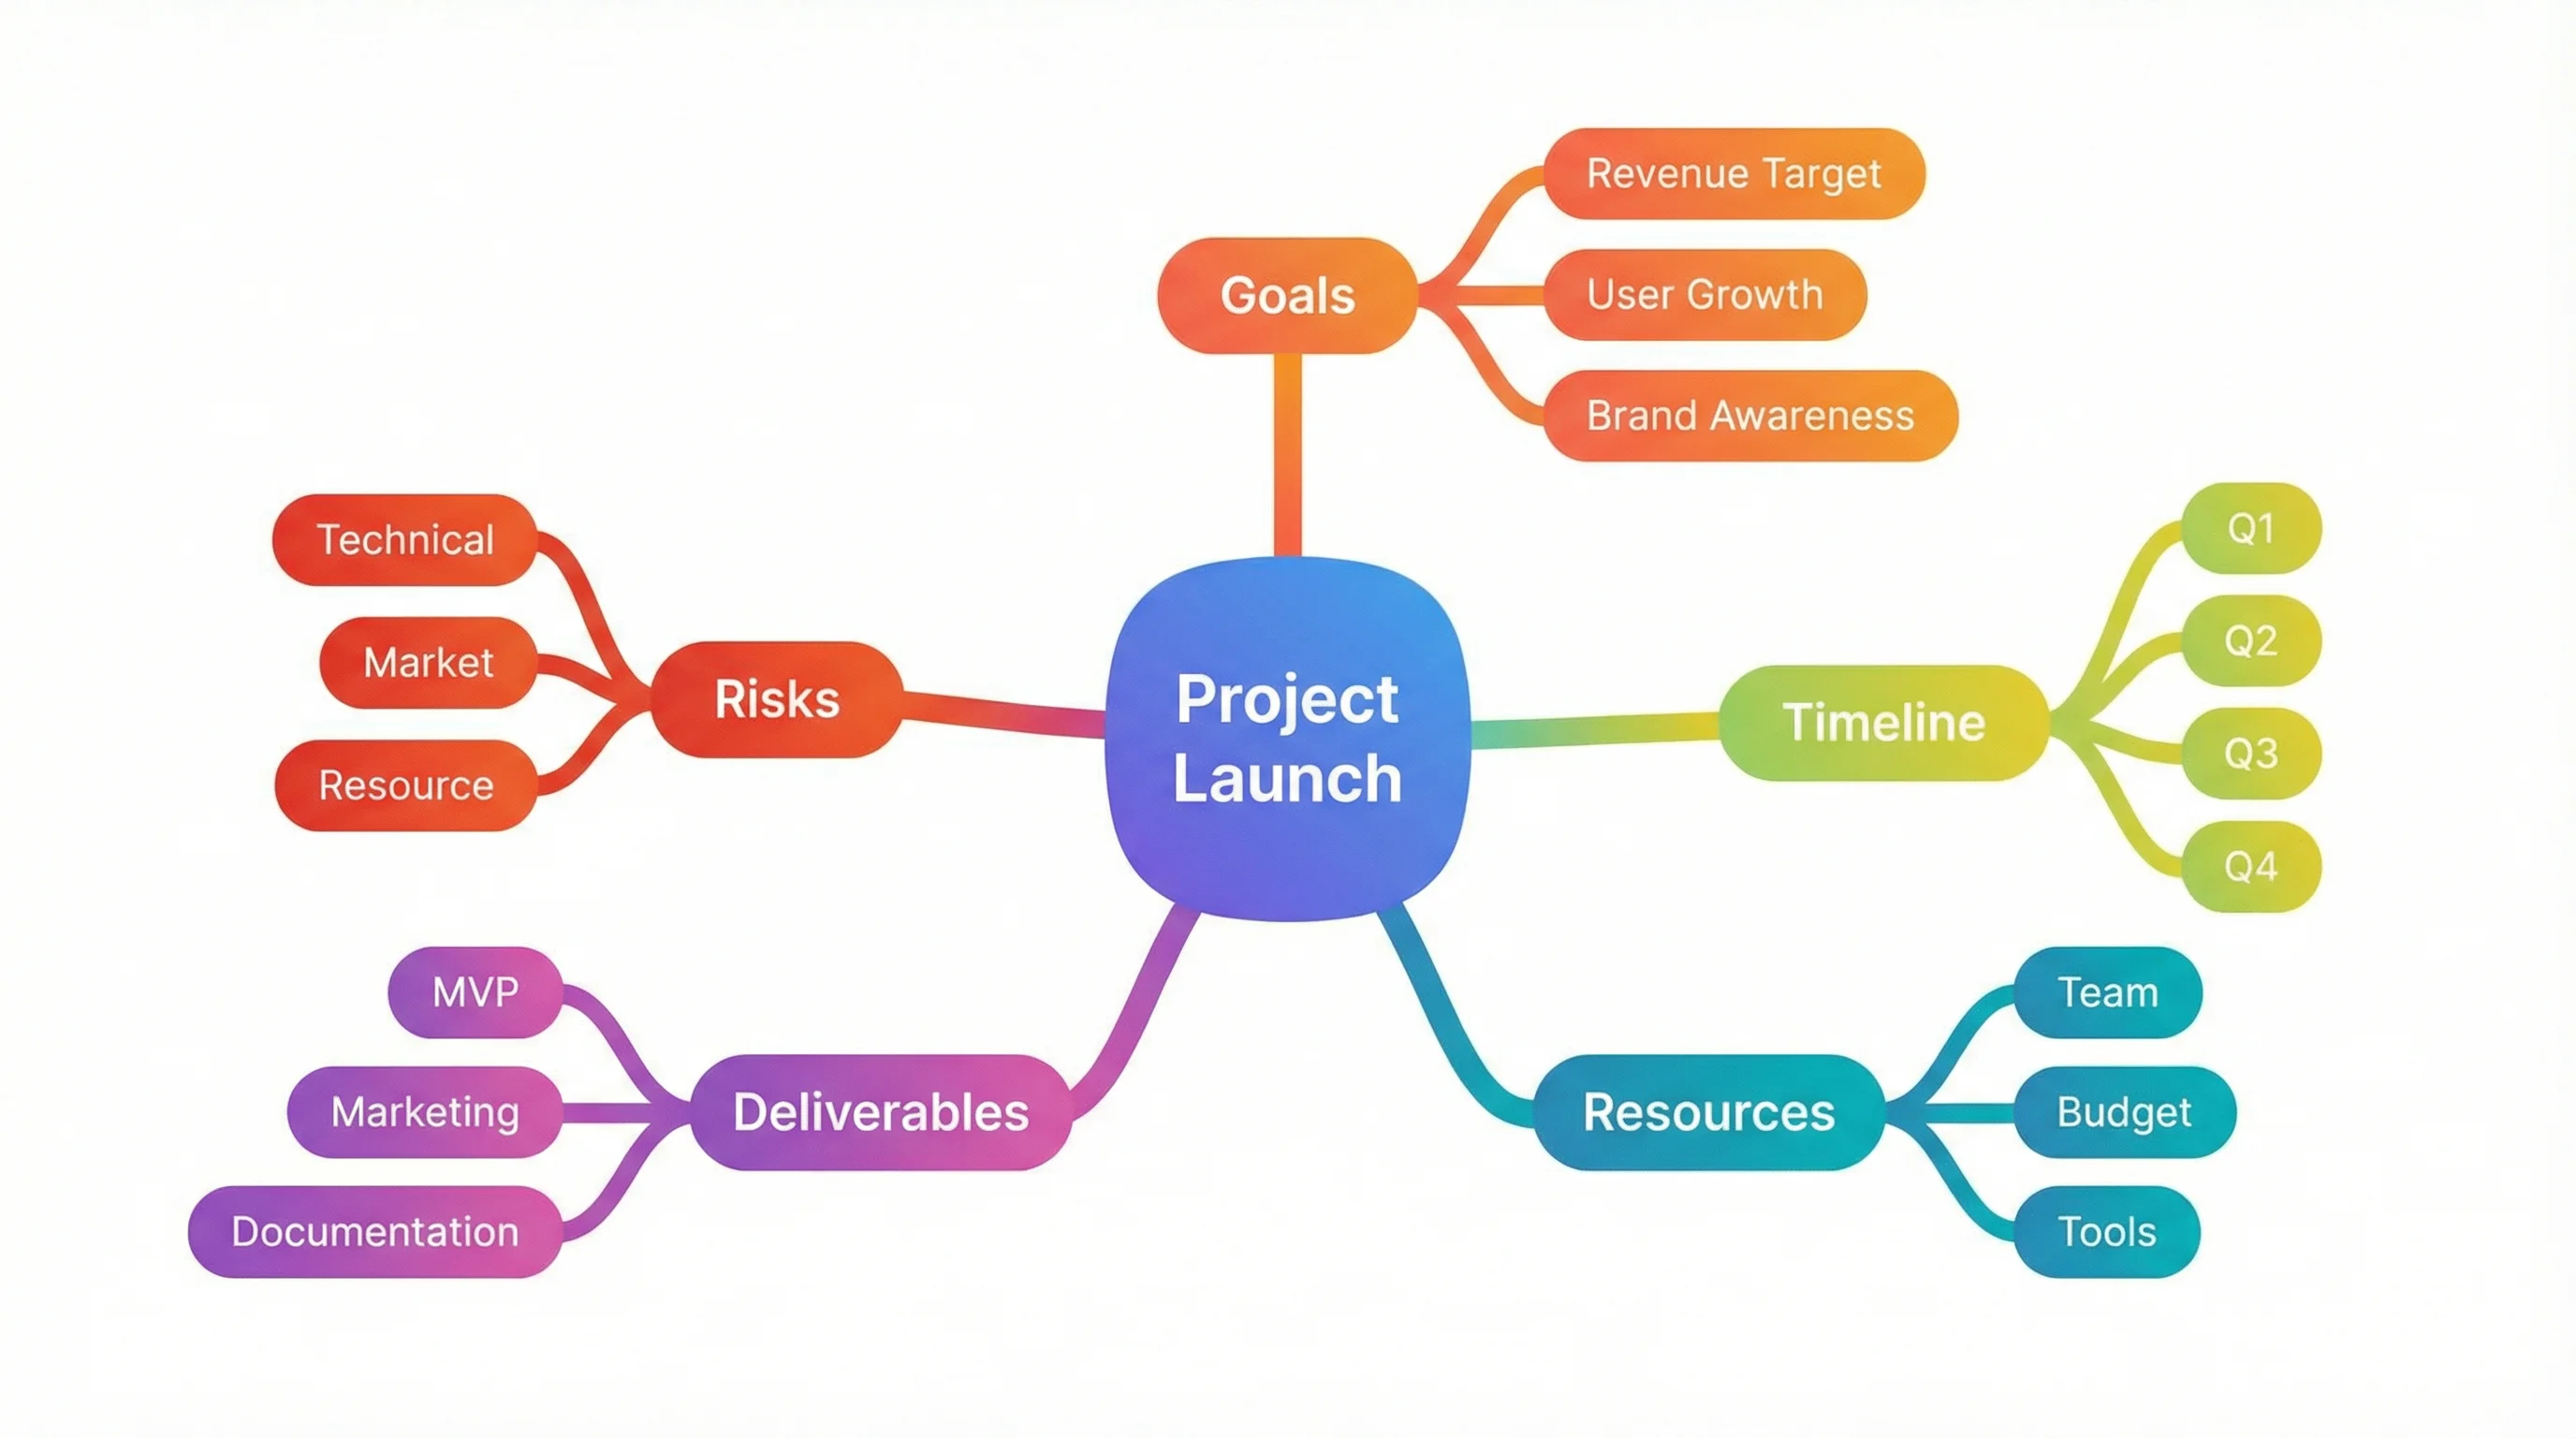
Mind Map Generator
Turn a topic into an organized mind map with branches and sub-branches.
 Diagrams
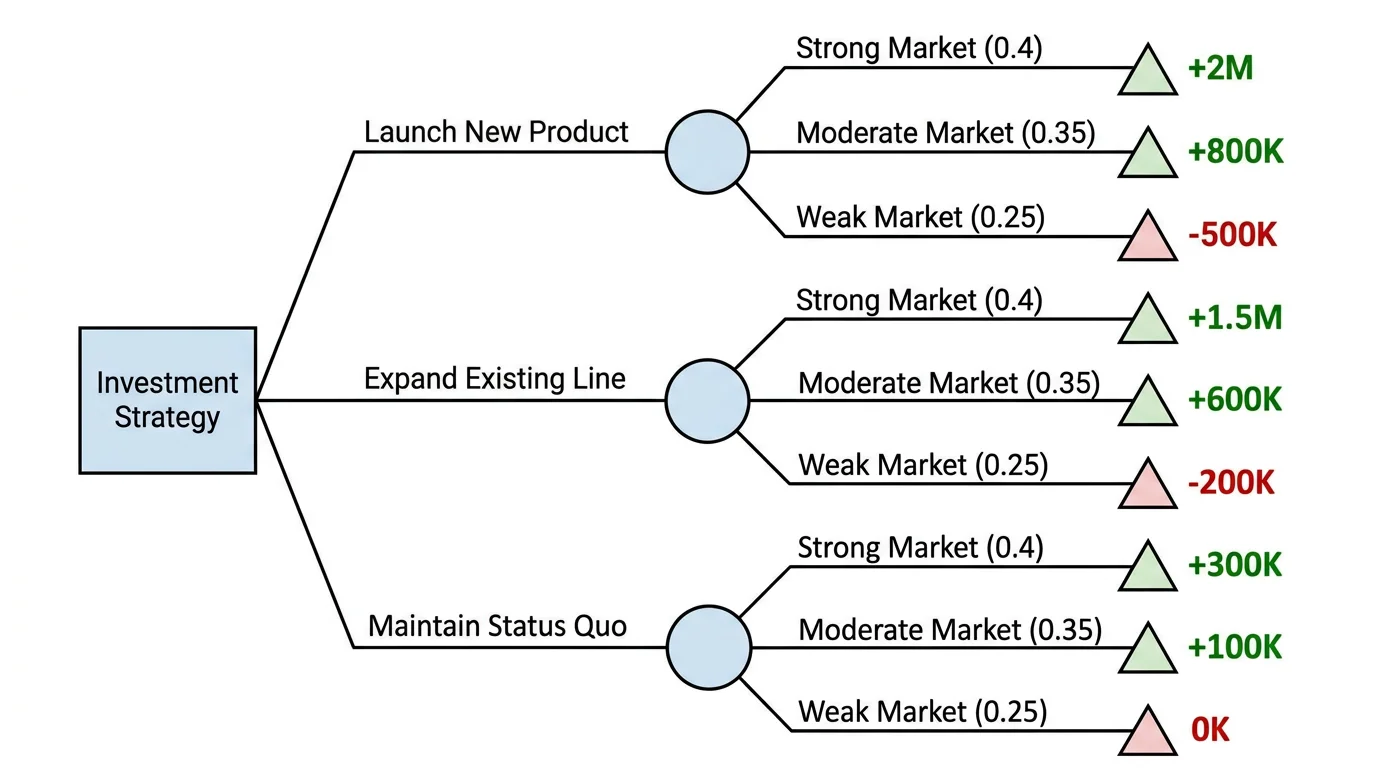
Decision Tree Generator
Lay out choices, outcomes, and probabilities in a clean decision tree.