Patent Claim Chart Generator with Evidence and Citations
Paste a claim and it is split into elements numbered 1[a], 1[b] and so on. Add the evidence and a citation for each element, mark it met, partly met or not met, then export SVG, PNG, CSV or a table for Word.
Claim chart
Paste a claim, split it into elements, then add evidence and a citation for each element. Up to 30 elements.
CSV: use the file from Download CSV as the template. Columns are element, claim_language, then Name | evidence, Name | cite and Name | status for each chart column. Status is met, partial or not (or blank).
5 claim elements in claim 1.
What is a patent claim chart?
A patent claim chart is a table that takes one claim of a patent apart into its elements and puts next to each element the evidence that bears on it, with a citation. In an infringement claim chart the evidence comes from the accused product: a manual, a data sheet, a teardown, source code, a web page. In an invalidity claim chartit comes from prior art: older patents, papers and products that were public before the patent's priority date.
The layout is always the same: the claim language on the left, the evidence on the right, one row per element. That makes it easy to see at a glance which elements are well supported and which have nothing behind them. This generator builds the table as you type, numbers the elements, counts your marks and exports the result as an image, a CSV or a table you can paste into Word.
What claim charts are used for: infringement, invalidity, FTO and licensing
| Chart | Compares | Typical use |
|---|---|---|
| Infringement chart | Each claim element against the accused product | Shows where a product appears to have every element of a claim. Used by a patent owner when asserting a patent or sending a notice, and by the accused party to find which element is missing. |
| Invalidity chart | Each claim element against one or more prior art references | Shows where earlier patents, publications or products disclose each element. Used in litigation contentions, and in requests to the patent office to review a patent. |
| Freedom to operate (FTO) chart | Claims of third-party patents against your own product | Used before launch to see whether a planned product might fall inside someone else’s claims. Chart one claim at a time, and use the infringement mode with your own product as the product. |
| Licensing or evidence-of-use chart | Claims of a patent you own or want to license against a licensee’s product | A short chart is often attached to a licensing offer to show why the claims are relevant. Keep the evidence to public documents you can cite. |
The generator has two modes. Infringement mode has one evidence column, which also fits an FTO or a licensing chart. Invalidity mode has up to three reference columns, so you can show that one reference covers one element and another covers the rest.
How to make a claim chart
- 1
Choose the chart type
Pick infringement to chart one claim against one accused product, or invalidity to chart it against up to three prior art references. The rest of the workflow is the same.
- 2
Paste the claim and split it
Paste the text of one claim, including its number, and press Split into elements. The text is cut after each semicolon and each colon, and the preamble becomes 1[pre]. Then read the result against the patent and fix any cut that is in the wrong place with the edit and insert buttons.
- 3
Name the product or the references
For an infringement chart, name the accused product and version. For an invalidity chart, name each reference the way you would cite it, with the patent number or the title and the date.
- 4
Fill the evidence and the citation
For each element write what the product does or what the reference says, in your own words or as a short quote, and give a citation precise enough for someone else to find it: a page, figure, column and line, paragraph number or URL with the date you viewed it.
- 5
Mark each cell
Mark it met, partly met or not met (disclosed, partly disclosed or not disclosed for prior art), or leave it unmarked while you are still looking. The totals under the chart count your marks. They do not decide anything.
- 6
Export
Download SVG or PNG for a slide or a memo, CSV to keep working in a spreadsheet and load it back later, or copy the table and paste it into Word or Google Docs, where it stays an editable table.
How to split a claim into elements
Splitting is the step people spend the most time on. A reliable method is to read the claim aloud and mark every place where one requirement ends and the next begins. The automatic split in this tool follows the punctuation that claim drafters use, so most claims split correctly on the first try; it is still a starting point.
- The preamble is its own element. Everything before the first colon, for example "A method of placing an order comprising:", is the preamble. It is charted as the preamble, [pre], by convention. Whether a preamble limits the claim is a legal question, so chart it anyway.
- Each step or component after a colon or semicolon is an element. Claims usually list their parts separated by semicolons. Each part gets a letter: [a], [b], [c]. The tool also cuts after a colon in the middle of a claim, so a sub-list gets its own header element followed by its items.
- Keep the "and" and "or" with the element before it. The "and" that follows the last semicolon of a list stays at the end of the element it closes, as in the claim, so the elements read back as the original wording.
- A closing "whereby" clause becomes an element. A whereby clause is split off when it comes after the last step. Check whether it adds a limit. If a long element holds two separate requirements, split it by hand so each can be marked on its own.
- Chart one claim at a time. A dependent claim includes every element of the claim it depends on, so chart the independent claim first and then add only the new element of each dependent claim.
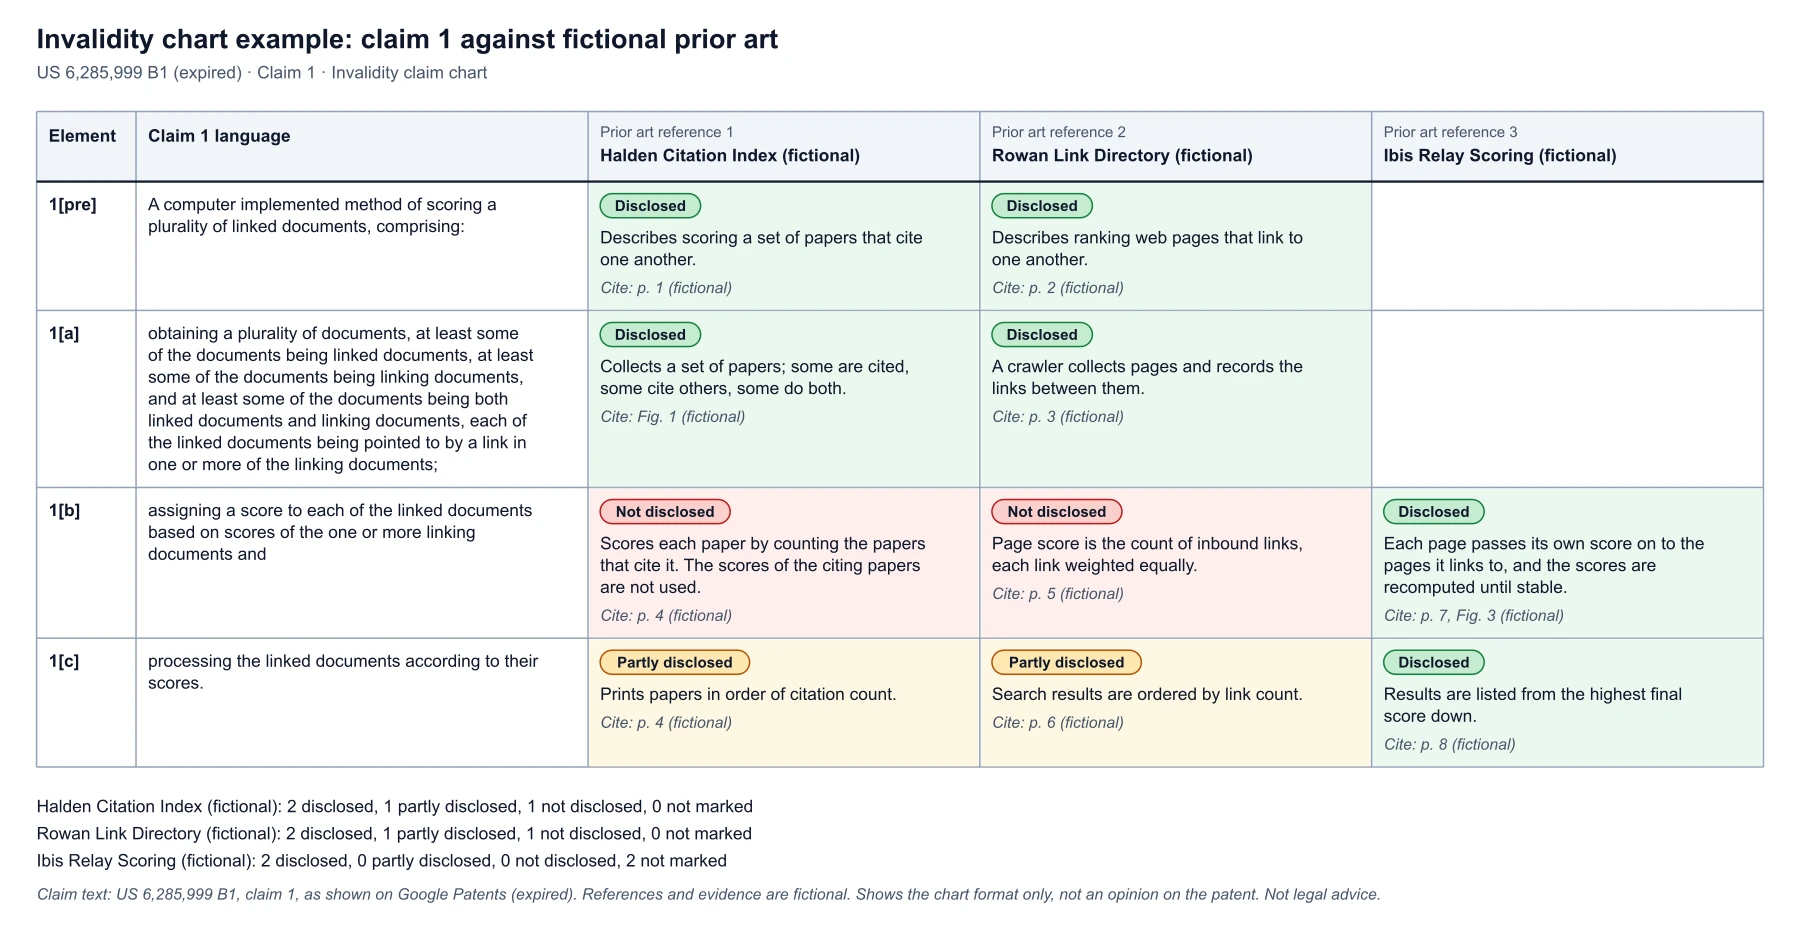
Take the invalidity example below. Its claim 1 has a preamble and three steps, so the elements are 1[pre], 1[a], 1[b] and 1[c]. The last two steps are joined by "and" without a semicolon, so the automatic split keeps them together; in the example they were separated by hand with the edit and insert buttons.
Example: an invalidity chart for an expired patent claim
The chart below uses claim 1 of US 6,285,999 B1, an expired patent, copied from Google Patents. The three prior art references are invented. Reading across the chart, the first two references describe the setting and the data gathering but are marked not disclosed for the scoring step 1[b], and are only a partial match for the ordering step 1[c]. The third reference carries the weight of 1[b] and 1[c], and its cells for 1[pre] and 1[a] are left empty because the chart does not rely on it there. An empty cell is part of the argument, so leave it empty rather than filling it.
Common claim chart mistakes
- Paraphrasing the claim. Copy the claim text word for word from the patent, then check the copy against a second source. A chart that changes a word can be answered by pointing at the word.
- Marking an element met without evidence. If you cannot write what supports it and where, leave it unmarked.
- Citing something you cannot find again. Give the document, the page or paragraph and, for web pages, the date you viewed it.
- Skipping the preamble and the closing whereby clause because they seem like filler. Chart them or note why they were left out.
- Merging two requirements into one element, so a partial match looks like a full one. Split the element.
- Charting a product version that is not the one at issue. Name the model, version and date of every document you rely on.
Claim charts and patent drawings
Claim charts and patent figures work from the same text. If you are drafting an application, the figures and reference numerals must support every claim element, and a chart of your own claims against the description is a quick check. The patent drawing generator drafts the figures. For background see the guide to patent drawing software and the patent drawing examples guide.
Using it responsibly
This is a formatting tool, not legal advice. It does not read the patent, check the evidence, construe the claim or tell you whether anything infringes or is invalid. Always copy claim language from the official patent document and check the current legal status of the patent, including any reexamination, certificate of correction or terminal disclaimer, before relying on a chart. Do not enter confidential client material on a shared computer. For a dispute, a license or a launch decision, have a patent attorney or patent agent review the chart.
Claim Chart Examples
Exact exports from the generator above, using fictional evidence
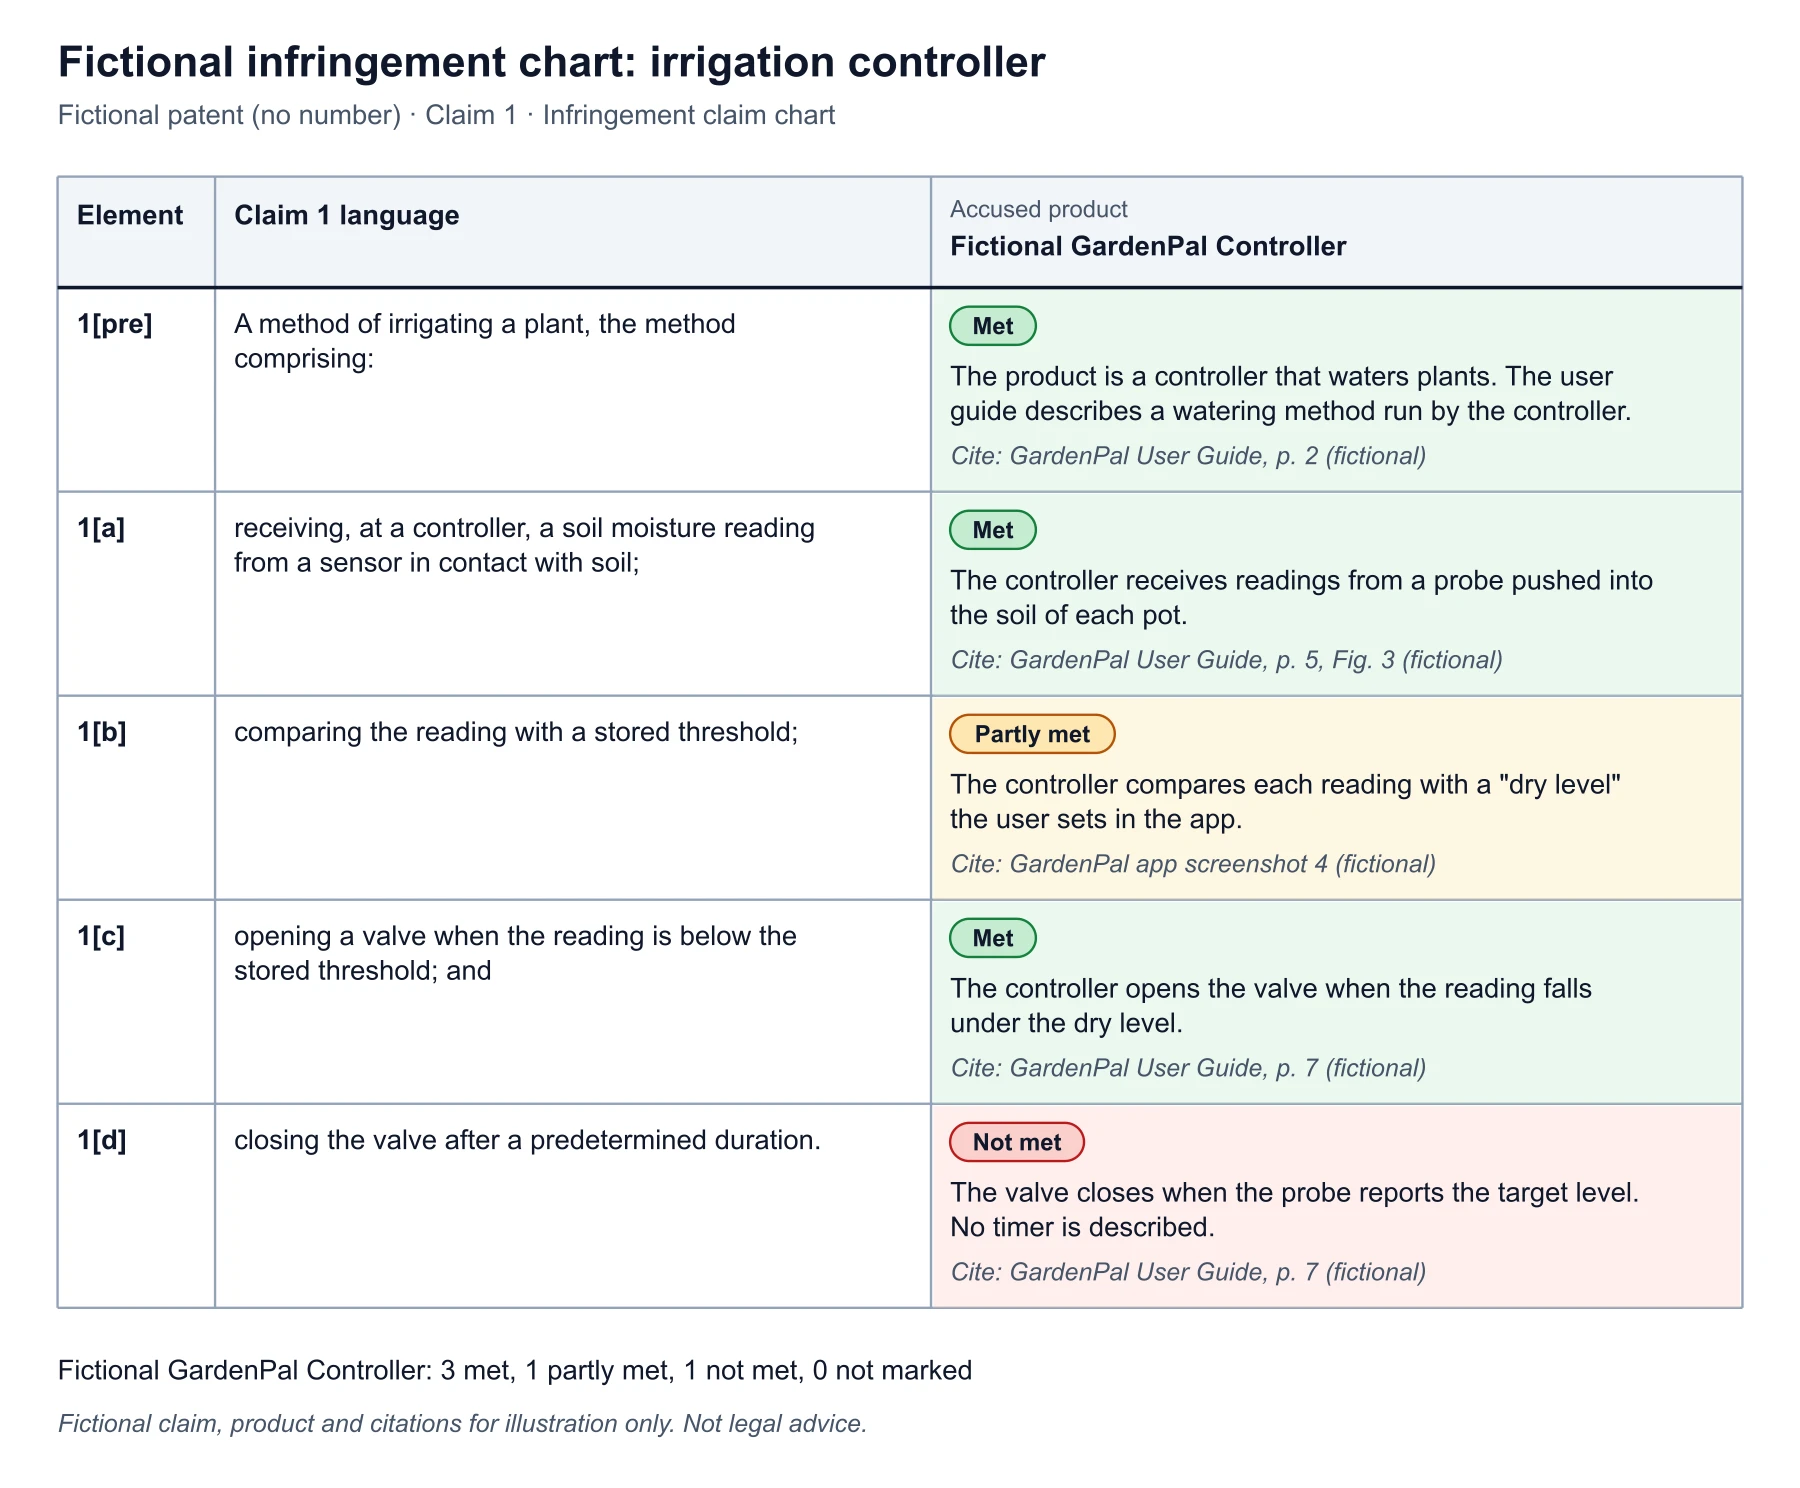
Infringement Claim Chart: Fictional Irrigation Controller
Exact render from fictional data: one accused product, three elements met, one partly met, one not met.
Invalidity Claim Chart: Three Prior Art References
Exact render: claim language from an expired patent, fictional references and evidence.
Why a claim chart is built element by element
In United States practice, a product infringes a claim only if it contains every element of that claim, either literally or by an equivalent. The chart follows that rule: one row per element, so a missing element is visible at once. Invalidity works the same way in reverse. To show that earlier work anticipates a claim, a reference generally has to show every element, and a combination of references has to be explained element by element. This is why claim charts share one layout, and why many courts ask for them. Some court patent rules require charts with the contentions, for example Patent L.R. 3-1(c) and 3-3(c) of the Northern District of California (rules revised October 19, 2023, checked October 2026). Check the rules and the standing orders of the court you are in.
What a claim chart does not show
A chart lines up words and evidence. It does not say how a court or the patent office would read a disputed term, and it does not weigh the evidence for you. Terms such as "sensor" or "threshold" may have a narrower or broader meaning than the plain words suggest once the description and the prosecution history are read, and the equivalents of a missing element may matter. Treat the marks as your working view, record the reason for each one in the evidence field, and revisit them when the reading of a term changes. A chart that is easy to update is more useful than one that looks final.
Where the example claim comes from
The invalidity example charts claim 1 of US 6,285,999 B1, "Method for node ranking in a linked database". The claim text was copied from Google Patents, which lists the patent as expired, with an anticipated expiration date of January 9, 2018 (checked October 2026). The Google Patents page shows no reexamination certificate for it. The three references and all their evidence are invented for the demonstration, so the chart shows how to lay out the work and says nothing about whether the real patent was valid. The infringement example uses an invented claim and an invented product.
Frequently Asked Questions
Related Patent & Planning Tools
 Engineering
Patent Drawing Generator
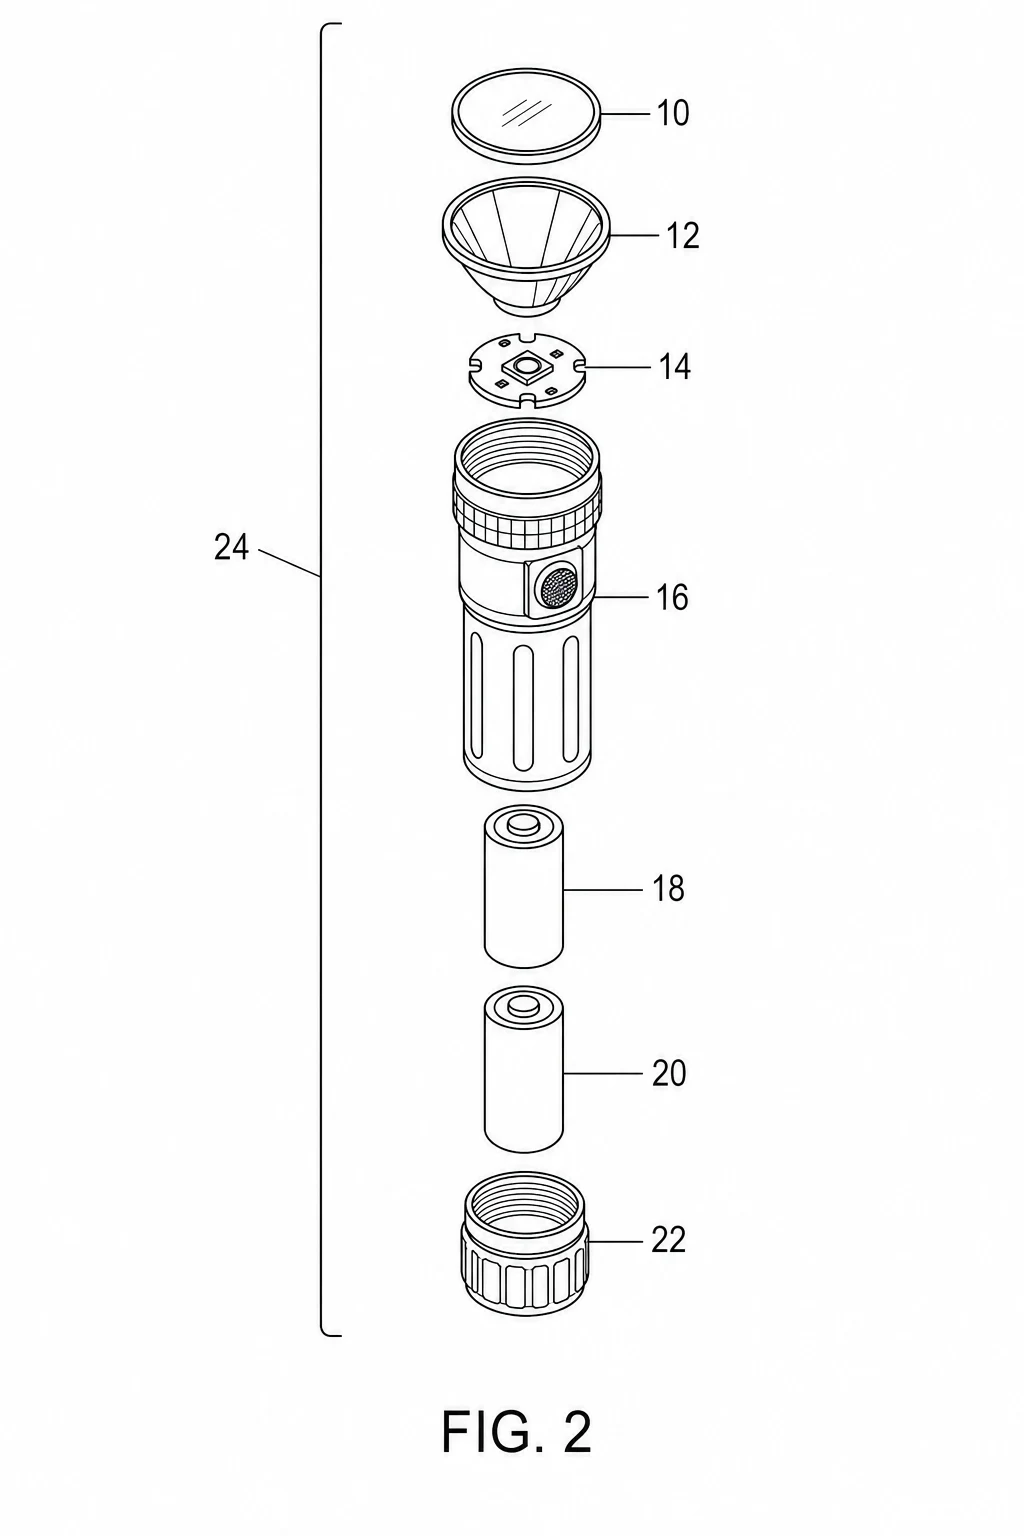
Draft black-and-white patent figures with FIG. labels and reference numerals for the same application.
 Business
Pugh Matrix Generator
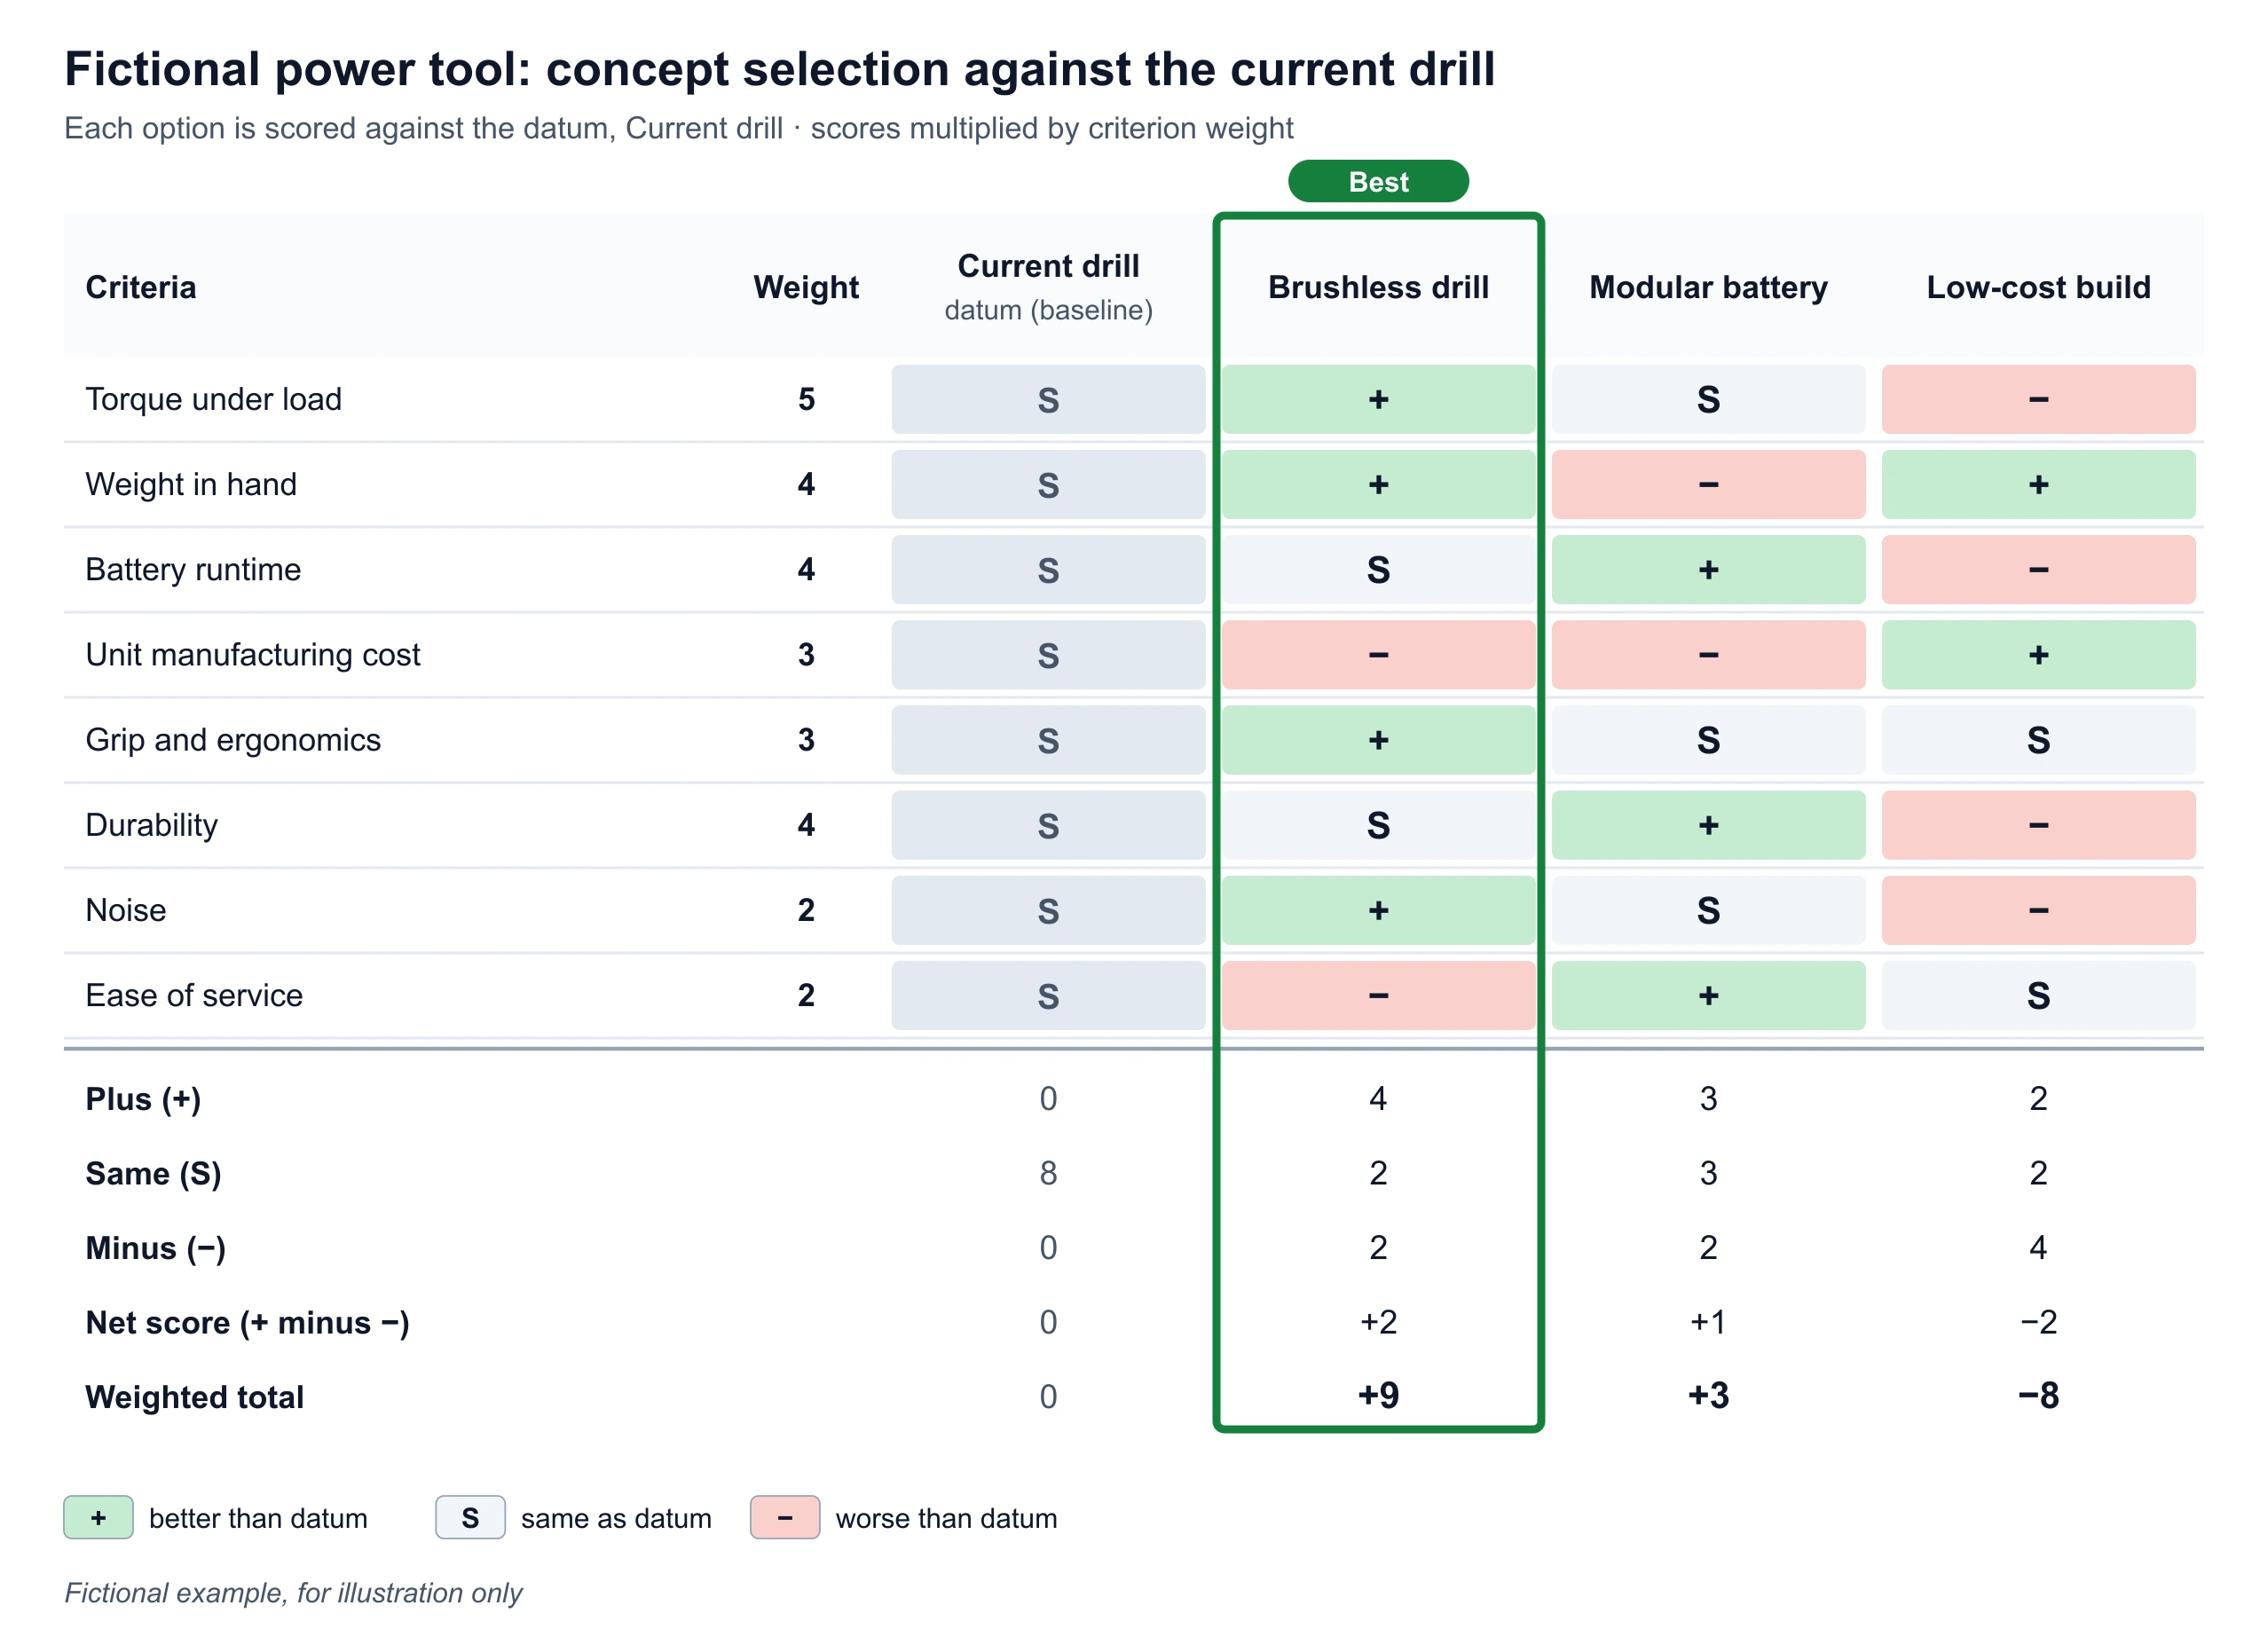
Score design or vendor options against a datum with weights when you need to rank rather than map evidence.
 Business
Issue Tree Generator
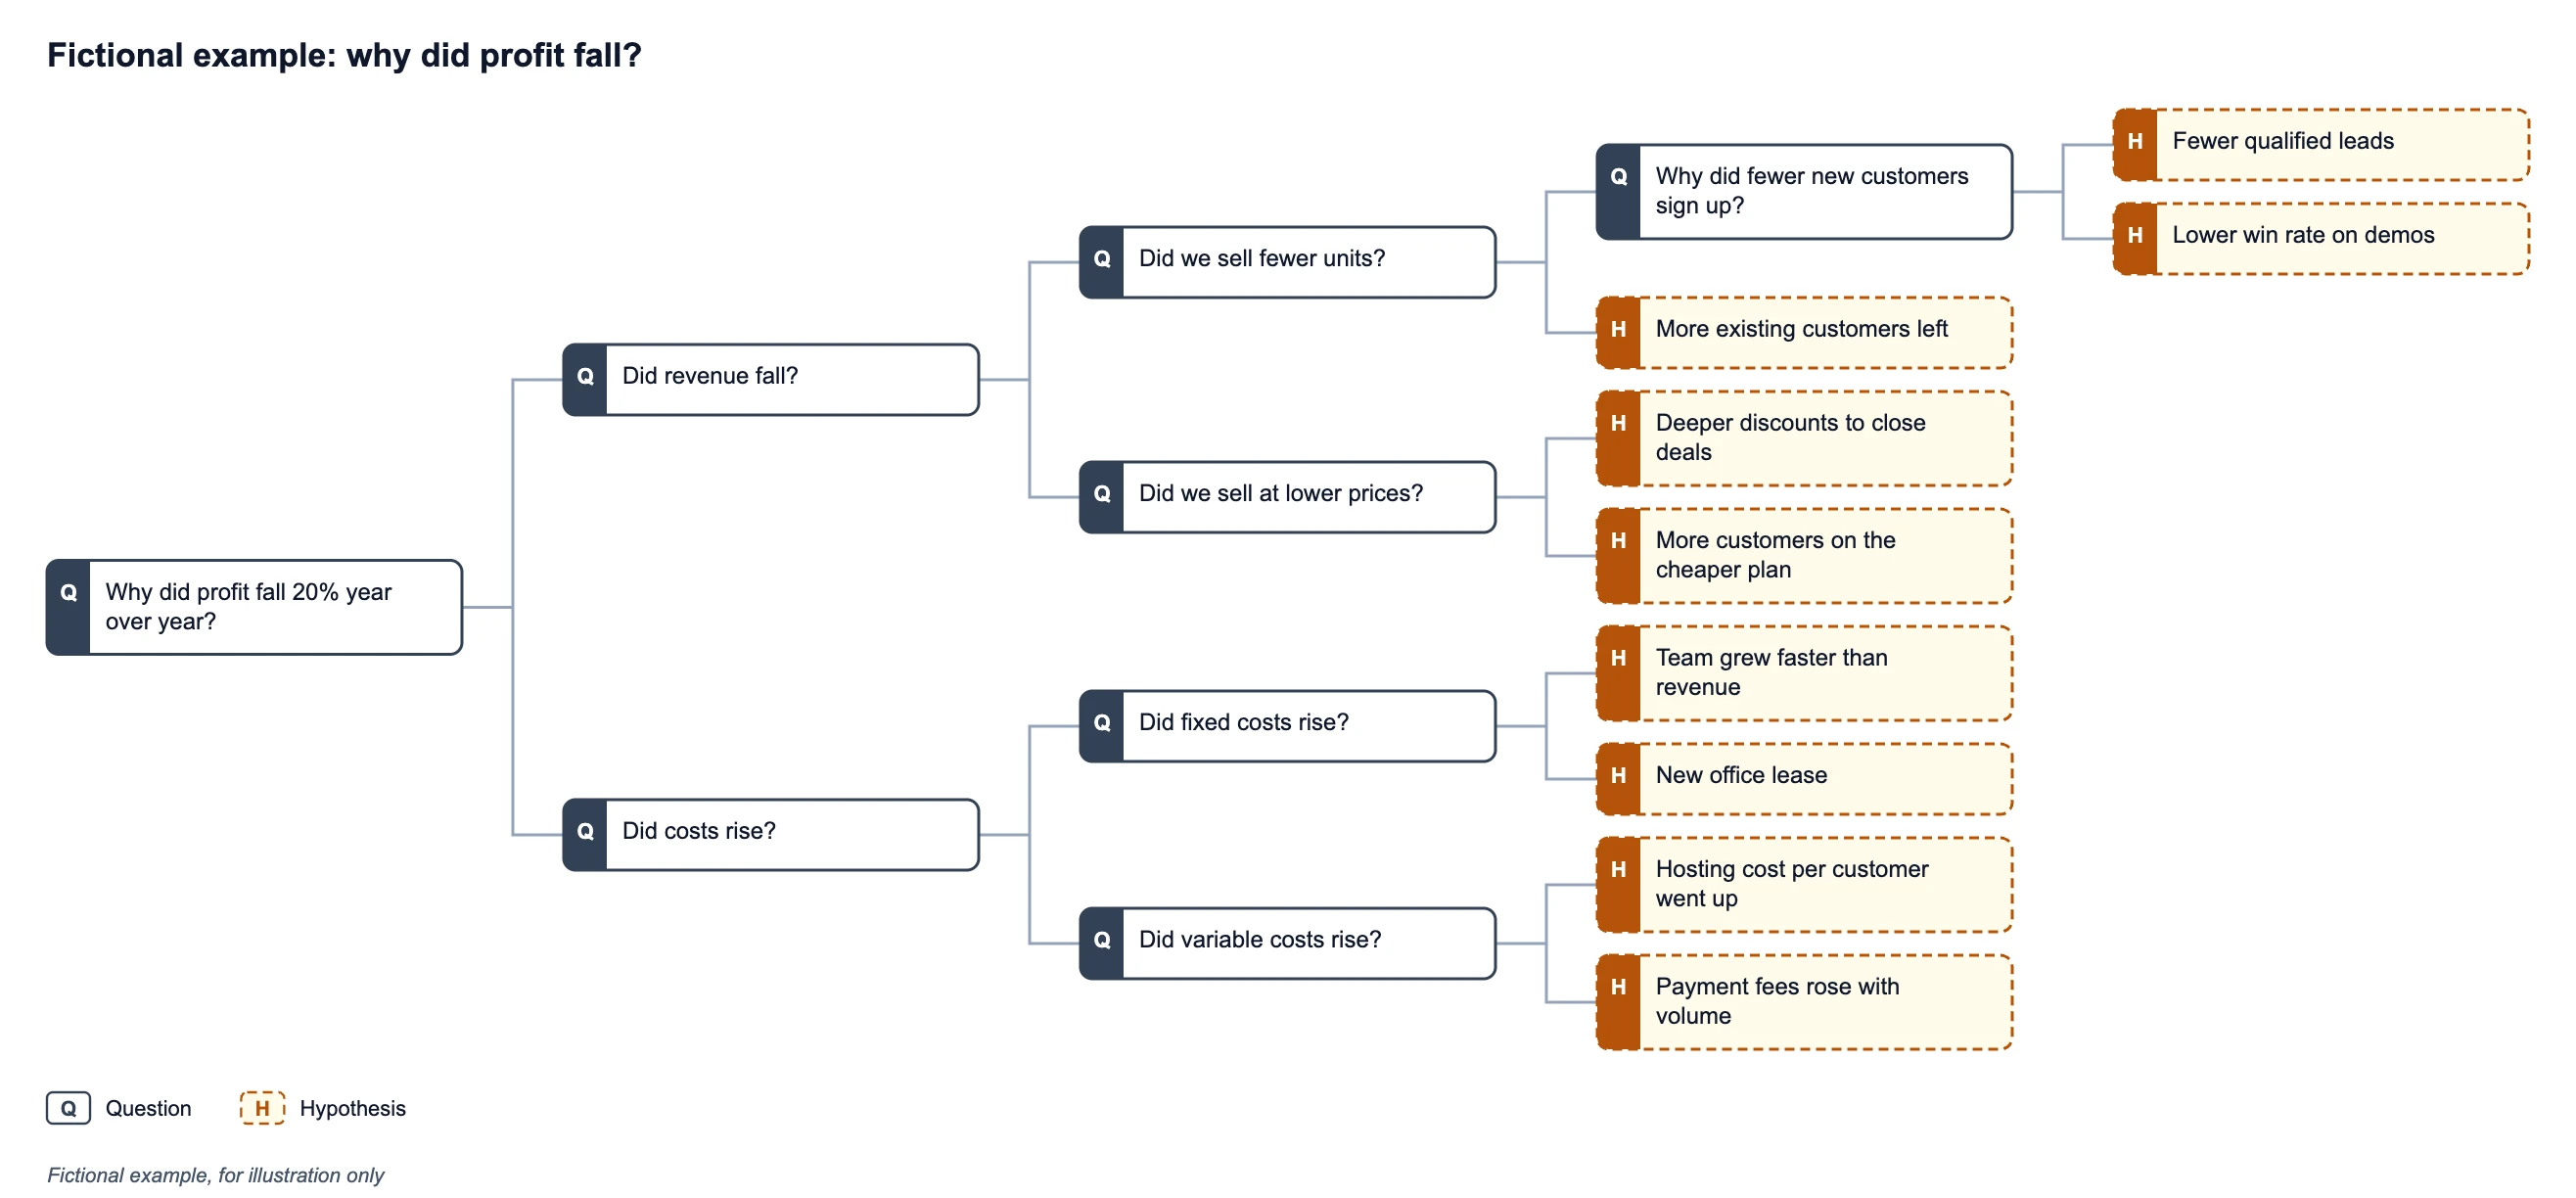
Break a question such as "is this claim valid" into branches and hypotheses before you chart.
 Research
Comparison Chart Maker
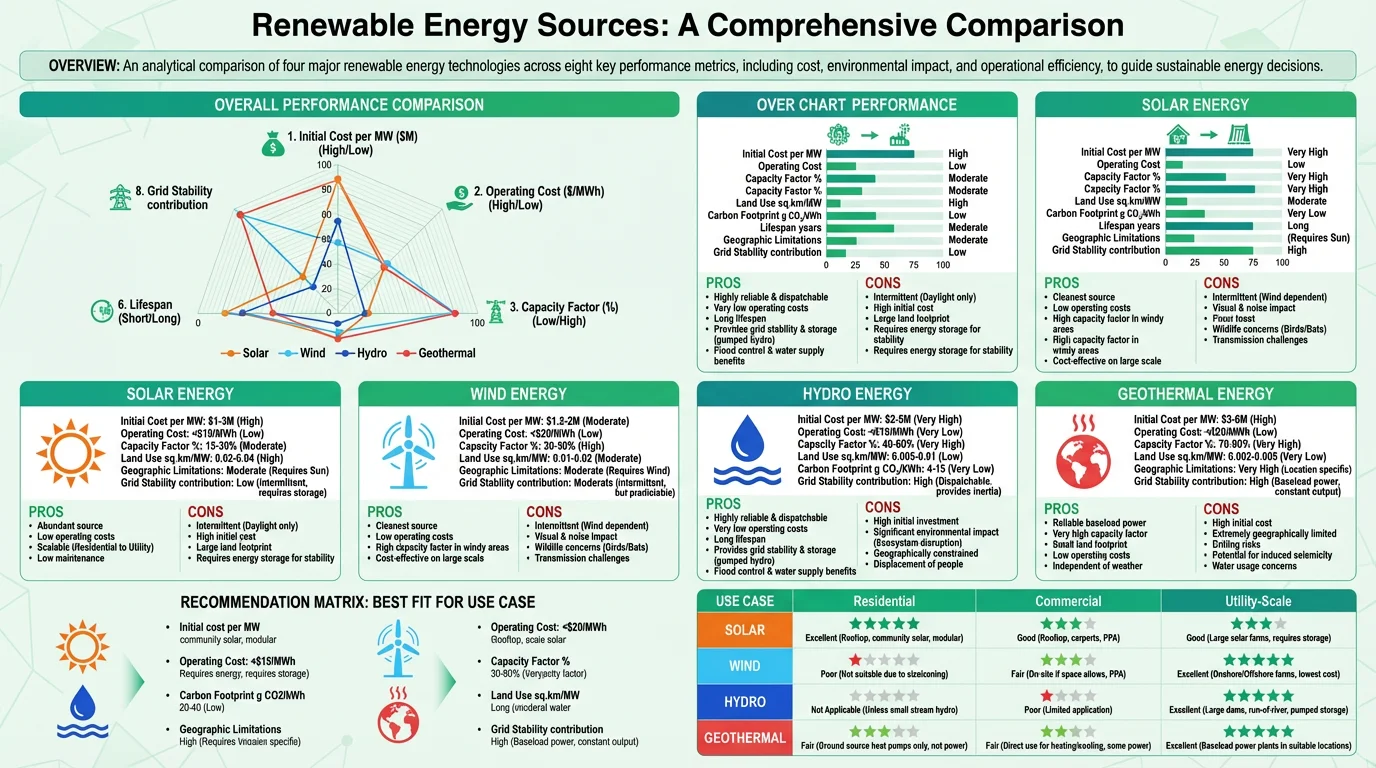
Lay products side by side in a feature table when you are describing rather than charting claims.
 Business
Risk Heat Map Maker
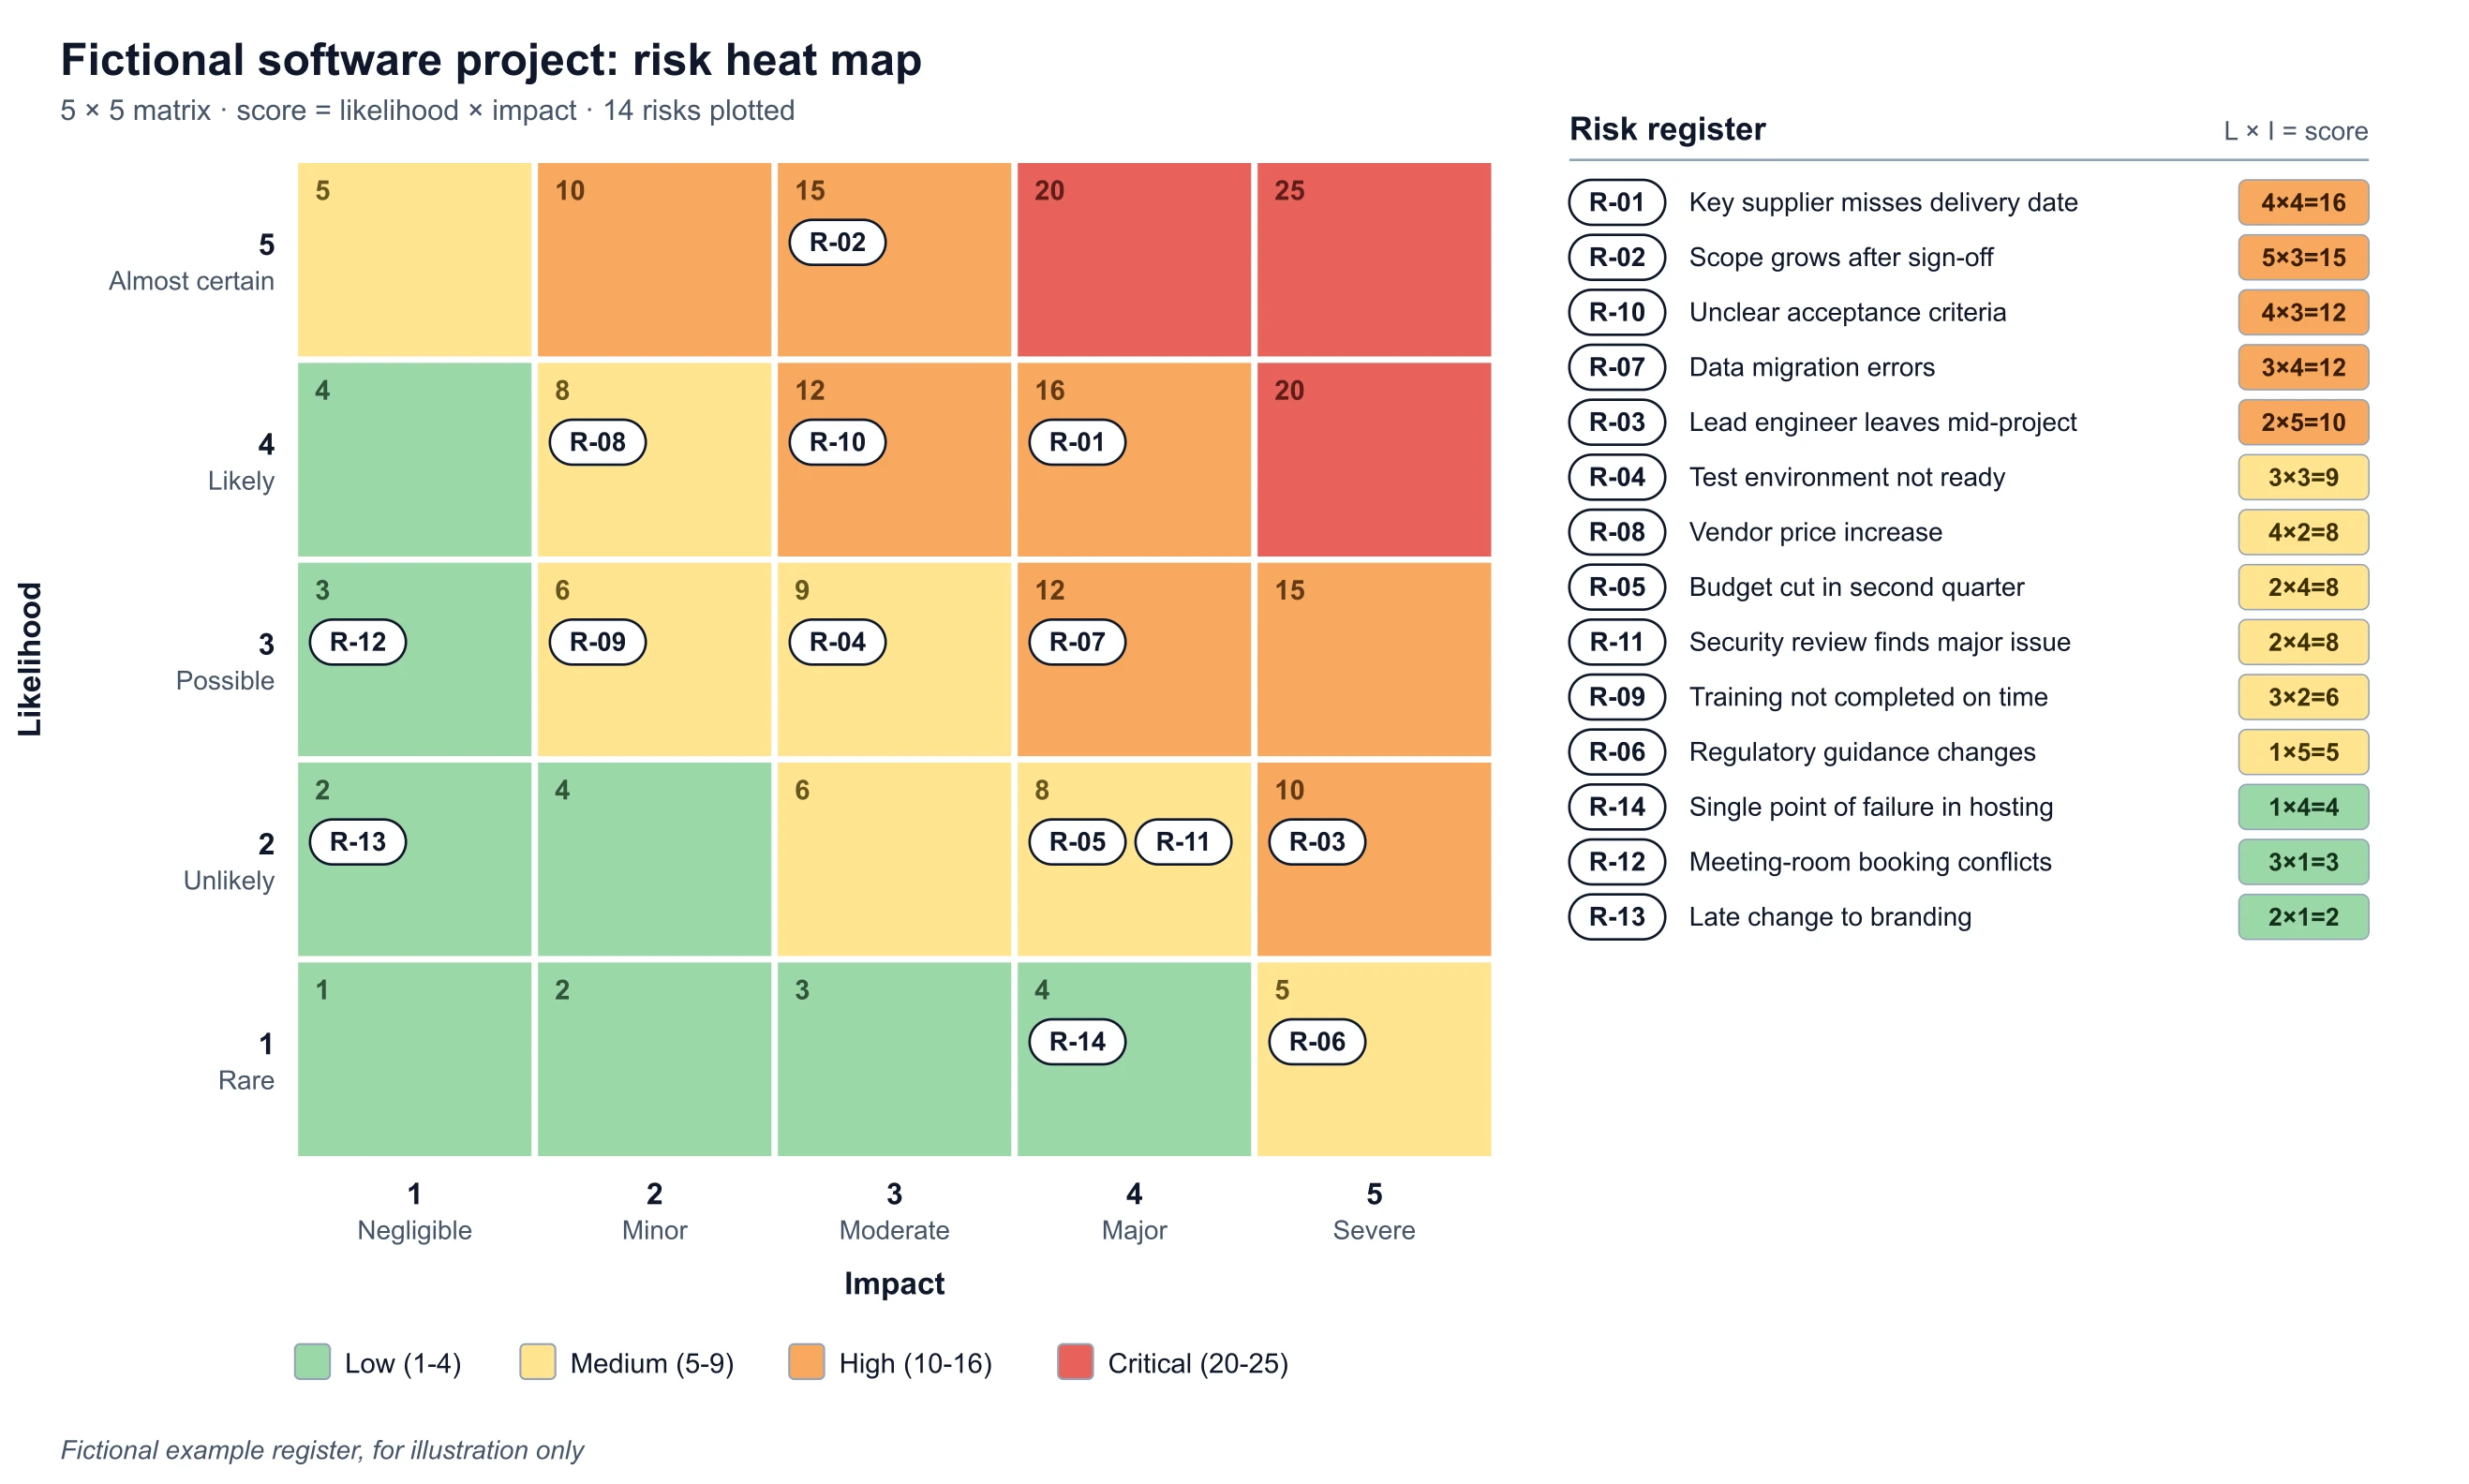
Rank the risks of a launch, including patent risk, on a likelihood and impact grid.