Logic Model Generator for Programs & Grants
Free logic model generator — map your program’s inputs, activities, outputs, outcomes, and impact into a clean diagram. Editable columns, export SVG.
Enter your inputs, activities, outputs and outcomes — renders an exact logic model as SVG, free
Logic Model Generator
Free to try ·
Your AI logic model will appear here
For an exact, editable model, use the Precise Model tab instead
Logic Model Examples
Exact engine renders plus AI illustrations across program types
Standard Program Logic Model
Exact engine render — the standard five-column Inputs-to-Impact logic model.
Short / Medium / Long-Term Outcomes
Exact engine render — outcomes split into short, medium, and long term across six columns.
Nonprofit Program
AI illustration — a nonprofit community program logic model for a grant proposal.
Education Program
AI illustration — an education program with student learning outcomes.
Public Health Program
AI illustration — a public health intervention with community health outcomes.
Research Project
AI illustration — a funded research project from resources to research impact.
What is a logic model?
A logic model is a diagram that lays out how a program is meant to work — the chain of reasoning from the resources you put in to the change you hope to see. It reads left to right through a series of linked columns, usually Inputs, Activities, Outputs, Outcomes, and Impact, connected by "if-then" arrows: if we have these inputs, then we can run these activities; if we run these activities, then we produce these outputs; and so on. Logic models are a staple of grant proposals, program planning, and evaluation because they make a program’s theory of change explicit on a single page. This generator builds one for you — type your columns and items on the left and the exact SVG updates instantly on the right.
The columns of a logic model
- Inputs — the resources invested: staff, funding, materials, partners, and time.
- Activities — what the program actually does with those inputs: workshops, services, outreach.
- Outputs — the direct, countable products of the activities: sessions delivered, people reached.
- Outcomes — the changes in knowledge, skills, or behavior that result, often split into short, medium, and long term.
- Impact — the long-term, higher-level change the program contributes to in the community or field.
How to make your logic model
- Start from the default Inputs → Activities → Outputs → Outcomes → Impact columns, or rename them to match your framework.
- Add an item to each column for every resource, activity, output, or outcome — add or remove items and whole columns as you need.
- Note your assumptions and external factors in the field below the chain — these are part of a complete logic model.
- Download a clean, scalable SVG for your grant proposal, report, or slides — free, with no sign-up.
Logic model vs theory of change vs conceptual framework
These three are related but distinct. A logic model is the most operational: a linear chain from inputs to impact, ideal for planning and evaluating a specific program. A theory of change is broader and works backward from a long-term goal, mapping the pathways and preconditions needed to reach it. A conceptual framework, more common in academic research, diagrams the variables and relationships behind a study rather than a program. If you are planning or evaluating a program, a logic model is usually what a funder asks for; for a research study, use the conceptual framework generator instead.
Logic models in a grant proposal
Most funders now expect a logic model in the proposal, and it often anchors the evaluation plan. A strong one keeps each column tight — a handful of clear items, not a wall of text — and makes the arrows defensible so a reviewer can trace how your activities lead to the outcomes you promise. Spell out assumptions and external factors so the model does not overstate what the program alone can achieve. This tool renders the diagram from the columns you enter; pair it with a conceptual framework for the underlying theory, or a PRISMA flow diagram and forest plot if your proposal reviews prior evidence.
Frequently Asked Questions
Related Research Tools
 Research
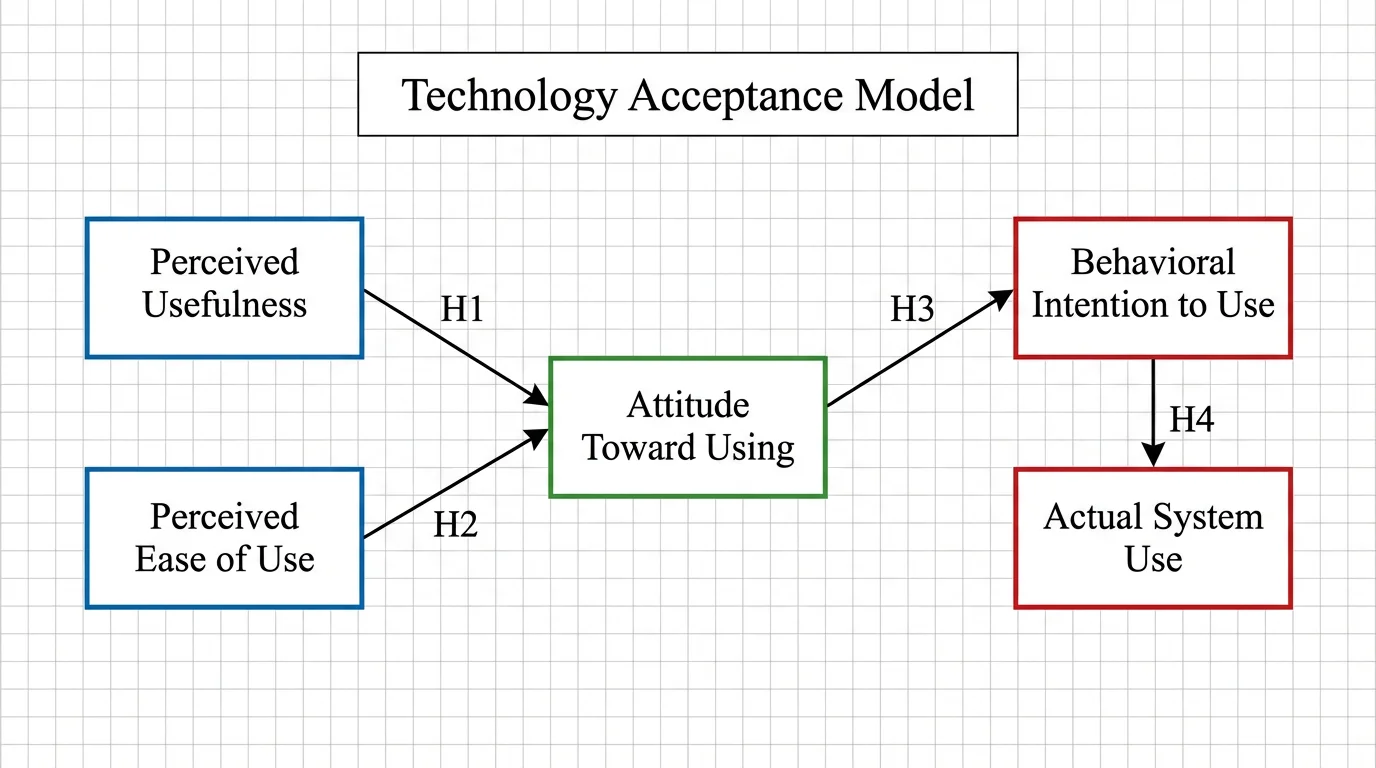
Conceptual Framework Generator
Diagram the variables and relationships behind your study or thesis.
 Research
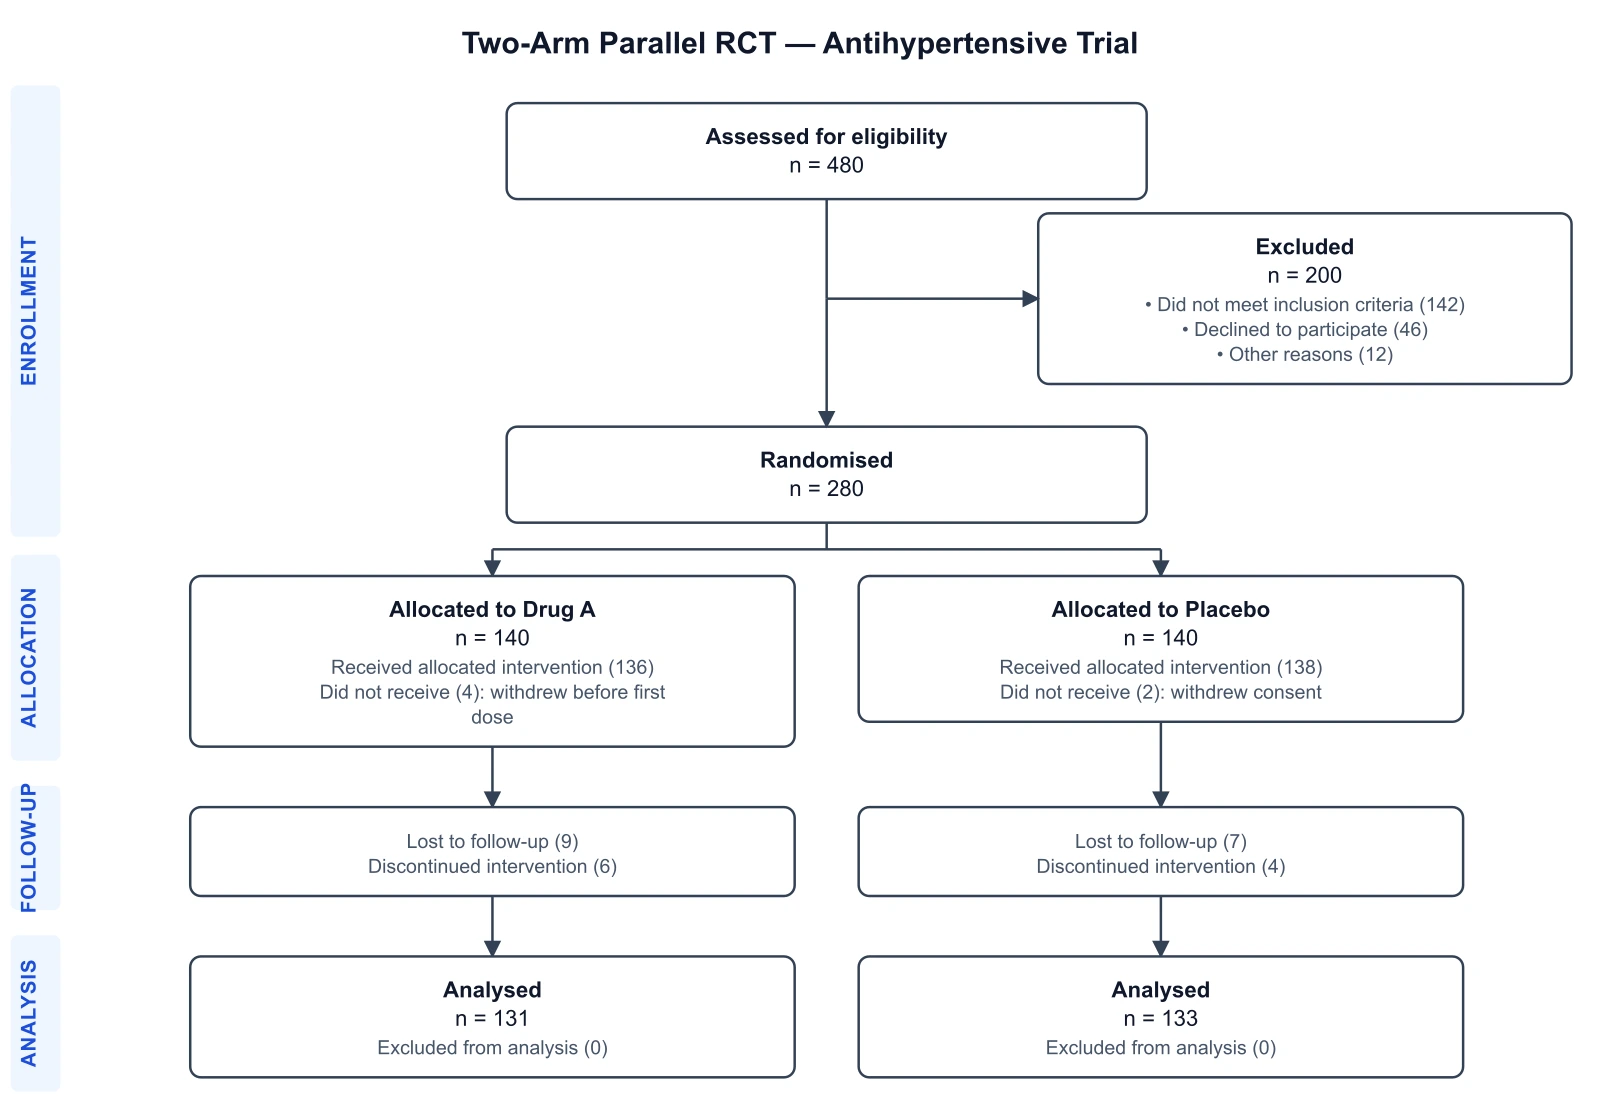
CONSORT Diagram Generator
Draw a CONSORT 2010 participant flow diagram for a randomized controlled trial.
 Research
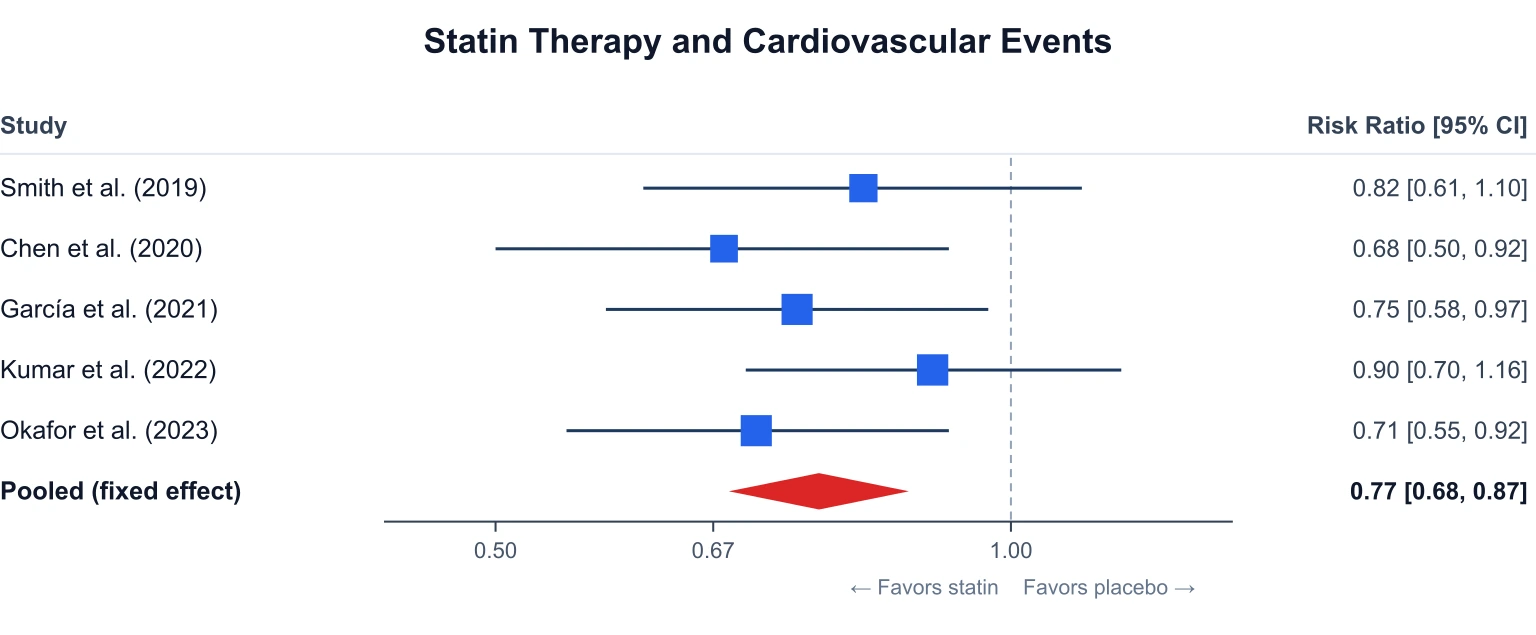
Forest Plot Generator
Plot pooled effect sizes with confidence intervals for a meta-analysis.
 Research
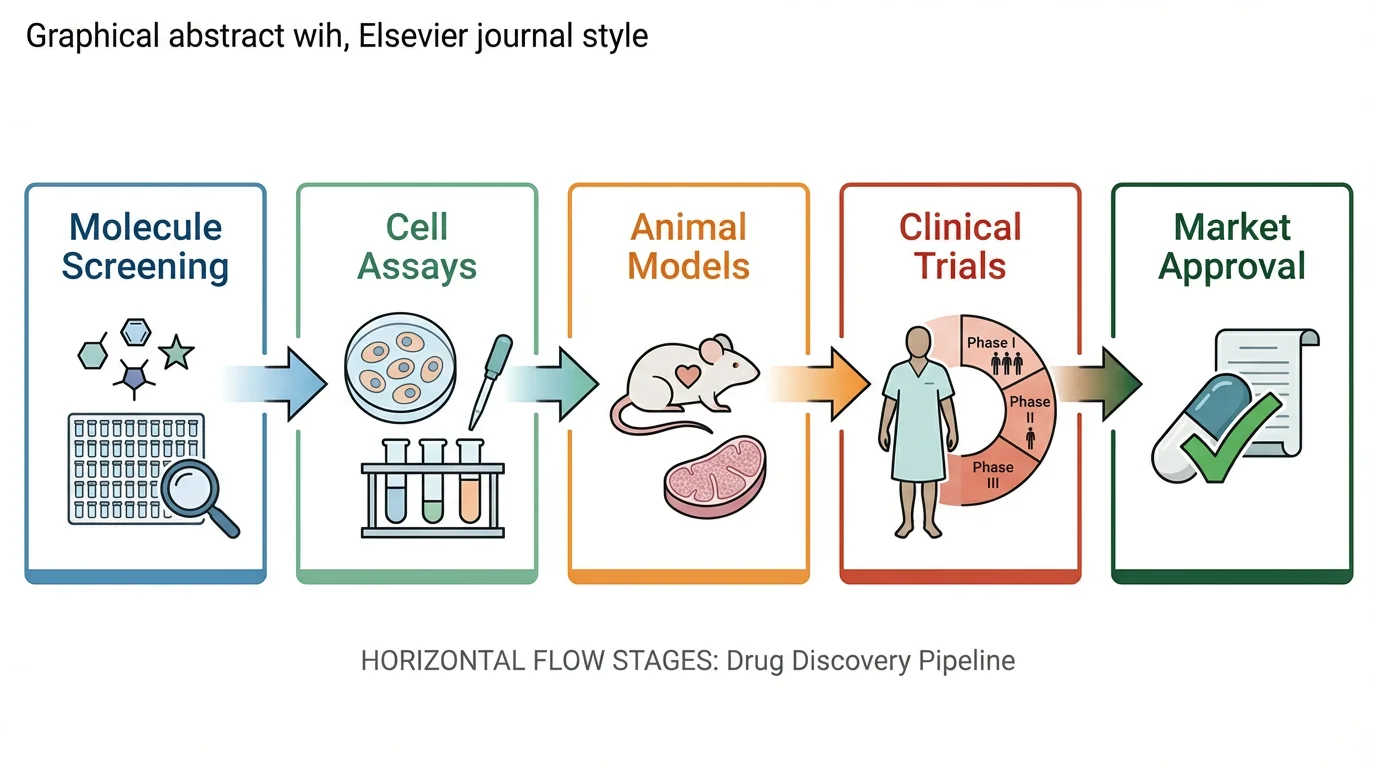
Graphical Abstract Maker
Summarize your paper or project in one publication-ready figure.
 Research
Scientific Poster Generator
Lay out a conference research poster with your figures and sections.