Decision Tree Maker for Decision Analysis
Make a decision tree online with AI. Describe a decision — your options, the uncertain outcomes, their probabilities, and the payoffs — and get a clean diagram with decision nodes, chance nodes, and branches you can use for decision analysis. Download as PNG.
Decision Tree Generator
Free to try ·
Your decision tree will appear here
Describe your decision scenario and click Generate
Decision Tree Examples
Decision-analysis, risk, clinical, and machine-learning trees with nodes, branches, and payoffs
Business Investment Decision
A classic decision-analysis tree: one decision, three options, chance nodes for the market, and expected values at the end.
Clinical Decision Tree
A diagnostic pathway — each test outcome branches into the next decision, with probabilities along the way.
Machine-Learning Tree
The data-science kind: feature splits, Gini impurity, and a predicted class at every leaf.
Risk Analysis Tree
Map risks by category and severity, with probabilities and a recommended response at each endpoint.
Methodology Choice
Choosing an approach: branch by team size and complexity, compare timeline and success odds.
Simple Yes/No Tree
A plain branching tree of yes/no questions ending in a clear recommendation — no probabilities needed.
What is a decision tree?
A decision tree is a diagram that maps out a decision, the events that follow it, and the outcomes you could end up with — read left to right, from the first choice to the final results. It starts with the decision you control, fans out into the options you could take, then branches again into the things you cannot control, like how the market reacts or whether a test comes back positive. Because every path is laid out side by side, a decision tree turns a fuzzy "what should we do?" into a clear picture you can compare, discuss, and put a number on. That is exactly what this maker draws for you — every node, branch, and endpoint placed and labeled.
The elements of a decision tree
- Decision nodes (squares): a point where you choose. Each square is a moment of control, and its branches are the options you could take.
- Chance nodes (circles): a point where uncertainty takes over. The branches off a circle are the possible events — strong vs weak market, pass vs fail — usually with a probability on each.
- Branches: the lines connecting nodes. They represent an option you pick or an outcome that occurs, and they are labeled with what they mean.
- End nodes / payoffs (triangles): the tips of the tree, where each complete path lands. These hold the result — a profit or loss, a recommendation, or an expected value — so you can compare paths at a glance.
How to build a decision tree
- Start with the decision. Put a square on the left for the choice you face, and draw a branch for each realistic option.
- Add what happens next. Where an outcome is uncertain, add a chance node (circle) and branch it into the possible events.
- Estimate the probabilities. Put a likelihood on each chance branch — the branches off one circle should add up to 100%.
- Assign values to the endpoints. At each end node, write the payoff: the cost, profit, or score for reaching that result.
- Read it back and compare. With options, outcomes, probabilities, and payoffs in place, the tree shows you which path is strongest. To build one fast, just describe the decision in plain language below and let the AI lay it out.
Using a decision tree for decision analysis
The real power of a decision tree shows up when you "roll it back." Starting from the payoffs on the right, you work leftward: at each chance node you compute the expected value — multiply every outcome by its probability and add them up — and at each decision node you keep the option with the best expected value. By the time you reach the first square, the tree has told you which choice maximizes your expected return given the uncertainty you face. This is why decision trees are a staple of business cases, risk analysis, and management courses: they make the trade-off between a safe, modest payoff and a risky, high-upside one explicit instead of leaving it to gut feel.
Decision tree vs flowchart
A decision tree and a flowchart can look similar, but they answer different questions. A flowchart documents a process — the steps, conditions, and loops of something that already happens, like an approval workflow or an algorithm. A decision tree models a choice under uncertainty: it weighs options against outcomes and probabilities to help you decide what to do. Put simply, a flowchart shows how a process runs, while a decision tree helps you pick the best path before you commit. If you actually need to map a workflow rather than weigh a decision, the flowchart generator is the better fit; for branching ideas, try the mind map maker.
Business decision trees vs machine-learning trees
The phrase "decision tree" means two related things. In business and decision analysis — the focus of this tool — a person draws the tree by hand to reason about a choice: the nodes are decisions and chance events, and the goal is to pick the best option. In machine learning, a decision tree is a predictive model an algorithm learns from data: each node is an automatic split on a feature (such as "monthly charges > $70"), and the leaves predict a class or value, with metrics like Gini impurity at each split. Both share the branching shape, which is why this maker can draw either — but if you describe a business choice you will get a decision-analysis tree, and if you describe feature splits and classes you will get the machine-learning style.
Frequently Asked Questions
Related Diagram Tools
 Business
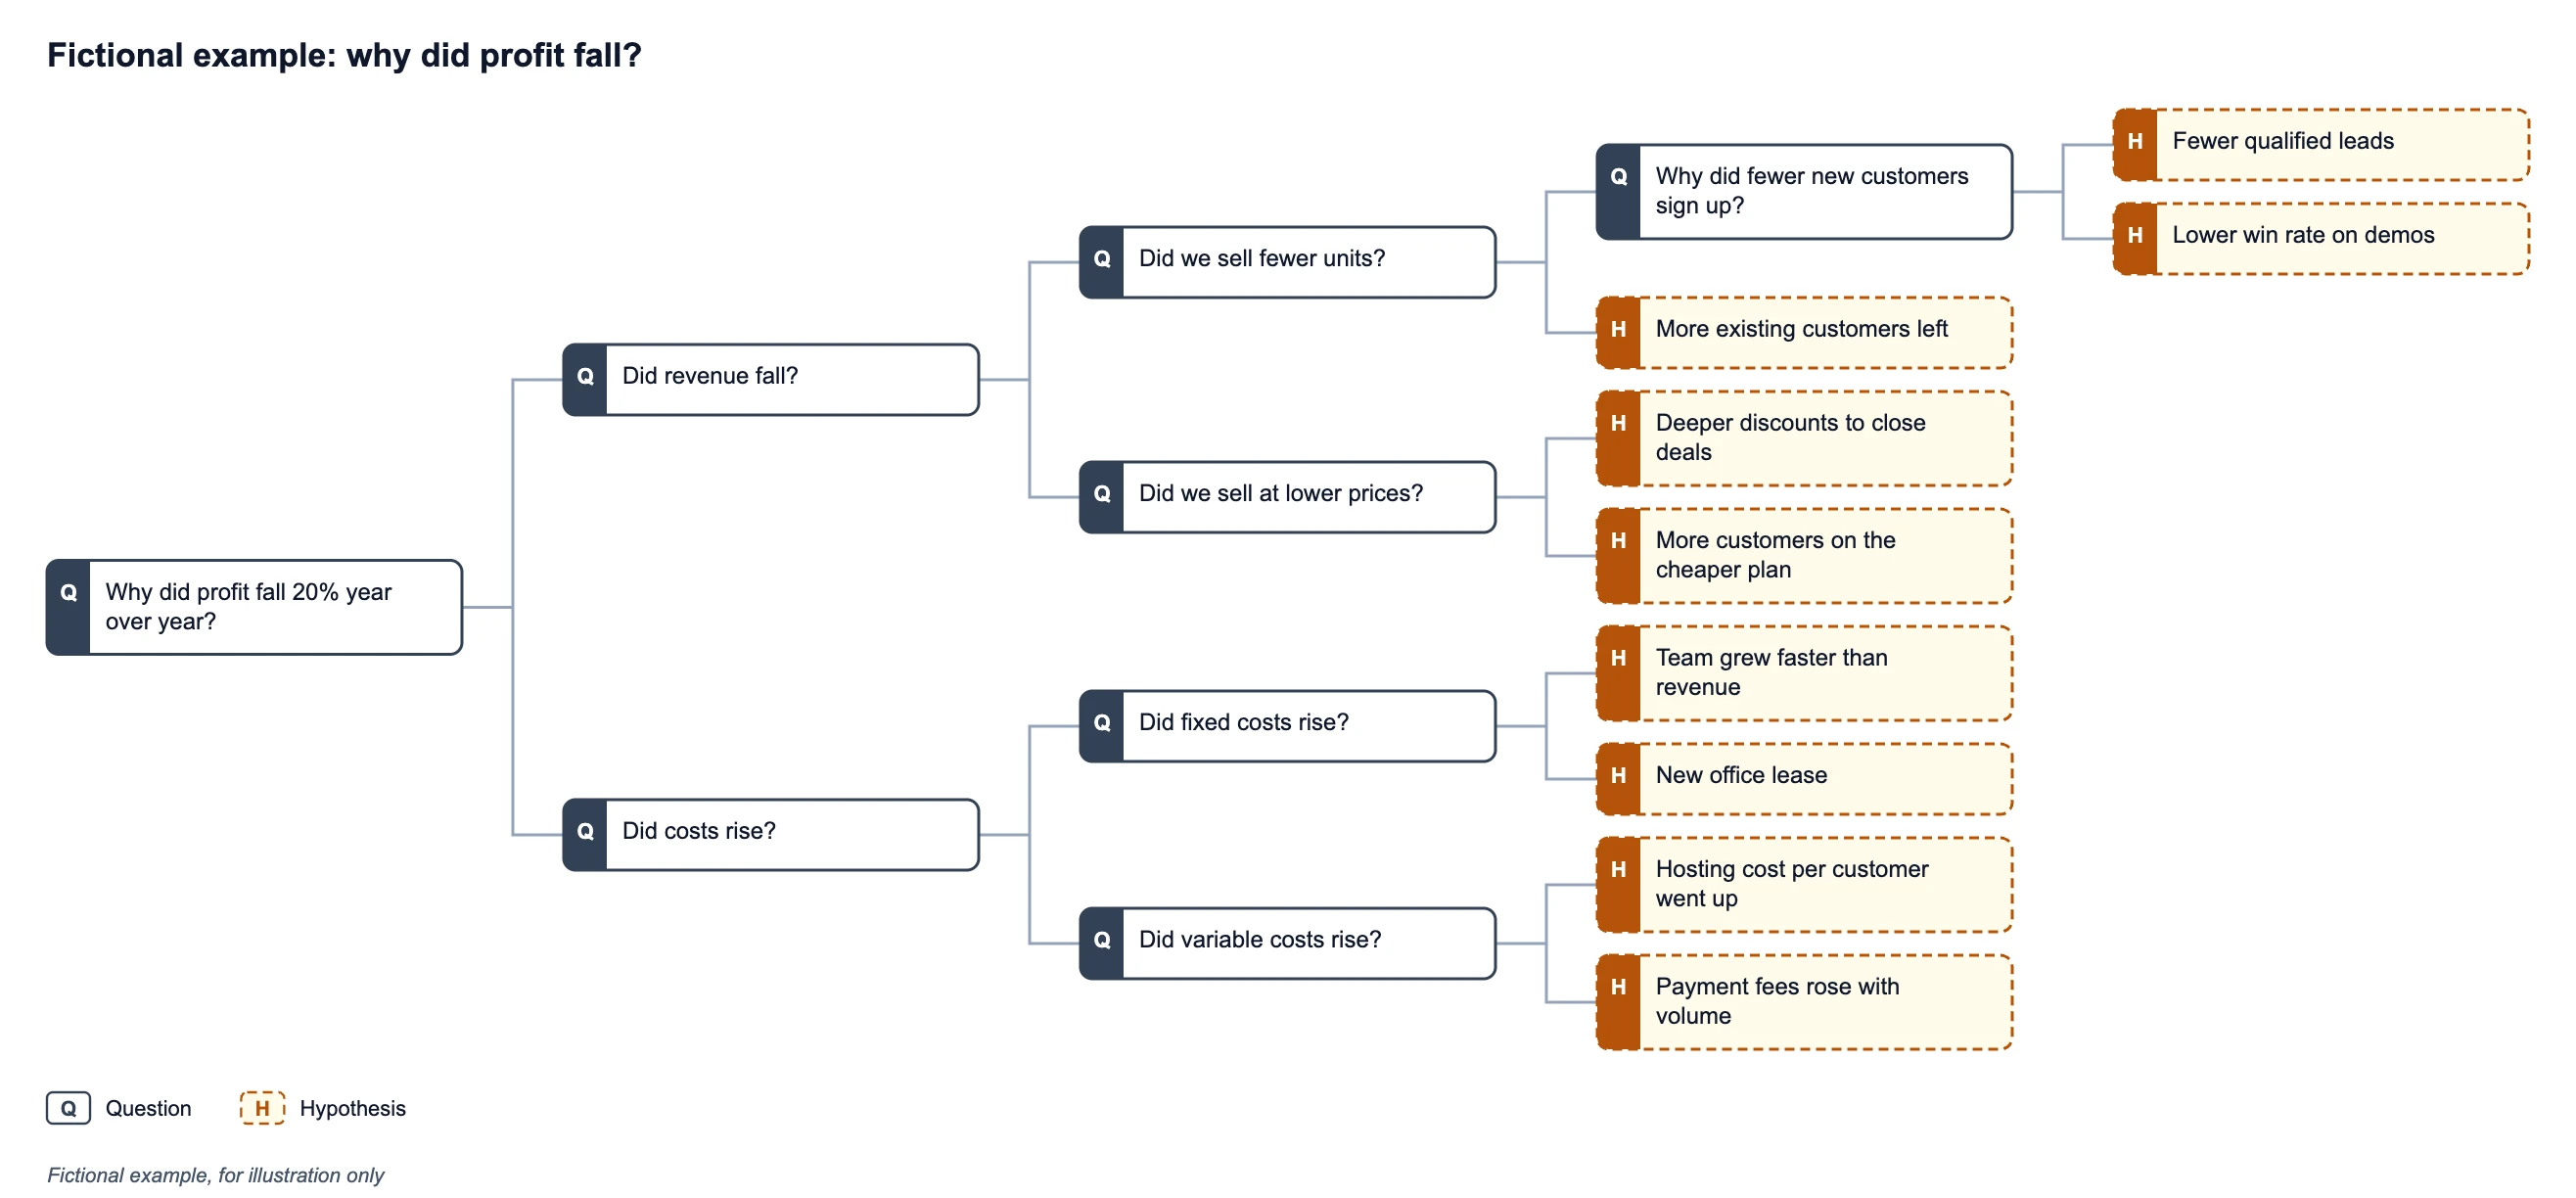
Issue Tree Generator
For problem diagnosis rather than choices: break one question into MECE branches and add driver values.
 Diagram
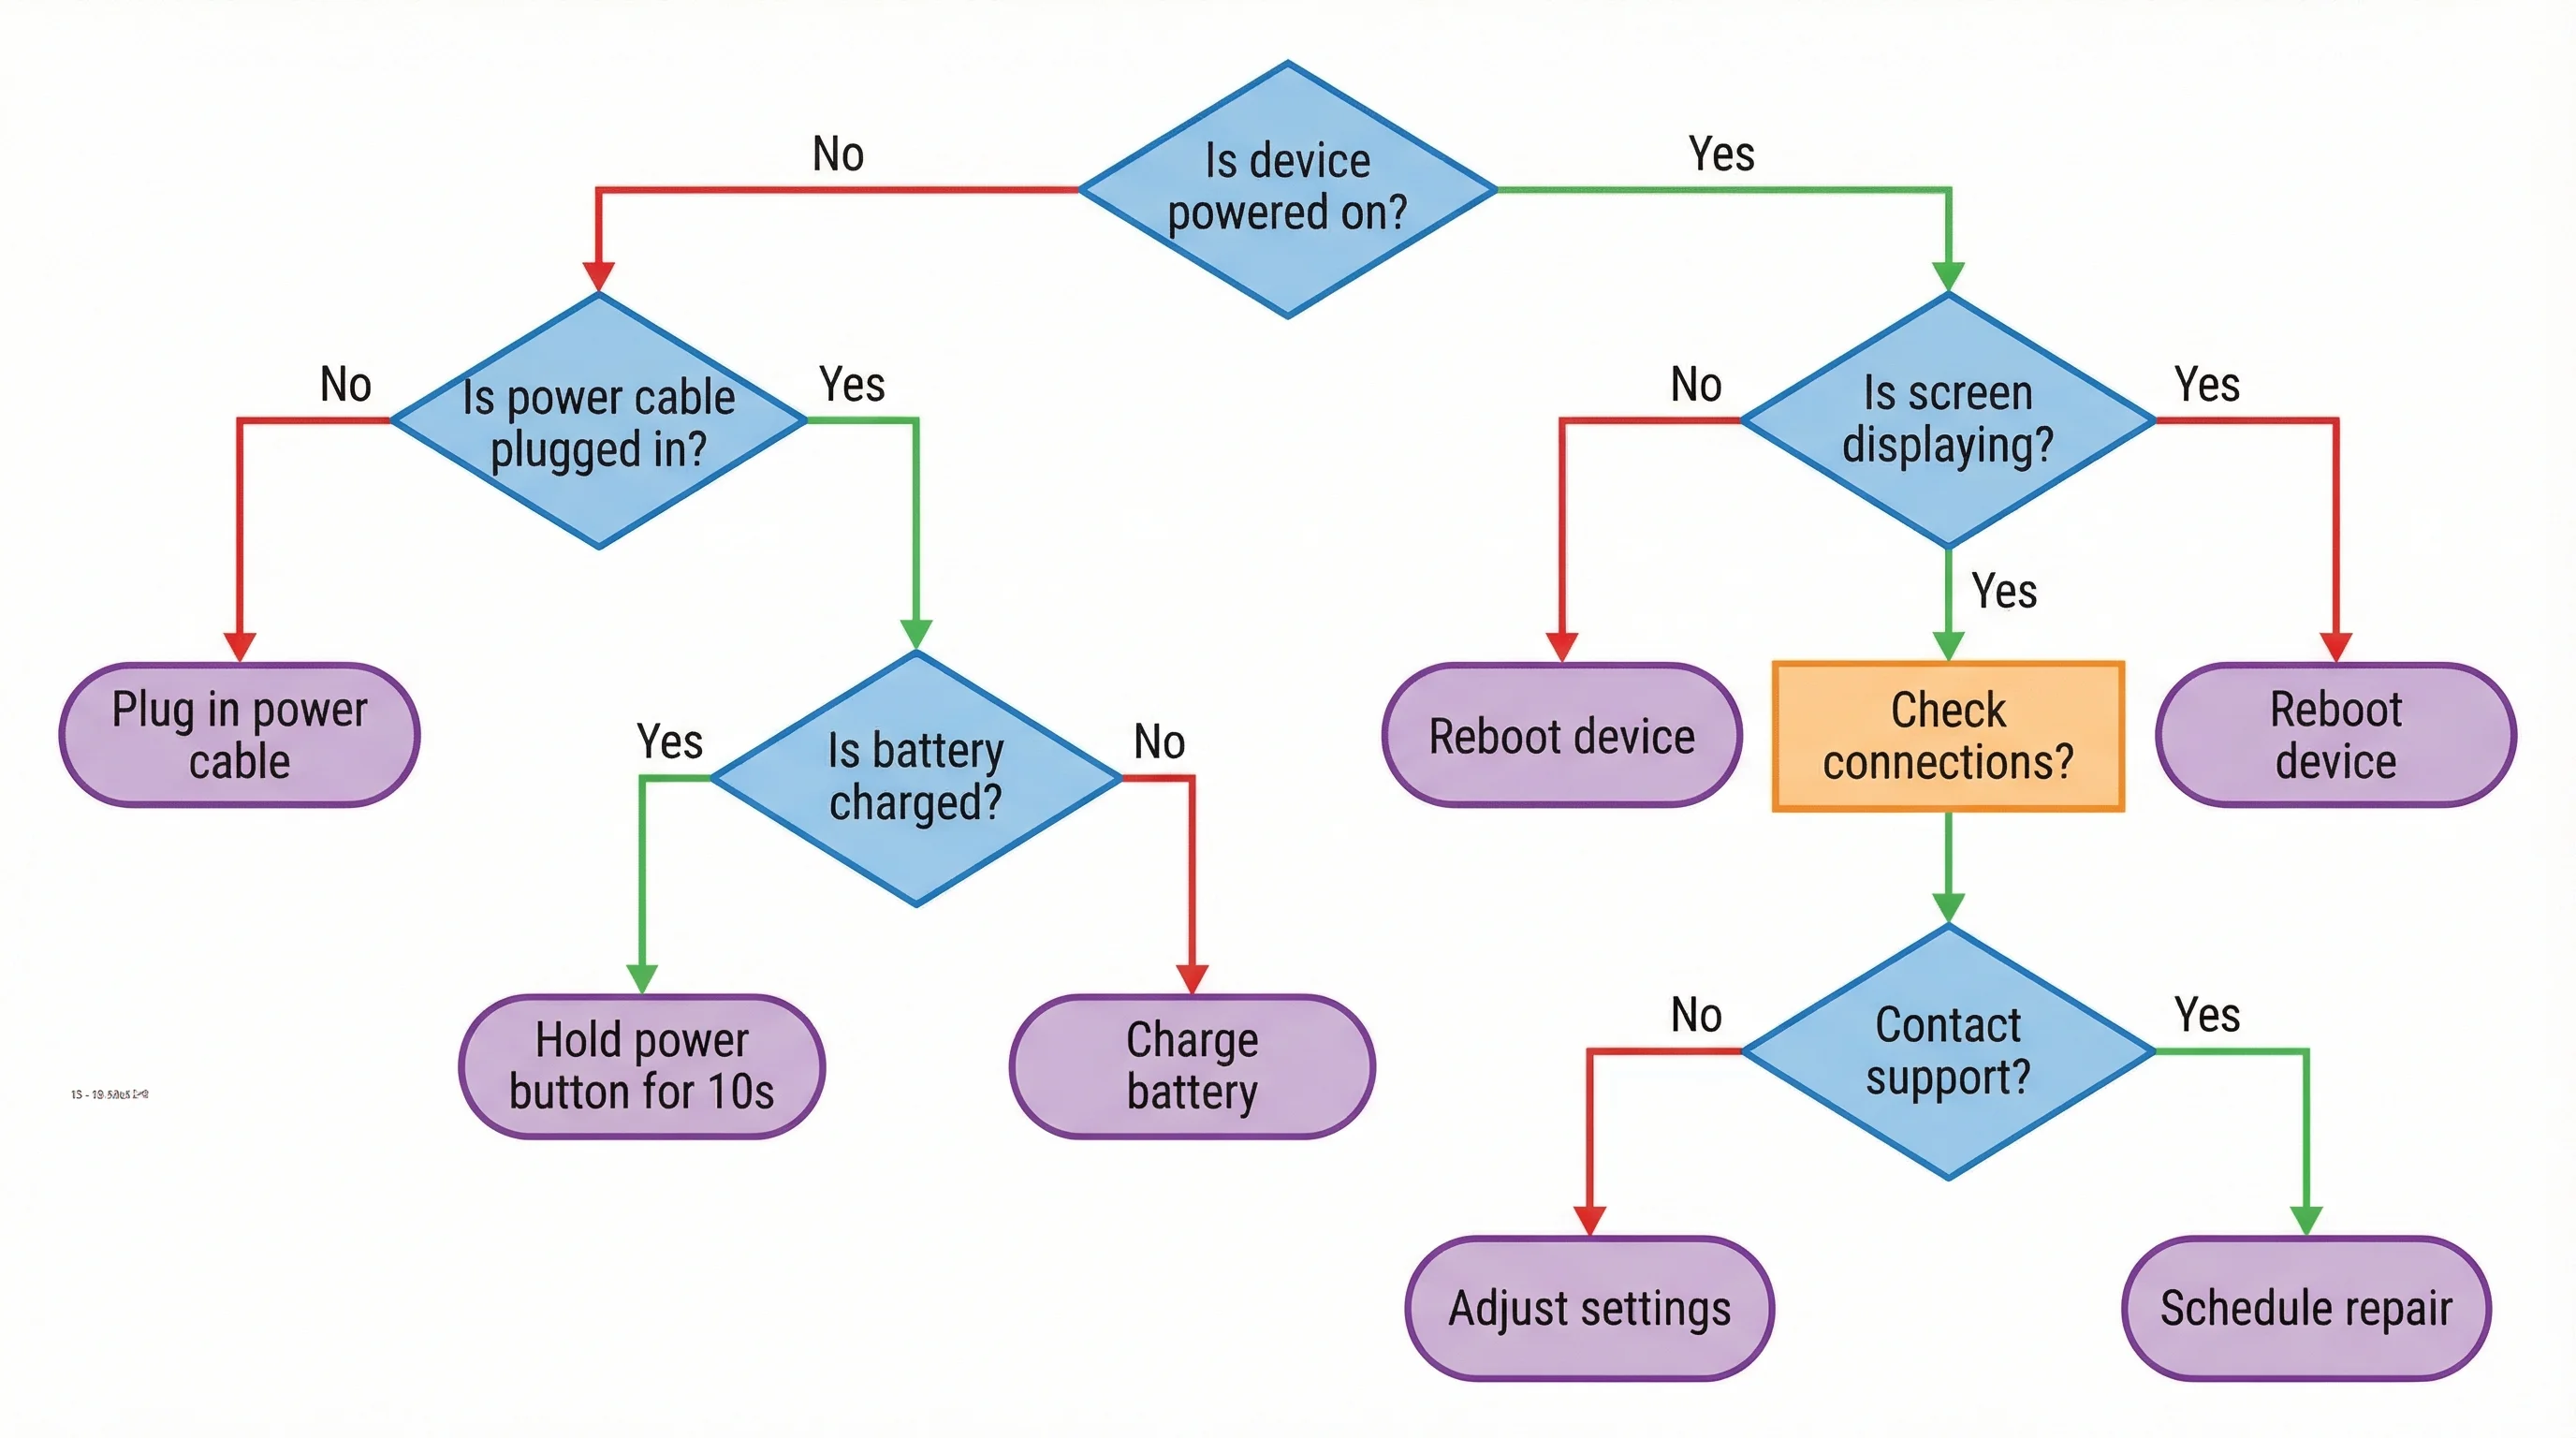
AI Flowchart Generator
Map a process or workflow into a clean flowchart with steps, conditions, and connectors.
 Diagram
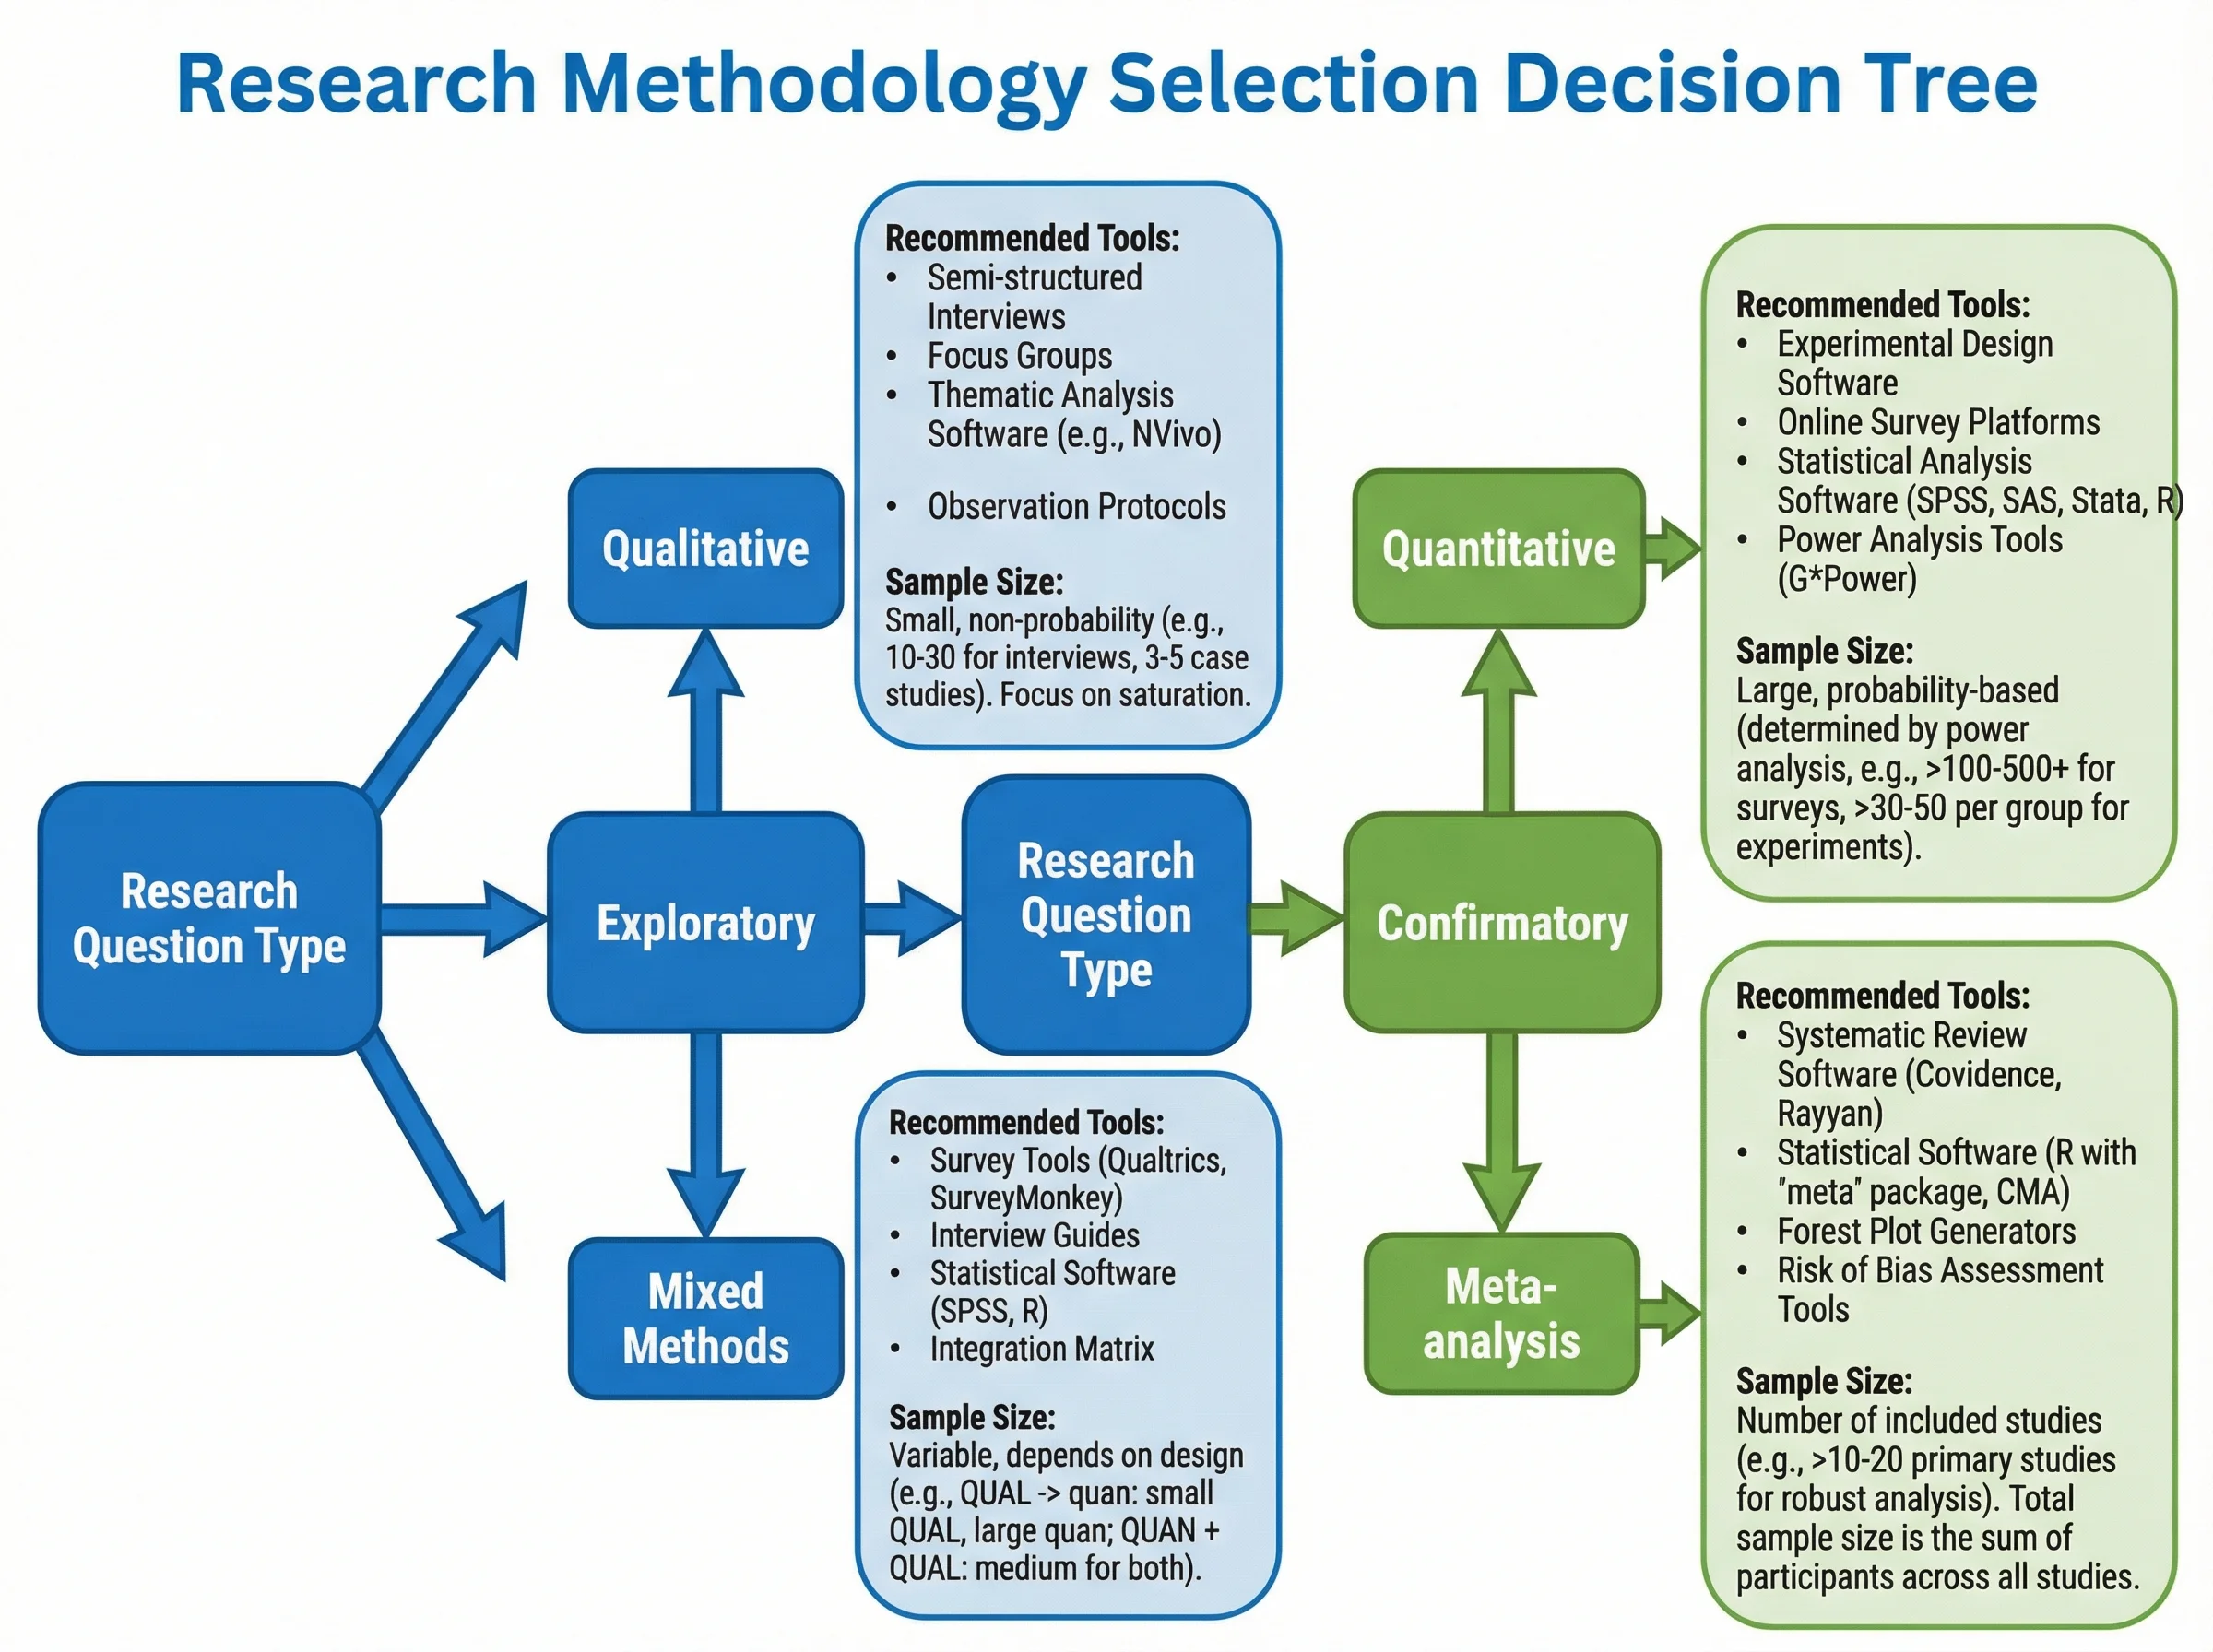
Tree Diagram Maker
Build hierarchical tree diagrams for structures, taxonomies, and probability branches.
 Brainstorming
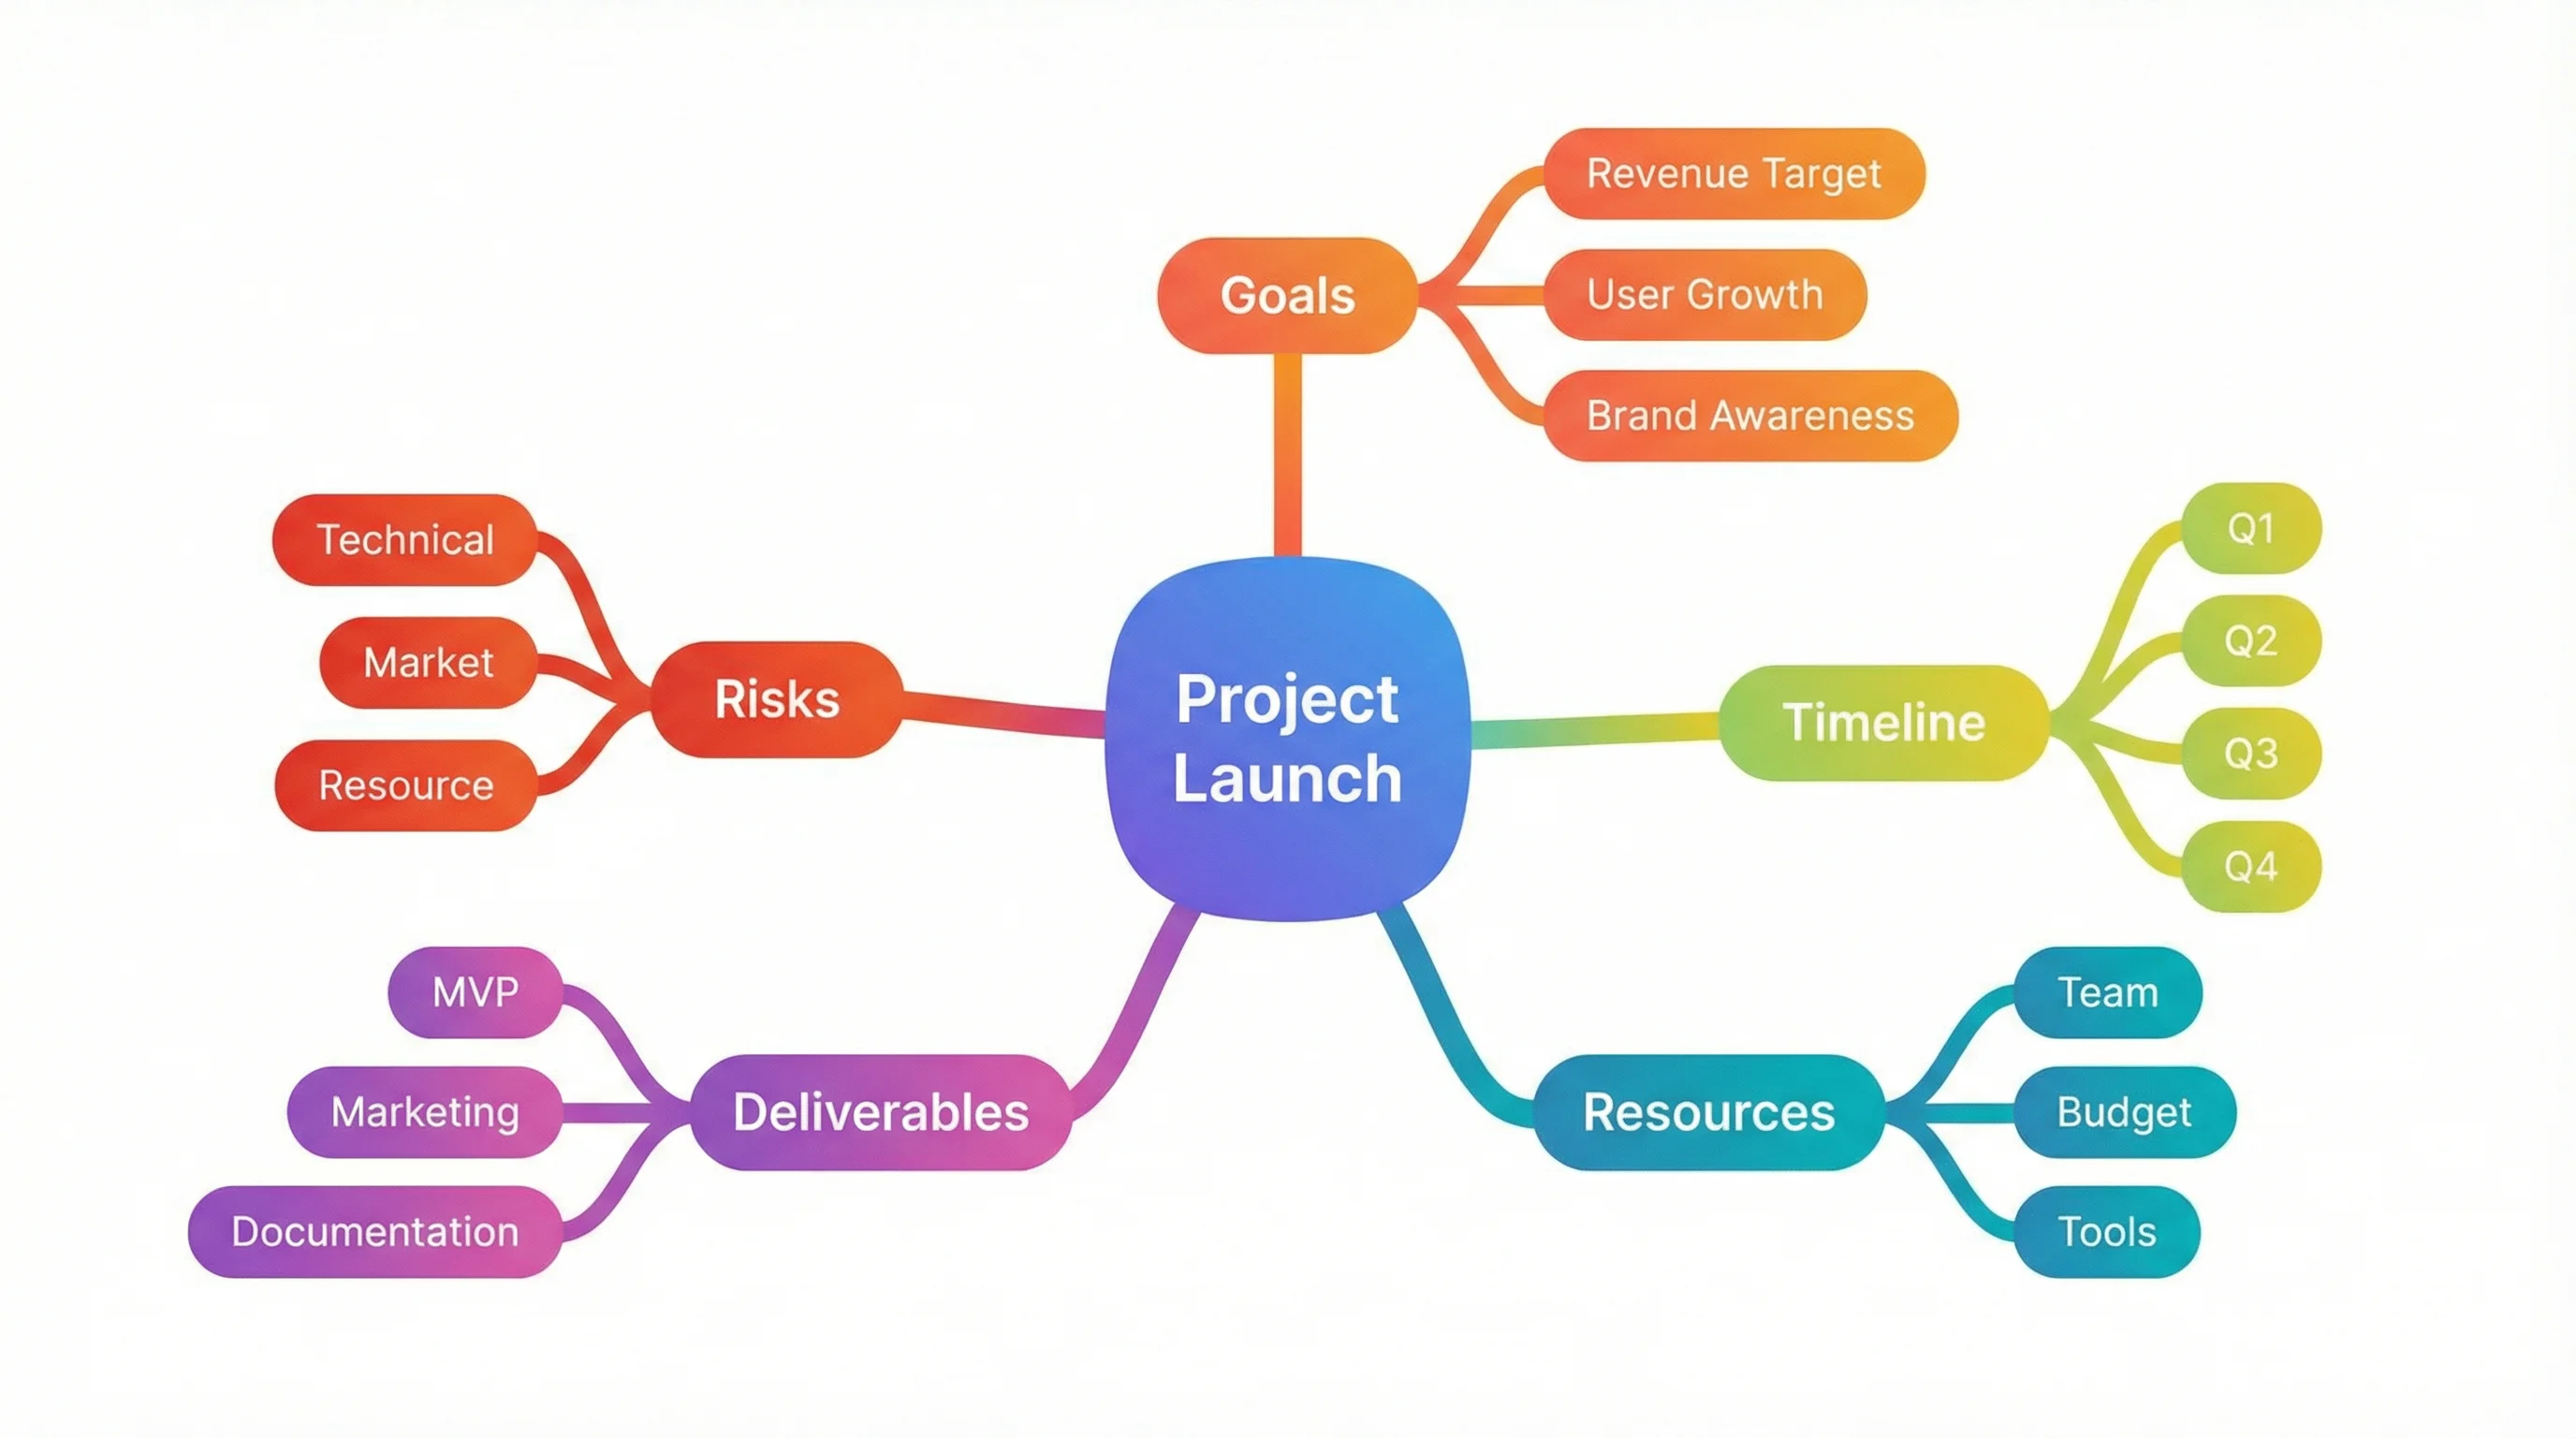
Mind Map Generator
Turn a topic into an organized mind map with branches and sub-branches for planning.
 Business
Pugh Matrix Generator
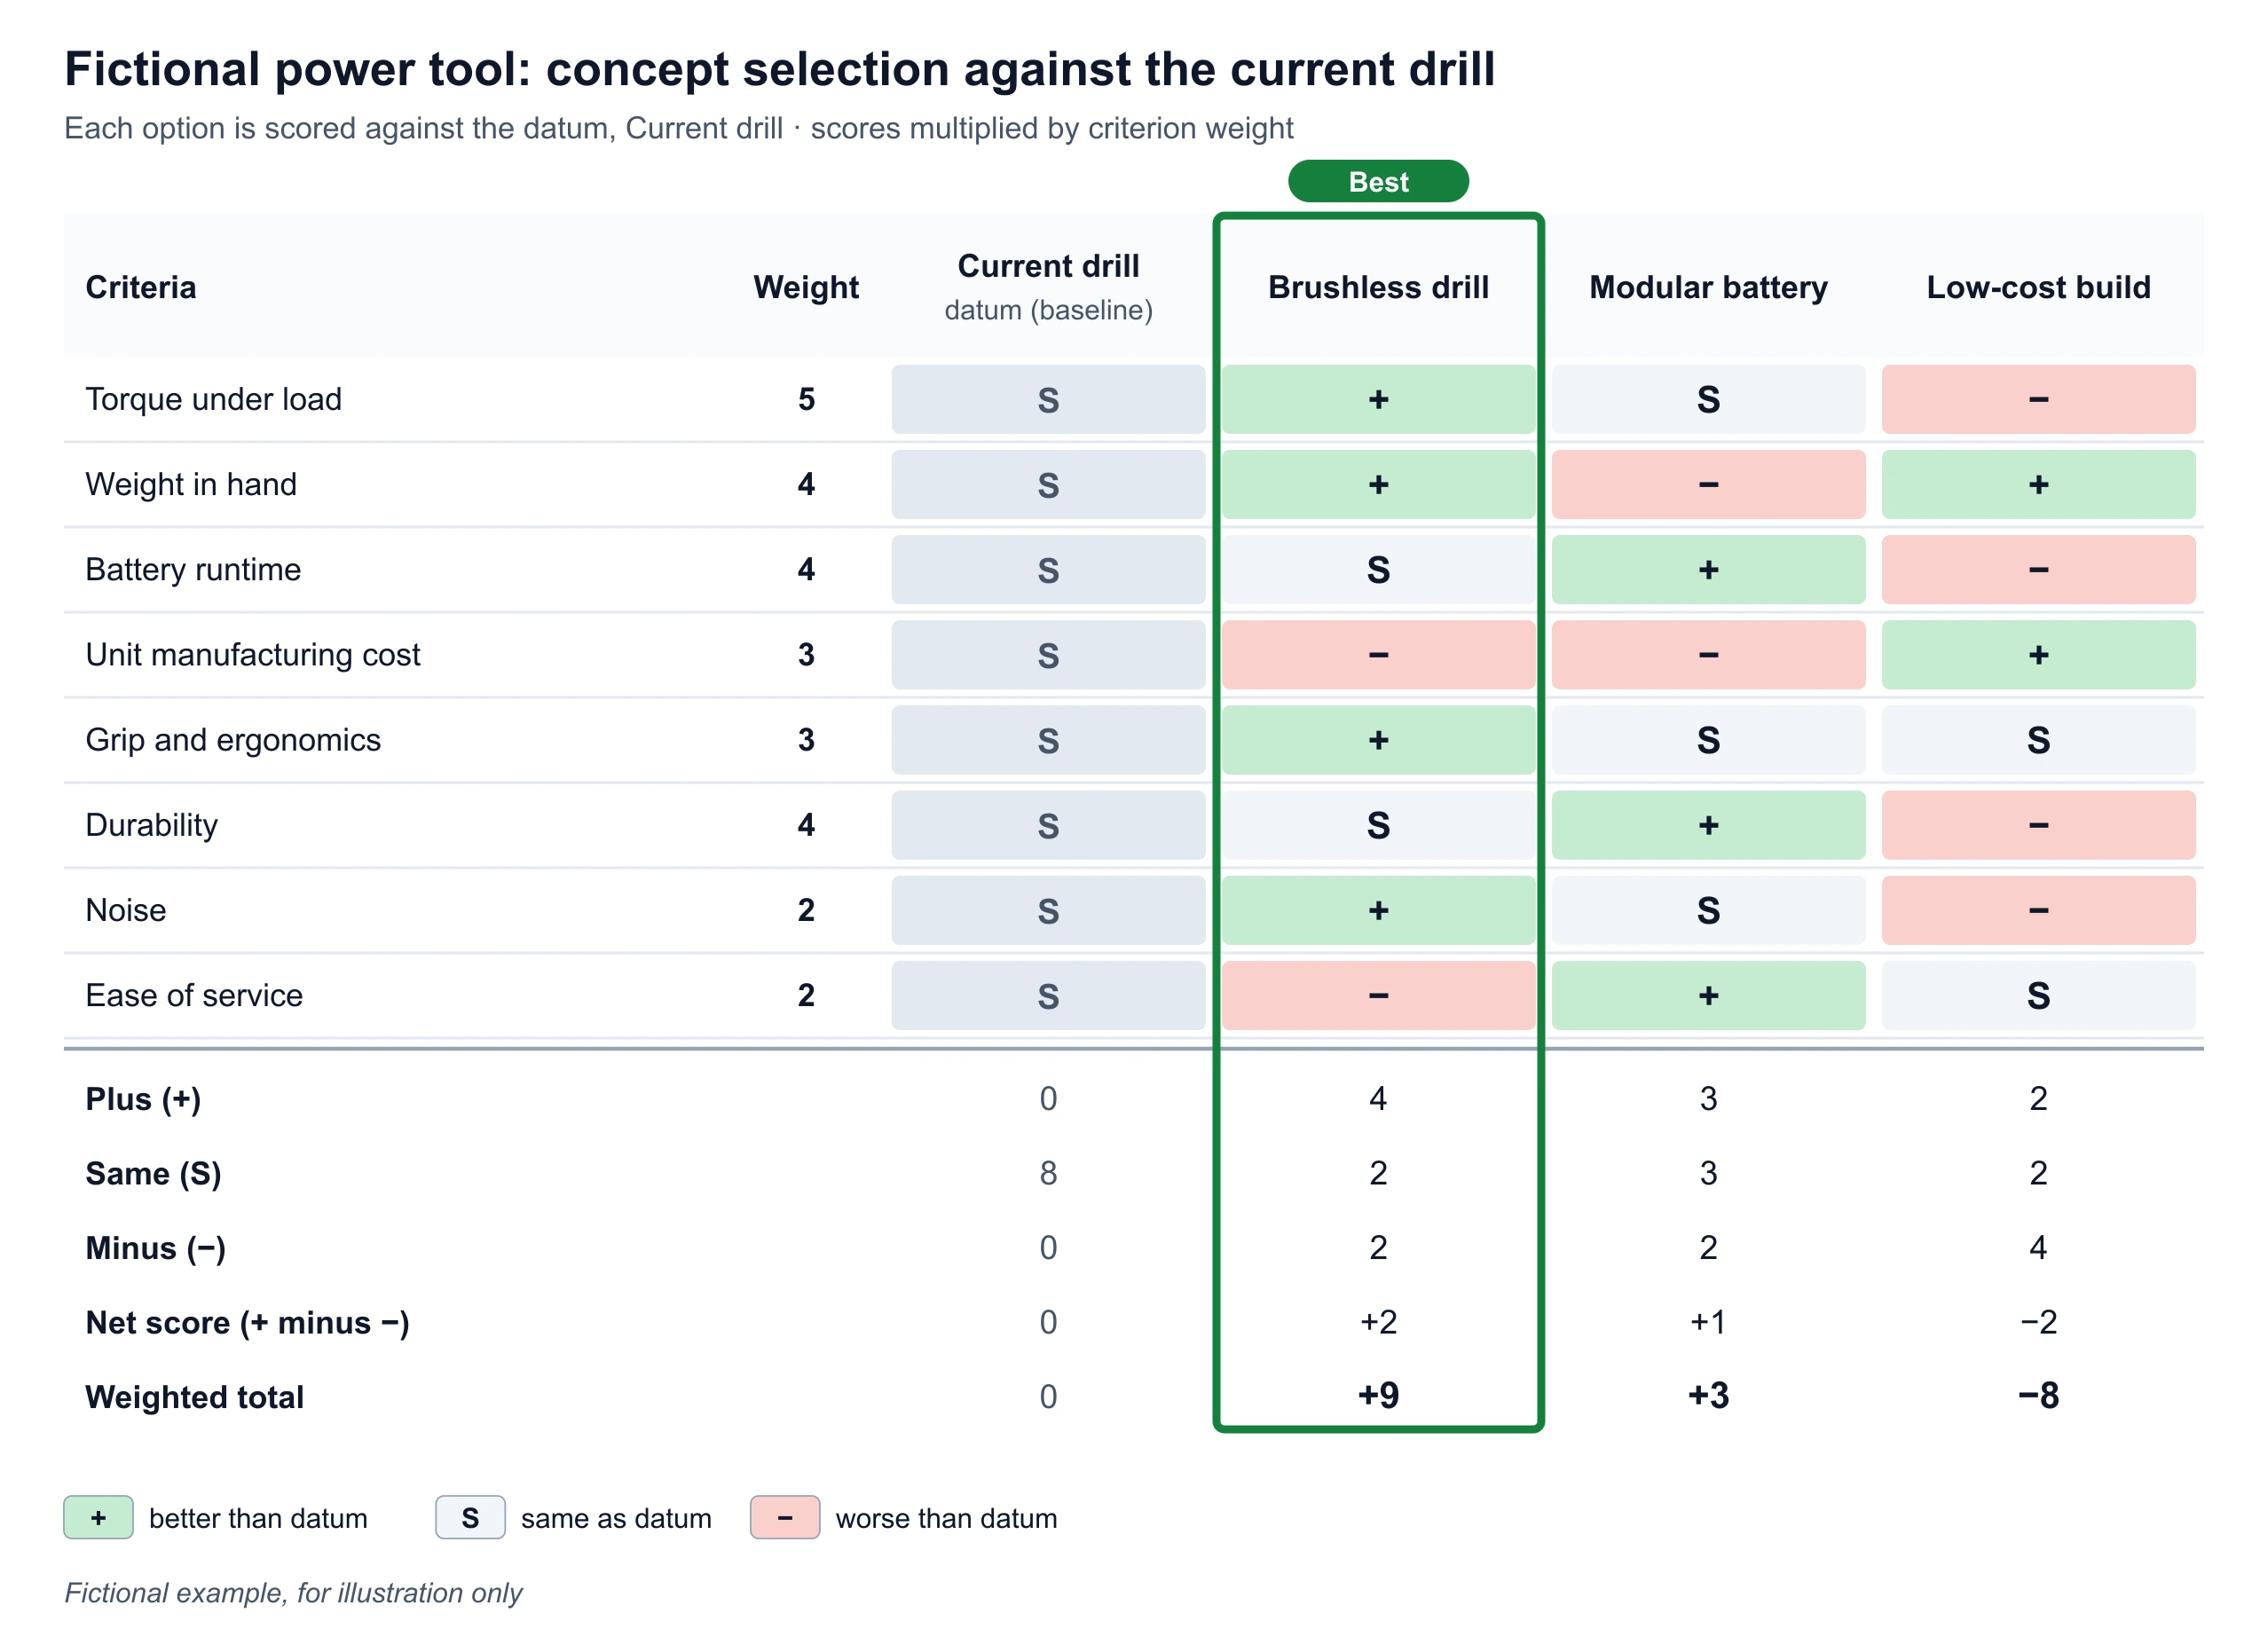
Score options against a datum with +, S and −, weight the criteria, and export a Pugh matrix.
 Business
Tornado Diagram Generator
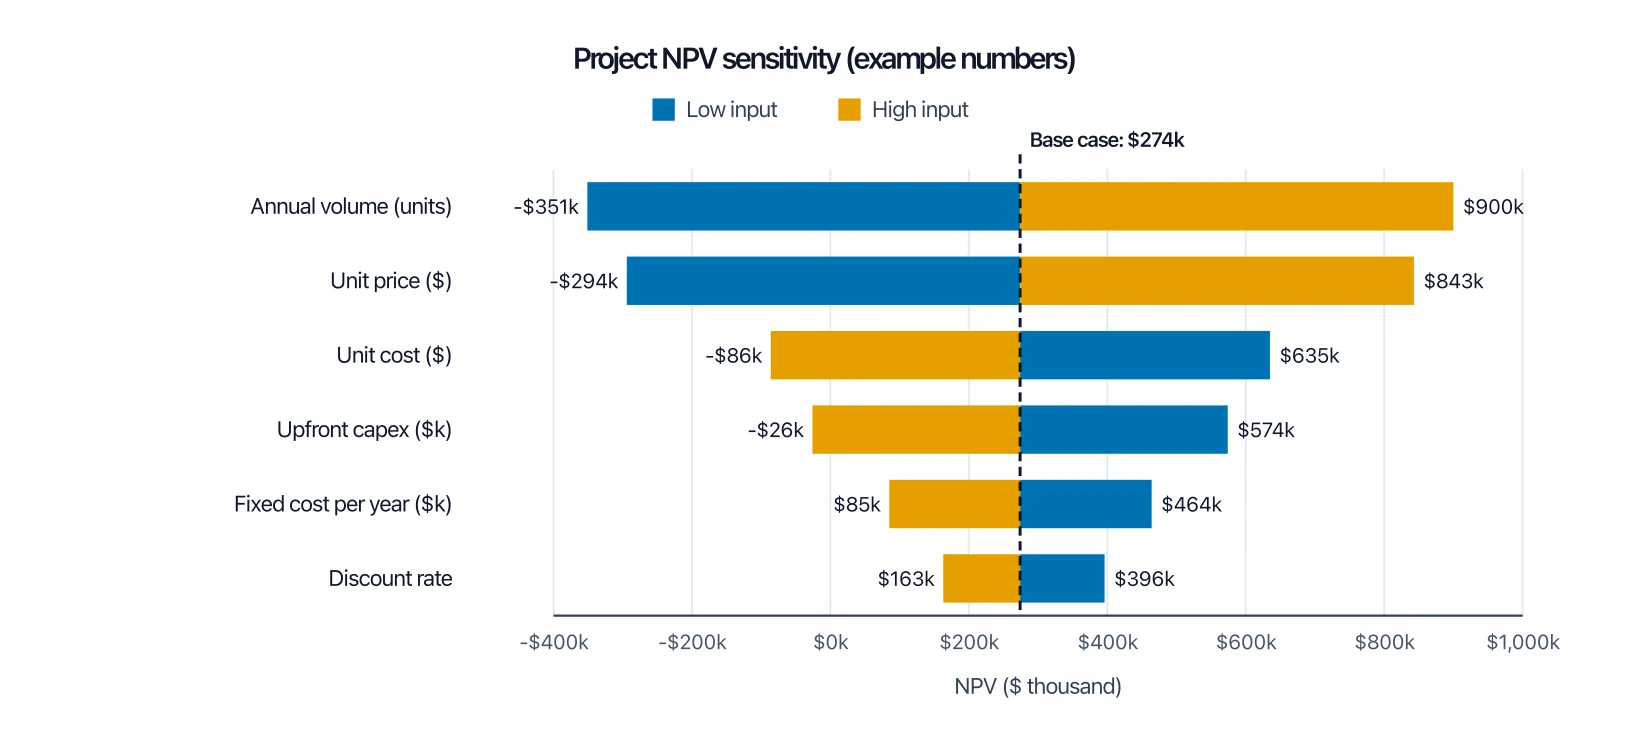
Test which inputs of your decision model change the outcome most with a one-way sensitivity chart.