Figures for your research papers
Start from your own abstract, methods or results. Get a biomedical or scientific figure, review every label, and export it as vector SVG or editable PowerPoint.
Try:
Free to start · 2 image credits, no card required
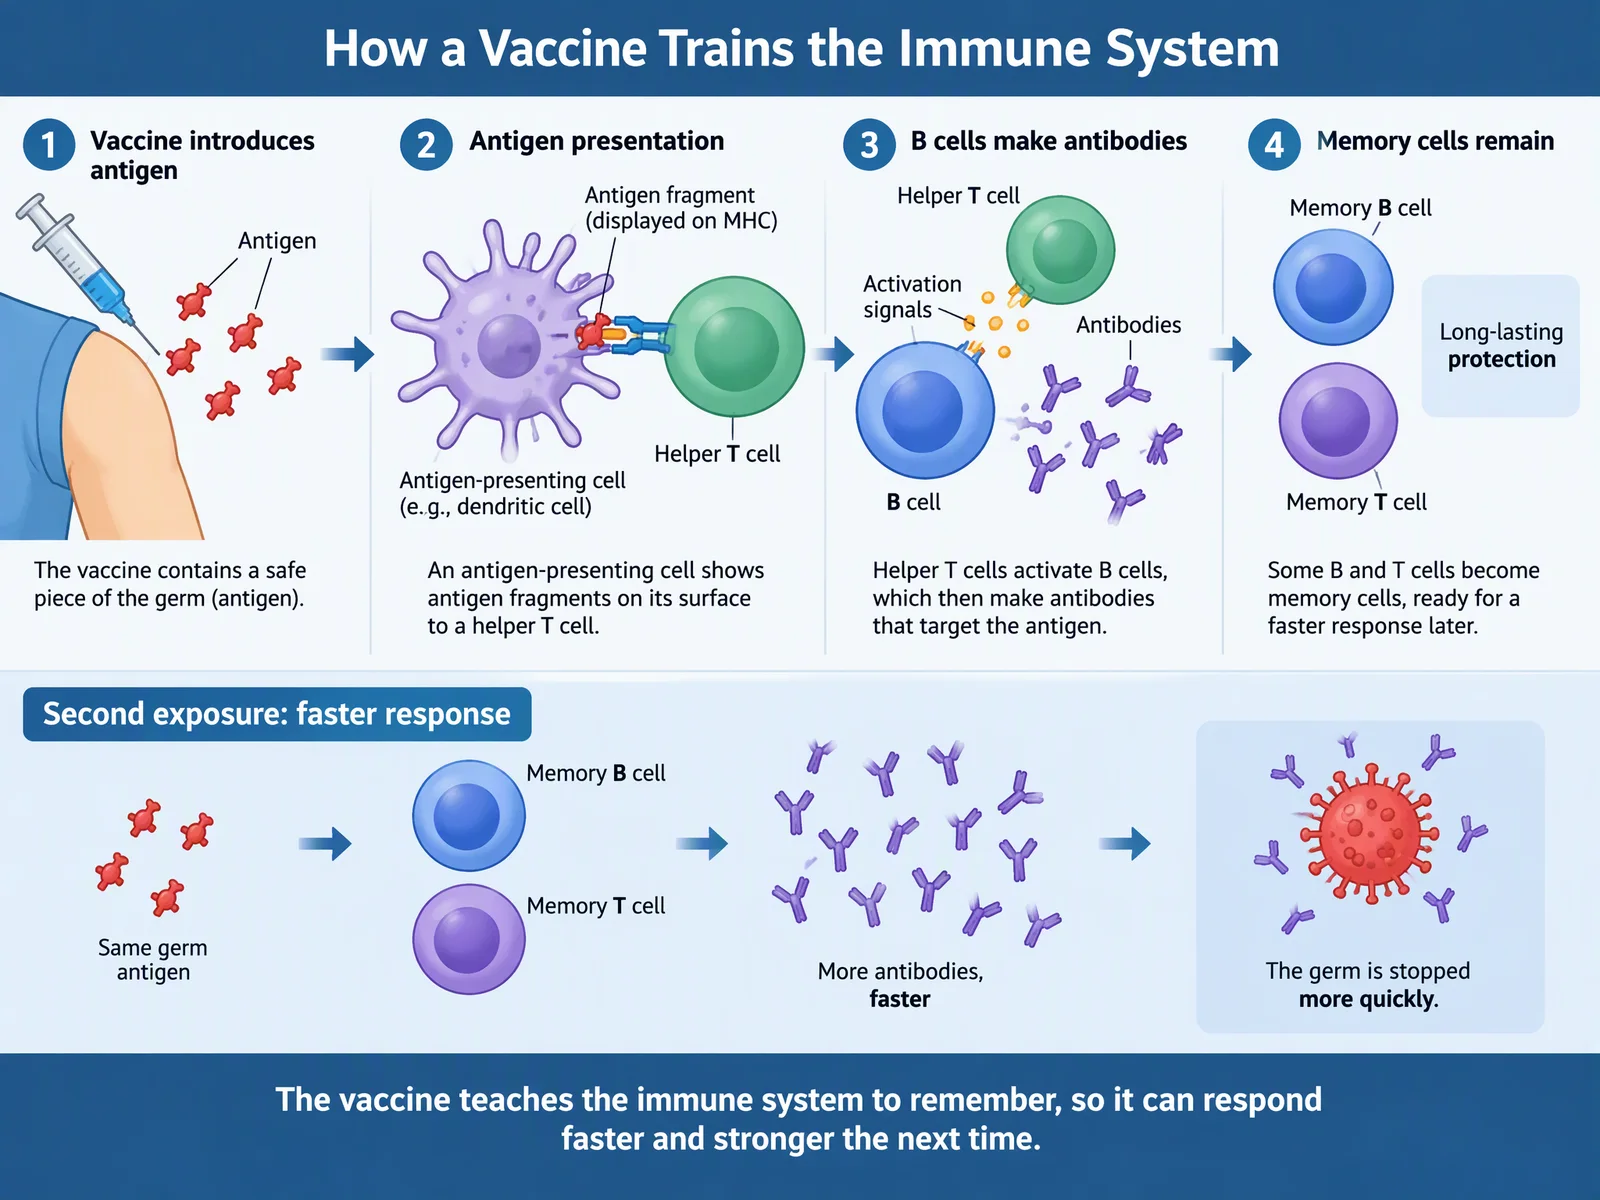
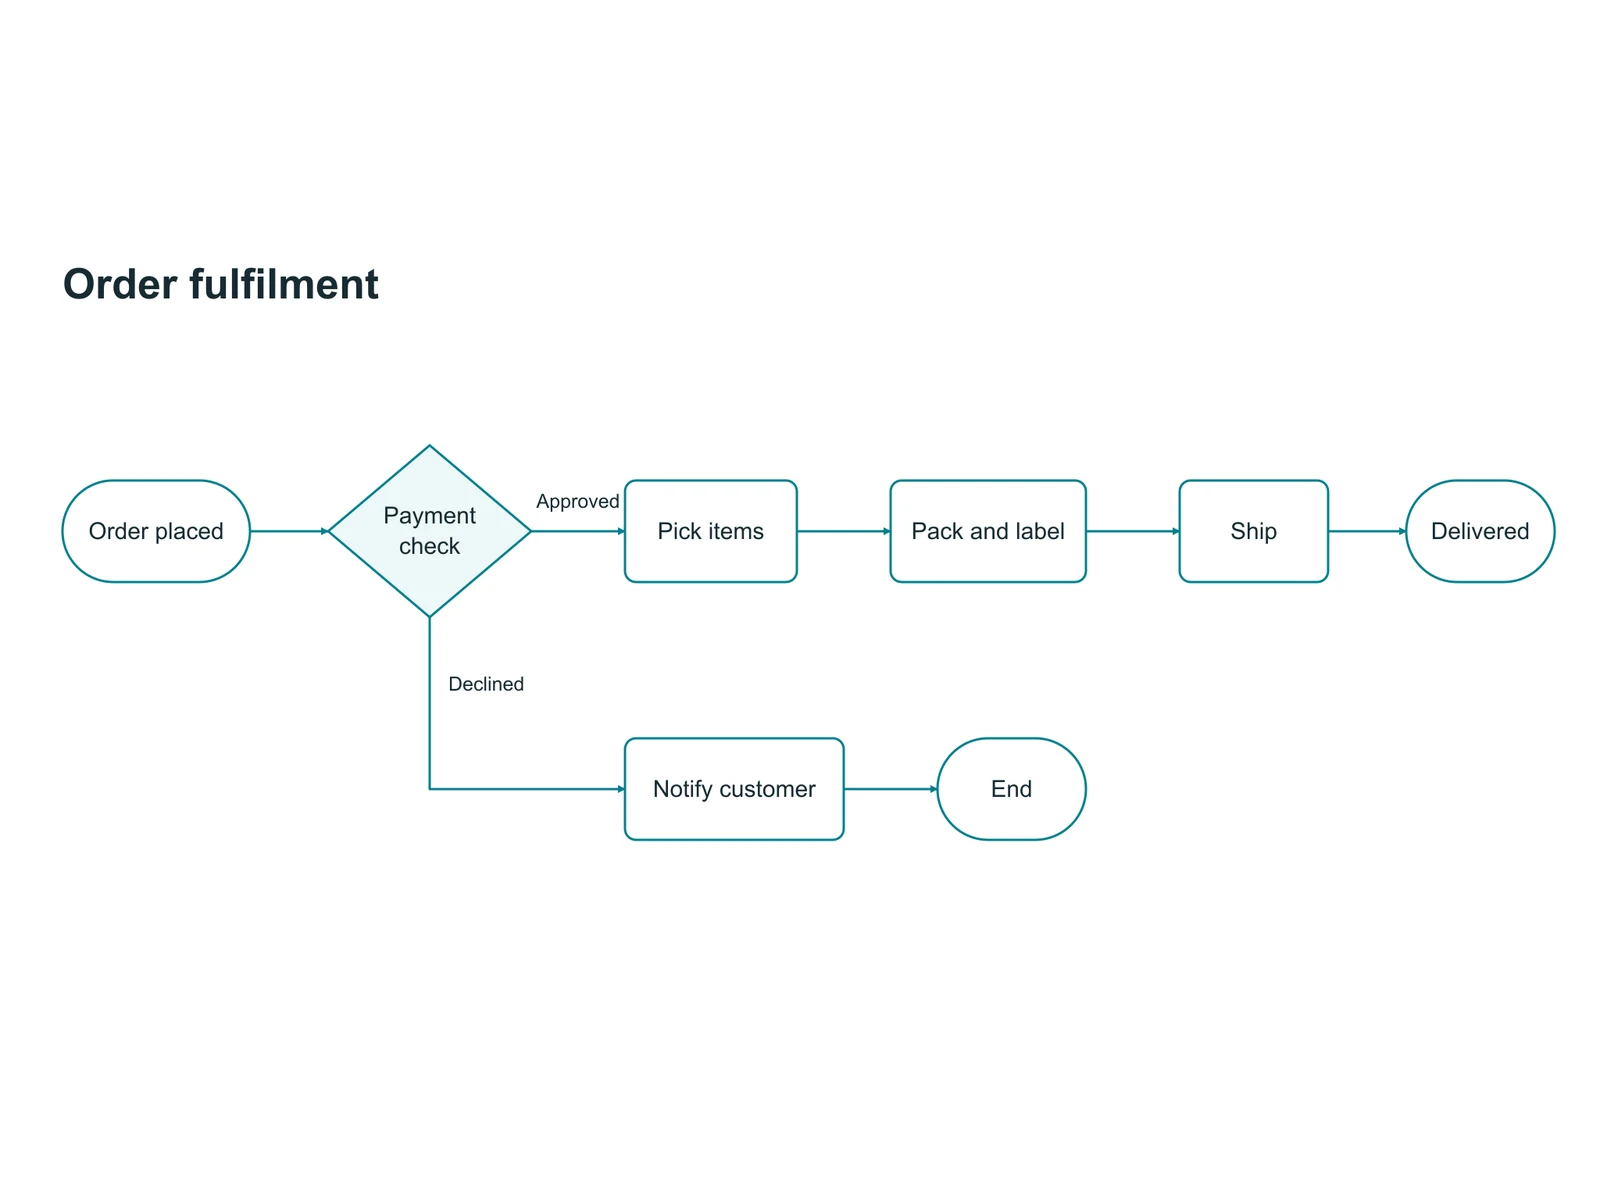
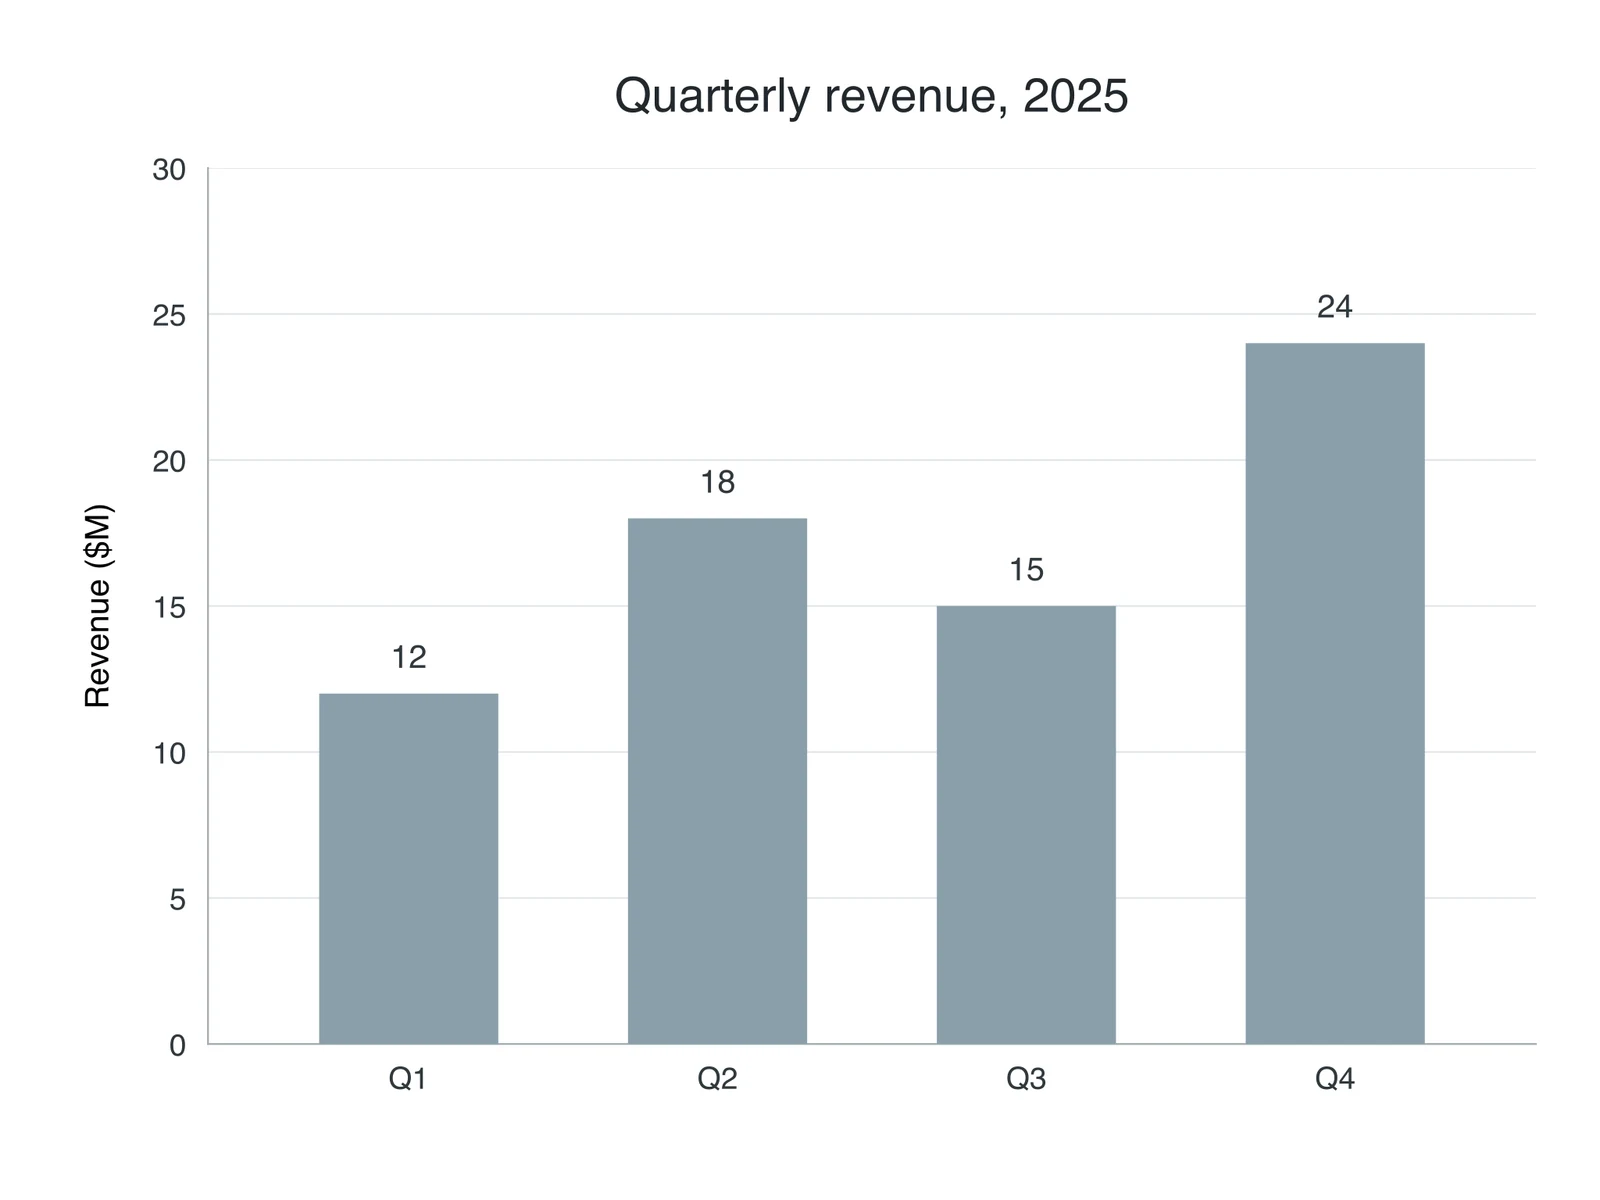
Change one thing. Keep everything else.
Ask for an edit in plain words. Agent shows its plan first, then draws a new version and keeps the old one.
Ask
In the Memory cells remain panel, add a small timeline under the two memory cells: Day 0, Day 7, Day 14. Keep everything else exactly as it is.
Check the plan
Agent writes the prompt and settings first. Nothing is generated, and no credit is spent, until you press Generate.
Get version 2
Added a Day 0, 7 and 14 timeline under the memory cells.
Keep both
Ask for changes in plain words; every version is kept. Download PNG or JPG, or export SVG and PPTX to keep editing.
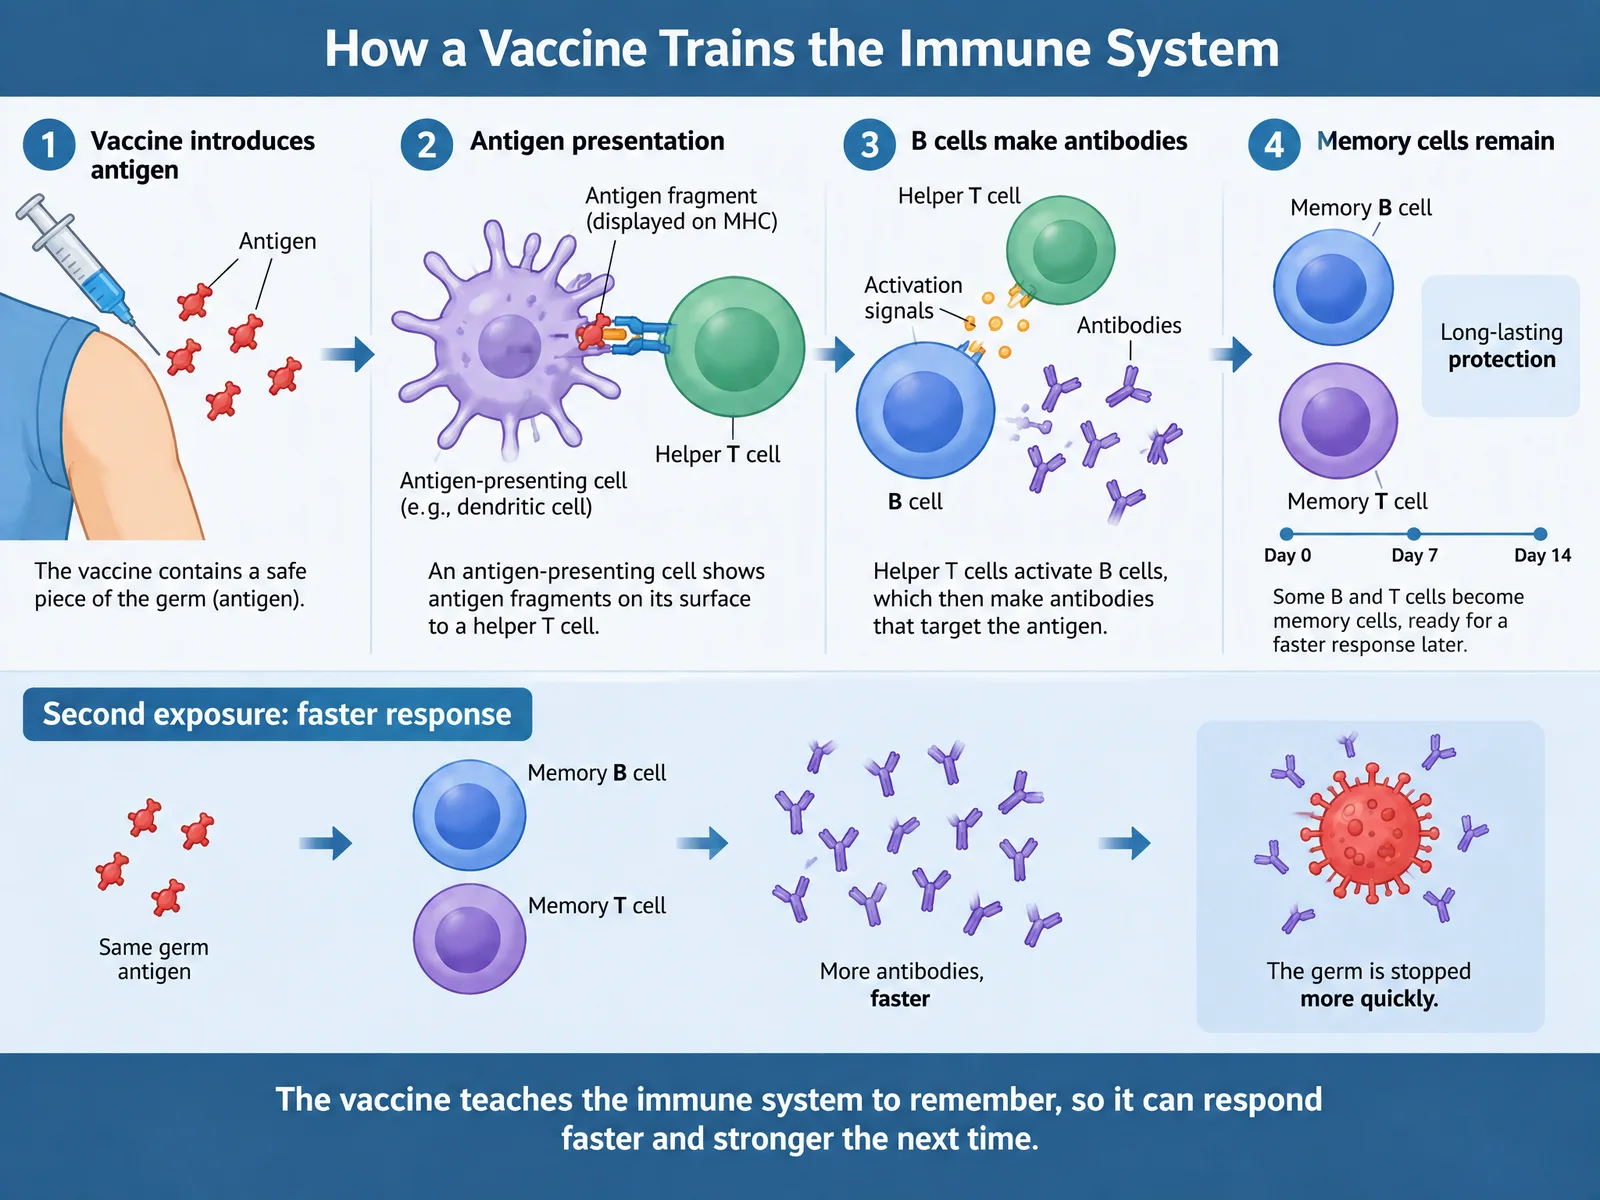
You: In the Memory cells remain panel, add a small timeline under the two memory cells: Day 0, Day 7, Day 14. Keep everything else exactly as it is.
- What changes:
- a Day 0 / 7 / 14 timeline under the memory cells
- What stays:
- everything else
- Cost:
- 1 credit when you press Generate
Added a Day 0, 7 and 14 timeline under the memory cells.
What researchers make here
Biomedical figures
Cells, organs, mechanisms and disease models for papers and talks.
Graphical abstracts
Layout drafts for your visual summary. Check your journal's AI policy before you submit.
Methods and frameworks
Study workflows, PRISMA diagrams, conceptual frameworks and experimental designs.
Posters and charts
Scientific posters and result charts such as forest plots and Kaplan-Meier curves.
Research figures made with ConceptViz
Real outputs from the product. Open one to read the request behind it.
Trusted by 40,000+ researchers, students and teachers.
I use ConceptViz to create and refine scientific visuals for my neuroimaging and brain-stimulation lectures. Being able to iterate directly on the figures makes it much easier to adapt complex material for different teaching contexts and audiences.
I use ConceptViz to develop scientific visuals for my lecture notes, papers, and books in clinical microbiology and immunology. It gives me a practical way to translate complex medical concepts into clearer figures for both teaching and academic communication.
ConceptViz helps me turn complex data-analysis workflows into clear graphical summaries that show the broader picture beyond individual plots or results. The text-editing workflow works especially well—labels are captured cleanly and can be edited directly, which makes a real difference.
I teach clinical immunology to fourth-year students and update my slides every semester as the field evolves. ConceptViz helps me visualize cellular interactions and emerging topics such as CAR T-cell therapy and new biological treatments more precisely than verbal explanations alone.
ConceptViz helps me transform complex ideas in green and sustainable chemistry into visuals that are easier to understand. This is particularly valuable when communicating science to Spanish-speaking students who may find English-language chemistry resources difficult to access.
ConceptViz helps me explain plant disease cycles, host–pathogen interactions, and pathogen transmission through clear visual diagrams. I use these figures in lecture slides, classroom handouts, and assignments to make difficult biological concepts more engaging and easier for students to understand.
What you need when you submit
Editable files
Export vector SVG or an editable PowerPoint file to fix a label or match your journal's fonts.
A license for publications
Files made on a paid account may be used in papers, slides, grant applications and posters.
An AI use statement
Paid accounts can download an AI use and commercial license statement to keep with your submission records.
Your journal decides
Publishers set their own AI rules. Elsevier does not allow general-purpose AI image tools for graphical abstracts, and Springer Nature requires disclosure. Check your target journal before you submit.
Generators for research figures.
Start from a figure type: methods, mechanisms, abstracts and charts.
Try it free, then pick a plan.
Plans include image credits every month. One credit makes one standard figure, and every plan includes Agent for editing in conversation.
Researcher
60 figures / moFor one researcher writing papers.
$16.66 / month
Billed $199.90 yearly, or $19.90 monthly
30 Agent conversations a month. SVG and PPTX export at member price.
Lab · Best value
200 figures / moFor a lab, or a full set of figures for one paper.
$41.66 / month
Billed $499.90 yearly, or $49.90 monthly
Unlimited Agent (fair use). SVG and PPTX export at member price.
Pro
200 figures / moFor groups that need API access and white-label use.
$74.99 / month
Billed $899.90 yearly, or $99.90 monthly
Unlimited Agent (fair use), member-price exports, API access, 5 seats on request.
Or a one-time pack that never expires: Starter $9.90 (15 figures), Paper $19.90 (45), Project $49.90 (150).
Start free. 2 image credits and a short Agent trial, valid for 7 days. No card required.
Start creatingQuestions, answered.
Something else on your mind? Write to [email protected].
What is ConceptViz?
ConceptViz turns complex ideas into clear visuals. Describe what you need, and Agent creates scientific illustrations, flowcharts, and data charts, then refines them with you through conversation. It is used by teachers, students, and researchers across biology, chemistry, physics, medicine, engineering, and more.
How is it different from ChatGPT or other AI image tools?
General image tools return a picture and start over when you ask for a change. Agent shows its plan before anything is generated, picks the right way to draw each figure (an illustration, an editable SVG diagram, or an exact chart drawn from your numbers), changes only what you ask for, and keeps every version. You can also export vector SVG and editable PowerPoint files.
Are the figures scientifically accurate?
Agent is built for scientific and technical figures, and charts are drawn from the numbers you give. Illustrations are still AI-generated, so review each one before you use it in class or in a paper. If something is off, describe the fix and Agent makes a new version.
Can I edit a figure after it is made?
Yes. Ask for changes in plain words, such as "add a timeline under the memory cells", and Agent makes a new version while keeping the old one. You can also export vector SVG and editable PowerPoint when you need to change text: 2 and 4 credits on a plan, or 4 and 8 without one.
Can Agent work from my notes or papers?
On Lab and Pro, you can upload documents for Agent to read. It then plans a set of up to 6 related figures from your brief or your documents, and you review the plan before anything is generated.
How does pricing work?
Start free with 2 image credits and a short Agent trial, valid for 7 days, no card required. Researcher ($16.66 a month billed yearly, or $19.90 monthly, 60 figures) and Lab ($41.66 a month billed yearly, or $49.90 monthly, 200 figures, unlimited Agent under fair use) are the main plans; Pro adds API access, with seats and white-label use on request. One-time packs from $9.90 never expire. See the pricing page for details.
Can I use the figures in papers, slides, and commercial work?
Yes. Paid plans include commercial use, so you can use your figures in papers, theses, slides, worksheets, courses, and published materials.
What happens to my prompts and figures?
We store your prompts and figures so you can come back to them and keep every version. You can delete figures you no longer want.
Your next figure starts with your abstract.
Paste it, check the plan, and refine the figure until it is right.
Try:
Free to start · 2 image credits, no card required