Paper to Poster AI: We Tested 3 Tools on One Paper
One open-access paper, three paper-to-poster tools: SciSpace, SciDraw and ConceptViz. Speed, real figures, checked numbers and limits. Tested 17 Nov 2026.
Disclosure: ConceptViz is our product, and we wrote this test. SciSpace and SciDraw were run on their free plans; ConceptViz was run on our own machine with the same code as the public tool, so its timing is not independent (details in the method section). We paid for nothing, and we say where the other two beat us. It is one run on one paper, so treat it as one observation, not a ranking.
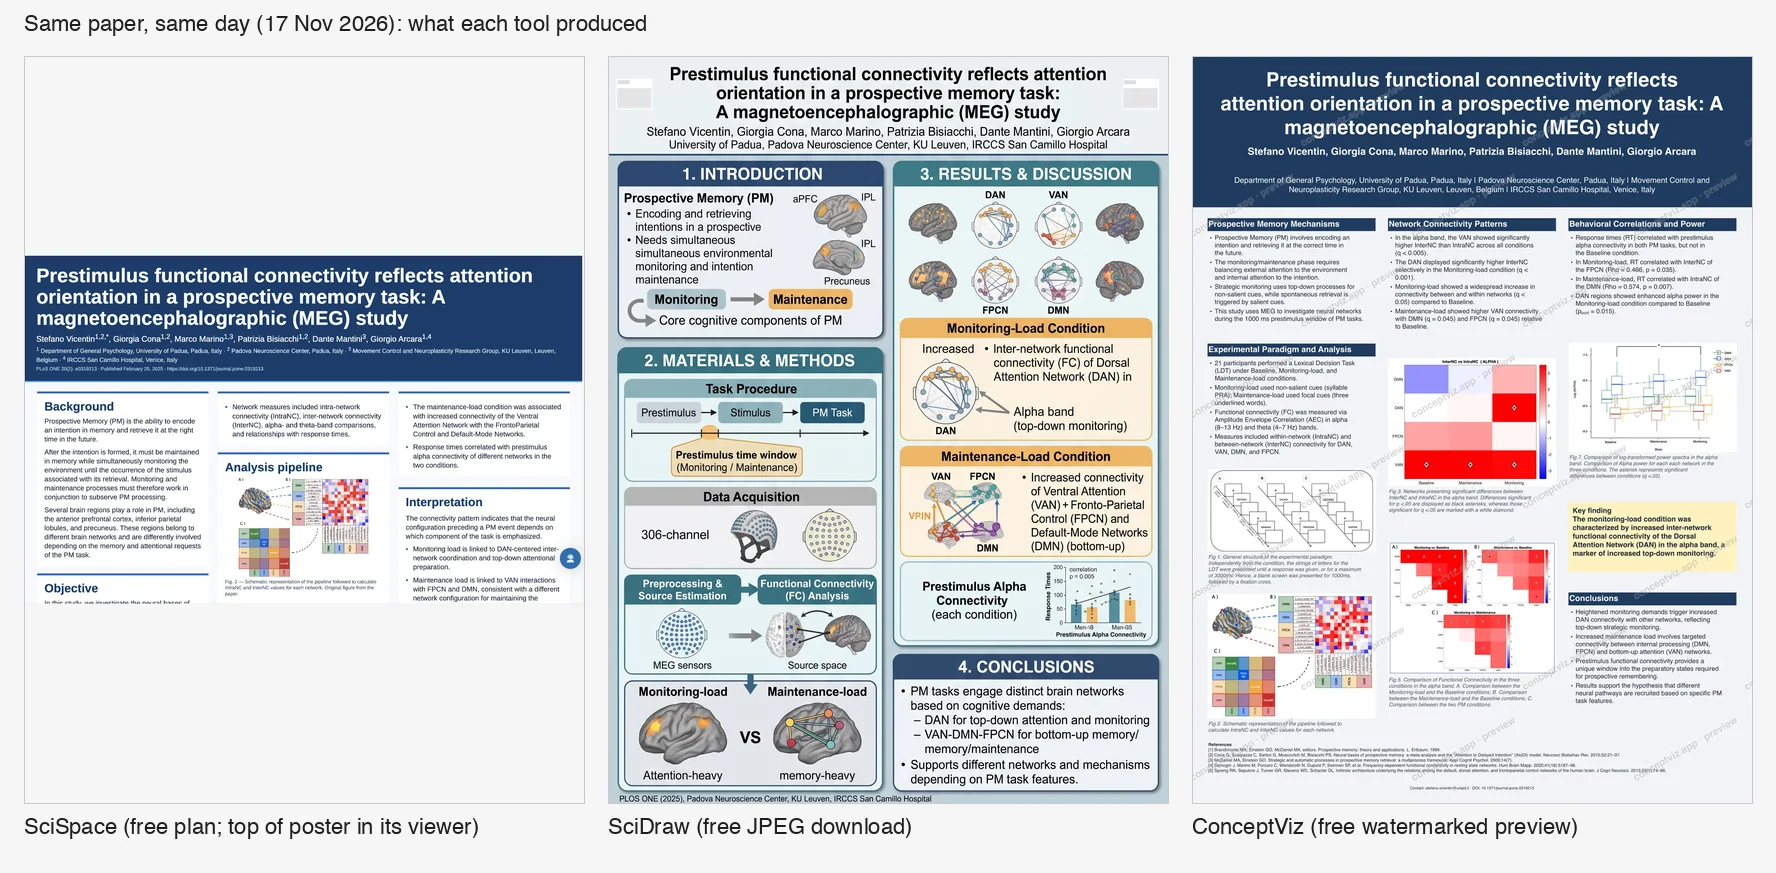
We ran the same paper through three tools that turn a paper PDF into a conference poster, on 17 November 2026. Here is what each one produced:
What we tested
- Paper: "Prestimulus functional connectivity reflects attention orientation in a prospective memory task: A magnetoencephalographic (MEG) study", PLOS ONE 20(2): e0319213, published under CC BY. 23 pages, 7 figures. It was not used while building ours.
- Input: the PDF, with no extra prompts about which figures to include. Where a tool could not read the PDF, we pasted only text taken from the paper (title, authors, abstract, section list).
- Plans: free tiers for SciSpace and SciDraw (accounts we had registered the day before; the SciSpace one had already spent 5 of its 100 credits). ConceptViz was run from our own machine, see the method section. Prices and limits are what each pricing page showed on the test date.
Results at a glance
| SciSpace | SciDraw (sci-draw.com) | ConceptViz | |
|---|---|---|---|
| Read the PDF? | Yes | Upload failed once ("Something went wrong"; we did not retry); we pasted the abstract instead | Yes |
| Time to a poster* | About 5.5 minutes | About 25 seconds (text only; read from screenshots, +/- 5 s) | About 36 seconds (one run, includes reading the PDF) |
| Free cost | 4 of 100 monthly credits | 5 credits (the daily free amount) | The live tool gives a free watermarked preview; this run did not go through the live tool |
| Real figures from the paper | Yes, 3 of 7 | No, all redrawn by the image model | Yes, 5 figures cropped from the PDF (6 found, 1 table left out) |
| Facts match the paper | Titles, authors and abstract claims match; few numbers | Two wrong numbers and garbled labels | The numbers we checked match the paper (see below) |
| Free download | No, upgrade prompt on download (view in browser only) | Yes, 1792×2400 JPEG, no visible text watermark | Preview only; download costs 4 credits, PPTX and PDF |
| Editable file | PPTX offered, locked on free | Flat JPEG; paid conversion to SVG or PPTX | PPTX with real text boxes, plus PDF |
*Timings are not like for like: SciSpace and SciDraw were timed on their live sites, ConceptViz on our own machine.
Numbers we checked against the paper
| Number in the paper | SciSpace | SciDraw | ConceptViz |
|---|---|---|---|
| Rho = 0.466, p = 0.035 (p. 12) | Not on the poster | Not shown; a chart is labelled p = 0.005 | Matches |
| Rho = 0.574, p = 0.007 (p. 13) | Not on the poster | Not shown | Matches |
| 275-channel MEG system (p. 5) | Not on the poster | Says 306-channel | Not on the poster |
| 21 participants (Methods) | Not on the poster | Not on the poster | Matches |
Names, affiliations and abstract wording were right on SciSpace; SciDraw garbled several labels. We checked these numbers only; check the rest against your paper.
SciSpace
SciSpace read the PDF and produced a 36×48 in, three-column poster with a PPTX and a PDF behind it. It took about five and a half minutes on the free plan's default model and used 4 of the 100 monthly credits. The title, six authors, affiliations and DOI all match the paper, and it reused three original figures (Fig 1, 2 and 5) rather than redrawing them.
What it lacked: the concrete numbers (21 participants, 120 trials per block, the p-values), and its Methods and Results columns continued into the next column without a heading. On the free plan we could only view the result in the browser; the download button opened an upgrade prompt.
Where SciSpace is better than us: it is a general research assistant, so it can keep chatting and revising the poster, and its layout is looser and more designed. If you are willing to pay, a poster you can edit by prompting is a real advantage.
SciDraw
SciDraw's PDF upload failed on our paper ("Something went wrong. Please try again."), so we pasted the title, authors, abstract and section list (2,837 characters of the paper's own text). About 25 seconds later (we polled every 5 seconds, so 21–26) it returned a 3:4 poster that costs the 5 daily free credits, and the free JPEG download has no visible text watermark.
It is the fastest of the three. But the poster is an image drawn by a model, not a layout of your paper:
- A data panel says "306-channel"; the paper uses a 275-channel MEG system (p. 5).
- A correlation chart is labelled p = 0.005. The paper reports Rho = 0.466, p = 0.035 and Rho = 0.574, p = 0.007 (pp. 12–13).
- Several labels are garbled ("Men-8", "VRIN"), and some sentences repeat or stop mid-phrase.
- No figure from the paper appears; the brain and network diagrams are new drawings.
The tool itself tells you to check labels and scientific details before using the figure in a paper, and for a poster that carries your results, you have to.
Where SciDraw is better than us: speed, a free daily allowance, a download that is free on day one, and 4K and vector conversion if you pay. It suits a visual summary more than a poster of your own data.
ConceptViz
We ran the PDF through our paper-to-poster tool. It read the paper, found the figures and tables, laid out five sections and five figures on a 36×48 in poster in about 36 seconds, and the numbers we checked against the text (for example Rho = 0.466, p = 0.035 and Rho = 0.574, p = 0.007) match. The figures are cropped from your PDF, so they are the real plots, and the PPTX has editable text boxes.
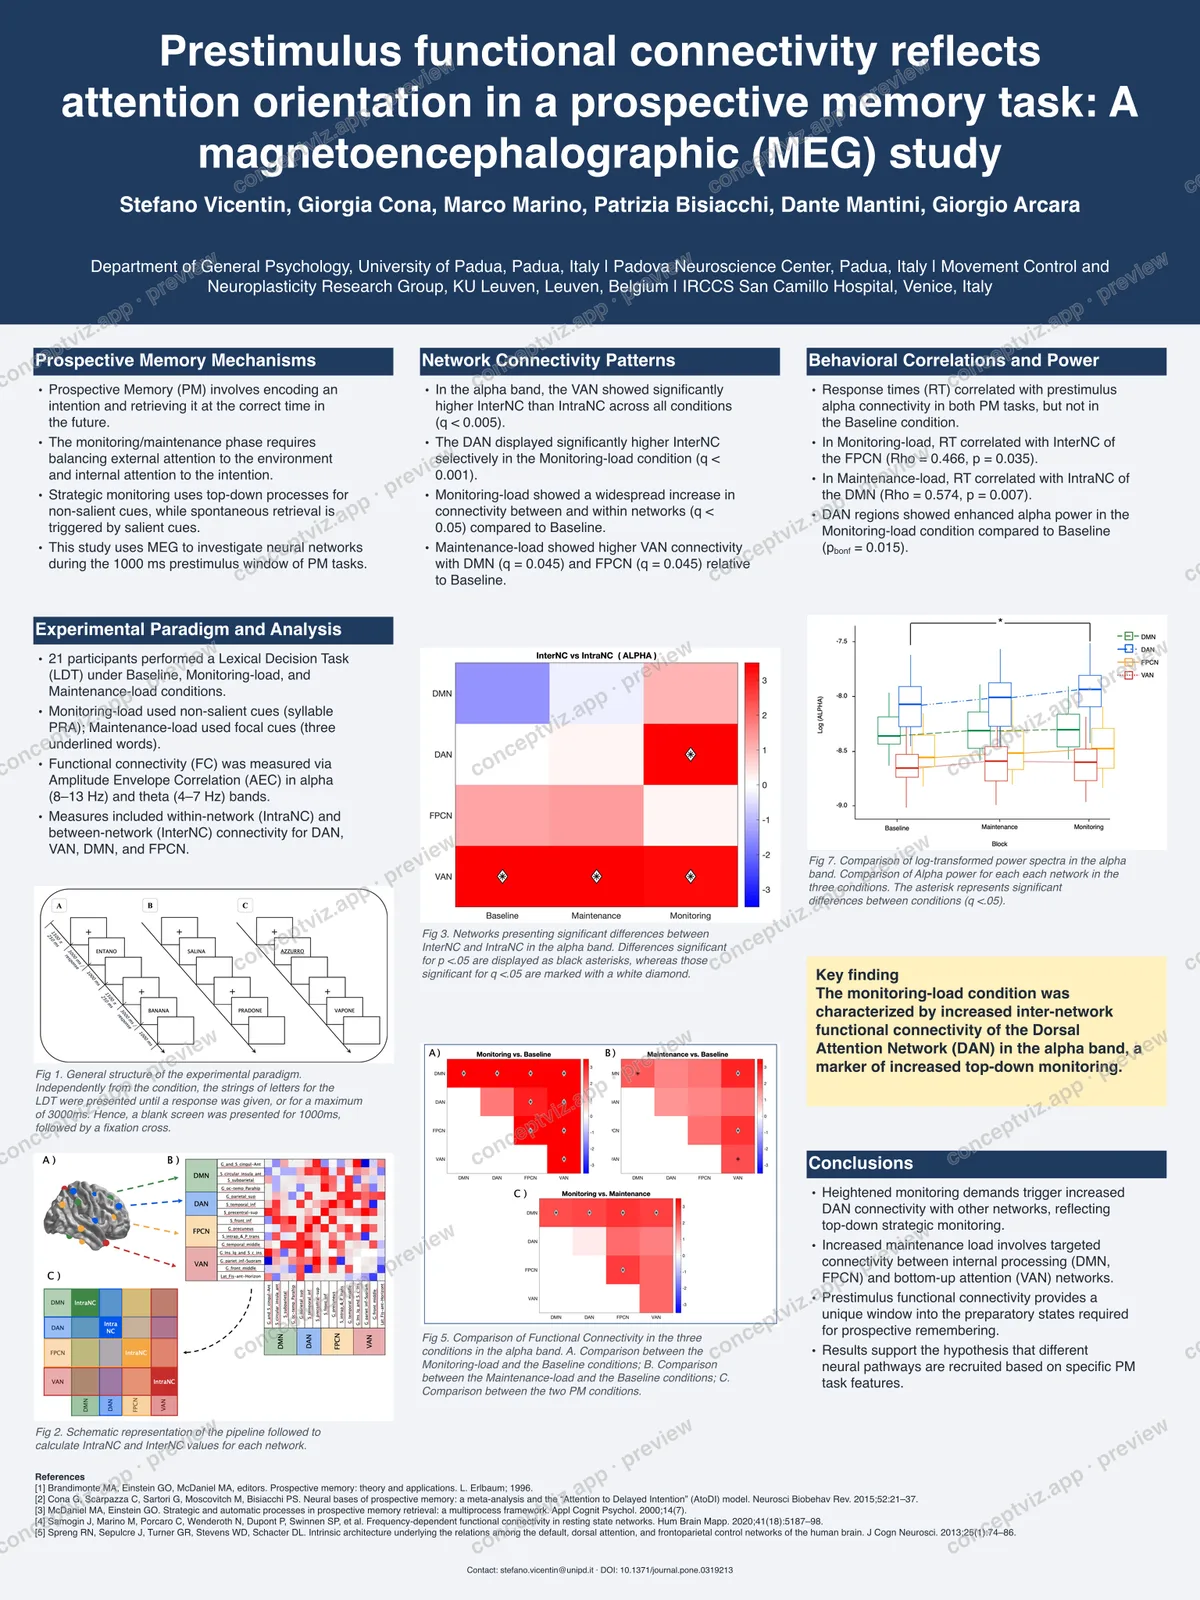
Our shortcomings, in the same run: the free preview carries a watermark and the clean PPTX and PDF cost 4 credits (one charge covers both formats). It only reads papers in English, each section is a plain bullet list rather than designed tiles, the middle column has a patch of empty space under its figure, and we make no claim for scanned PDFs. Body text is set at about 30 pt (captions 24 pt, references 20 pt), so on a dense paper some figures are left out; here it picked six of the paper's figures and tables as worth showing, and placed five of them (Table 1 did not fit).
If you want to try it, the scientific poster generator has a PDF upload section and sample downloads at three sizes.
Prices and limits we saw (17 November 2026)
- SciSpace: Basic $0 with 100 monthly credits, Lite model only, no file downloads. Premium $20/month ($12 billed yearly). Advanced and Max list poster generation and cost more.
- SciDraw: 10 credits on sign-up and 5 more every day; a poster costs 5 credits. Standard $10/month and Premium $20/month were shown at promotional prices; SVG or PPTX conversion costs extra credits.
- ConceptViz: a free daily preview, then 4 credits for the editable PPTX and PDF of one poster.
Prices change often; check each pricing page.
Which should you use
- You want the fastest visual and will rewrite the content yourself: SciDraw. Do not trust its numbers.
- You want a designed poster you can keep refining in chat and can pay: SciSpace.
- You want your own figures and numbers on the poster, in an editable PowerPoint file: a paper-to-poster tool that crops from the PDF, such as ours. Check the numbers against your paper either way.
- You want an open-source route: Paper2Poster (NeurIPS 2025) is free and outputs LaTeX, but you bring your own model API key. We did not run it, so we do not rate it.
Whatever you choose, read every number on the poster against the paper before you print. For sizes and layout rules, see our research poster size guide and scientific poster templates.
Method and limits of this test
One paper, one run per tool, on 17 November 2026, free plans, no paid conversions, no retries to get a better result. SciDraw's PDF upload failed once and we did not test other PDFs; SciSpace was run with its default free model; ConceptViz was run through the same code that powers the public tool, from our own machine (the live tool adds sign-in and the watermarked preview), so its timing is not an independent measurement. We did not test SciDraw's paid vector conversions, SciSpace's file downloads, or Paper2Poster. Results from other papers can differ. If you spot an error, email [email protected] and we will correct it. Last tested: 17 November 2026.
Scientific Poster Generator
Upload your paper PDF and get an editable poster draft with your own figures. Check every number before you print.
See the tool →More Posts
How to Create a Network Diagram: Types, Symbols & Step-by-Step Guide (2026)
Learn how to create network diagrams for IT infrastructure. Covers logical vs physical diagrams, standard symbols, topology types, and real-world examples.
Block Diagrams Explained: How to Create One with Examples (2026 Guide)
Learn what block diagrams are and how to create them step by step. Covers system, functional, and process block diagrams with real examples.
Free Photosynthesis Diagram Worksheets for Teachers (2026)
Free printable photosynthesis diagram worksheets for elementary, middle, and high school, with labeled and blank diagrams, visuals, and NGSS activities.