")
How to Create a Network Diagram: Types, Symbols & Step-by-Step Guide (2026)
Learn how to create network diagrams for IT infrastructure. Covers logical vs physical diagrams, standard symbols, topology types, and real-world examples.
Network diagrams are the backbone of IT documentation. They provide a visual map of how devices, servers, routers, and services connect within an organization's infrastructure. Whether you are planning a new office network, troubleshooting a connectivity issue, or preparing for a security audit, a well-crafted network diagram saves hours of guesswork and prevents costly misconfigurations.
In this comprehensive guide, you will learn the different types of network diagrams, standard symbols used across the industry, the most common topology patterns, and a practical step-by-step process for creating your own network diagrams from scratch.
Network Diagram Generator
Create professional network diagrams with AI. Describe your network and get a clear, labeled topology diagram.
Try it free →What Is a Network Diagram?
A network diagram is a visual representation of a computer network. It shows the devices (nodes) within the network and the connections (links) between them. Network diagrams are used by IT professionals, network engineers, system administrators, and managed service providers to plan, document, and troubleshoot network infrastructure.
Network diagrams come in two primary forms, and understanding the distinction between them is critical for effective documentation.
Logical Network Diagrams
A logical network diagram illustrates the flow of data through a network. It focuses on how information moves rather than where physical hardware is located. Logical diagrams typically show:
- IP addressing schemes and subnet boundaries
- VLANs and broadcast domains
- Routing protocols and traffic flow direction
- Firewalls and security zones as logical boundaries
- DNS, DHCP, and other network services
Logical diagrams are ideal for planning IP address allocation, understanding data flow between segments, and communicating network architecture to stakeholders who do not need to know the physical layout.
Physical Network Diagrams
A physical network diagram shows the actual hardware and its real-world arrangement. It includes:
- Rack locations and server room layouts
- Cable runs and port assignments
- Physical device placement (switches in which closet, servers in which rack)
- Redundant paths and failover connections
- Patch panel and port-to-port mappings
Physical diagrams are essential for data center planning, cabling contractors, and on-site troubleshooting when you need to locate a specific device or trace a cable.
Why Network Diagrams Matter
Without network diagrams, IT teams operate blindly. Here is what proper network documentation enables:
- Faster incident response -- technicians can trace the path between a failed link and affected users within seconds instead of wandering through server rooms.
- Smoother onboarding -- new team members understand the network structure without relying on institutional knowledge that lives only in someone's head.
- Compliance readiness -- frameworks like PCI-DSS, HIPAA, and SOC 2 explicitly require up-to-date network documentation.
- Change management -- before adding a new server or reconfiguring a firewall rule, engineers can assess the blast radius by reviewing the diagram.
- Vendor communication -- when working with ISPs, cloud providers, or contractors, a shared diagram prevents miscommunication.
Network Topology Types
Network topology describes the arrangement of nodes and connections within a network. Choosing the right topology affects performance, fault tolerance, cost, and scalability. Here are the six most common topology types you will encounter.
Star Topology
In a star topology, every device connects to a central hub or switch. All traffic passes through this central node.
- Pros: Easy to set up and manage; failure of one device does not affect others; simple to add new devices.
- Cons: Single point of failure at the central hub; requires more cabling than bus topology; hub capacity limits network size.
- Common use: Small office networks, home networks, Wi-Fi access points.
Bus Topology
A bus topology uses a single central cable (the backbone) to which all devices are connected via drop lines.
- Pros: Minimal cabling required; inexpensive for small networks; simple to implement.
- Cons: Difficult to troubleshoot; a break in the backbone disables the entire network; performance degrades as more devices are added.
- Common use: Legacy Ethernet networks; rarely used in modern installations.
Ring Topology
In a ring topology, each device connects to exactly two other devices, forming a circular data path. Data travels in one direction (or both, in a dual ring).
- Pros: Equal access for all devices; predictable performance; no collisions.
- Cons: A single device failure can disrupt the entire ring; adding or removing devices interrupts the network; more complex than star.
- Common use: Token Ring networks (historical); some metropolitan area networks (MANs); SONET/SDH fiber rings.
Mesh Topology
Mesh topology connects every device to every other device (full mesh) or to several others (partial mesh), creating multiple redundant paths.
- Pros: Highly fault-tolerant; no single point of failure; excellent for mission-critical environments.
- Cons: Expensive due to extensive cabling; complex to configure and manage; impractical for large networks in full mesh.
- Common use: WAN backbone connections; data center interconnects; wireless mesh networks.
Tree Topology
Tree topology (also called hierarchical topology) extends the star topology by connecting multiple star networks to a linear bus backbone, creating a layered structure.
- Pros: Scalable by adding branches; logical segmentation of departments or floors; fits enterprise hierarchies naturally.
- Cons: If the backbone fails, entire branches go down; more complex cabling; dependent on root node health.
- Common use: Enterprise campus networks; large office buildings with floor-by-floor distribution.
Hybrid Topology
A hybrid topology combines two or more topology types. Most real-world networks are hybrids -- for example, a tree of star networks with mesh redundancy between core switches.
- Pros: Flexible design to meet specific requirements; can optimize cost and redundancy where needed; accommodates growth.
- Cons: Complex to design and manage; troubleshooting can be challenging; documentation is essential.
- Common use: Nearly every modern enterprise network; cloud infrastructure; ISP networks.
Standard Network Diagram Symbols
Consistency in symbols makes diagrams universally readable. While there is no single mandatory standard, Cisco's icon set has become the de facto industry convention. Here are the most commonly used symbols and what they represent.
| Symbol | Description | Typical Role |
|---|---|---|
| Router | Circle with four arrows pointing outward | Forwards packets between different networks or subnets; connects LAN to WAN |
| Switch | Rectangle with bidirectional arrows | Connects devices within the same LAN; forwards frames based on MAC addresses |
| Firewall | Brick wall or rectangle with a shield | Filters traffic based on security rules; sits between trusted and untrusted zones |
| Server | Rectangle with stacked horizontal lines (rack server) | Hosts applications, files, databases, or services |
| Workstation | Monitor with a keyboard | End-user device; desktop computer or laptop |
| Cloud | Cloud shape | Represents the internet, a WAN, or a cloud service provider |
| Database | Cylinder shape | Data storage system; SQL or NoSQL database server |
| Wireless AP | Circle with radio waves emanating outward | Provides Wi-Fi connectivity to wireless devices |
| Load Balancer | Rectangle with a balance scale or horizontal lines | Distributes incoming traffic across multiple servers |
| VPN Tunnel | Dashed line with a lock icon | Encrypted connection over a public network |
Tips for Using Symbols
- Be consistent: Pick one icon set and stick with it throughout the diagram. Mixing Cisco icons with generic shapes confuses readers.
- Add labels: Always label each device with its hostname, IP address, or function. An unlabeled symbol is a mystery box.
- Use color intentionally: Color-code by network segment, VLAN, or security zone rather than using color randomly.
- Include a legend: If your audience may not recognize a symbol, add a small legend in the corner of the diagram.
How to Create a Network Diagram: Step-by-Step
Follow these six steps to build a network diagram that is accurate, readable, and useful for your team.
Step 1: Gather Your Network Inventory
Before you draw anything, collect a complete inventory of all devices on the network. This includes:
- Routers, switches, and firewalls (with model numbers and firmware versions)
- Servers (physical and virtual), including their roles (DNS, DHCP, web, database)
- Access points and wireless controllers
- End-user devices and IP phone systems
- Cloud services and SaaS connections
- WAN links, ISP connections, and VPN tunnels
- IP addressing scheme, subnet masks, and VLAN assignments
Use network scanning tools like Nmap, SolarWinds Network Topology Mapper, or your router's ARP table to discover devices automatically. Cross-reference with your asset management system.
Step 2: Choose Your Diagram Type
Decide whether you need a logical diagram, a physical diagram, or both. In most cases, you will maintain both:
- Start with a logical diagram for planning and communication.
- Create a physical diagram for cabling and data center documentation.
- For a quick overview to present to non-technical stakeholders, a simplified logical diagram works best.
Step 3: Select the Appropriate Topology Layout
Based on your inventory, identify the topology pattern that best represents your network. Most enterprise networks follow a three-tier hierarchical model:
- Core layer -- high-speed backbone switches connecting distribution layers.
- Distribution layer -- aggregation switches that enforce policies and route between VLANs.
- Access layer -- switches that connect end-user devices.
Arrange your diagram to reflect this hierarchy, with the core at the top (or center) and the access layer at the edges.
Step 4: Place Core Devices First
Start your diagram with the most critical infrastructure:
- Place the internet connection and edge router/firewall at the top.
- Add the core switches below the firewall.
- Place distribution switches branching from the core.
- Add access switches at the bottom, connecting to end devices.
- Position servers in a separate cluster (data center or server room area).
- Add wireless access points near their physical coverage zones.
Maintain visual hierarchy -- core devices should be prominent and central, while edge devices are at the periphery.
Step 5: Add Connections and Labels
Draw lines between devices to represent connections. Follow these conventions:
- Solid lines for physical Ethernet connections.
- Dashed lines for wireless links or VPN tunnels.
- Thick lines for high-bandwidth trunk links or fiber connections.
- Arrows to indicate traffic flow direction (optional, useful for logical diagrams).
Label each connection with:
- Interface names (e.g., Gi0/1, eth0)
- Link speed (e.g., 1 Gbps, 10 Gbps)
- VLAN assignment or subnet
Label each device with:
- Hostname
- IP address (management IP at minimum)
- Device role or function
Step 6: Document Additional Details
Complete your diagram with supporting information:
- Title block with diagram name, author, date, and version number.
- Legend explaining symbols, colors, and line styles.
- Notes for special configurations, planned changes, or known issues.
- Subnet table listing all VLANs with their IP ranges, gateways, and purposes.
Save your diagram in an editable format (not just a static image) so it can be updated as the network evolves.
Network Diagram Examples
Here are three common network diagram scenarios to help you visualize what your finished diagram might look like.
Example 1: Home / Small Office Network
A typical home or small office (SOHO) network is straightforward:
- Internet connects to an ISP modem/router.
- The router provides both wired Ethernet ports and Wi-Fi.
- A few workstations, a network printer, and a NAS device connect via Ethernet.
- Smartphones, tablets, and laptops connect wirelessly.
- A single subnet (e.g., 192.168.1.0/24) serves all devices.
This diagram fits on a single page and uses fewer than 15 symbols. It is useful for documenting home lab setups or small business networks for insurance or support purposes.
Example 2: Enterprise Campus Network
An enterprise campus network is more complex and typically follows the three-tier model:
- Edge layer: Dual ISP connections terminate at redundant firewalls in an active/passive pair.
- Core layer: Two core switches in a stack or virtual chassis provide the backbone.
- Distribution layer: Each building or floor has a pair of distribution switches.
- Access layer: Each floor has access switches connecting to workstations, VoIP phones, and printers.
- Data center: A separate cluster with server racks, storage arrays, and a dedicated management network.
- DMZ: Web servers and public-facing services sit in a demilitarized zone behind the firewall.
This diagram may span multiple pages or use a hierarchical layout with drill-down sub-diagrams for each floor or building.
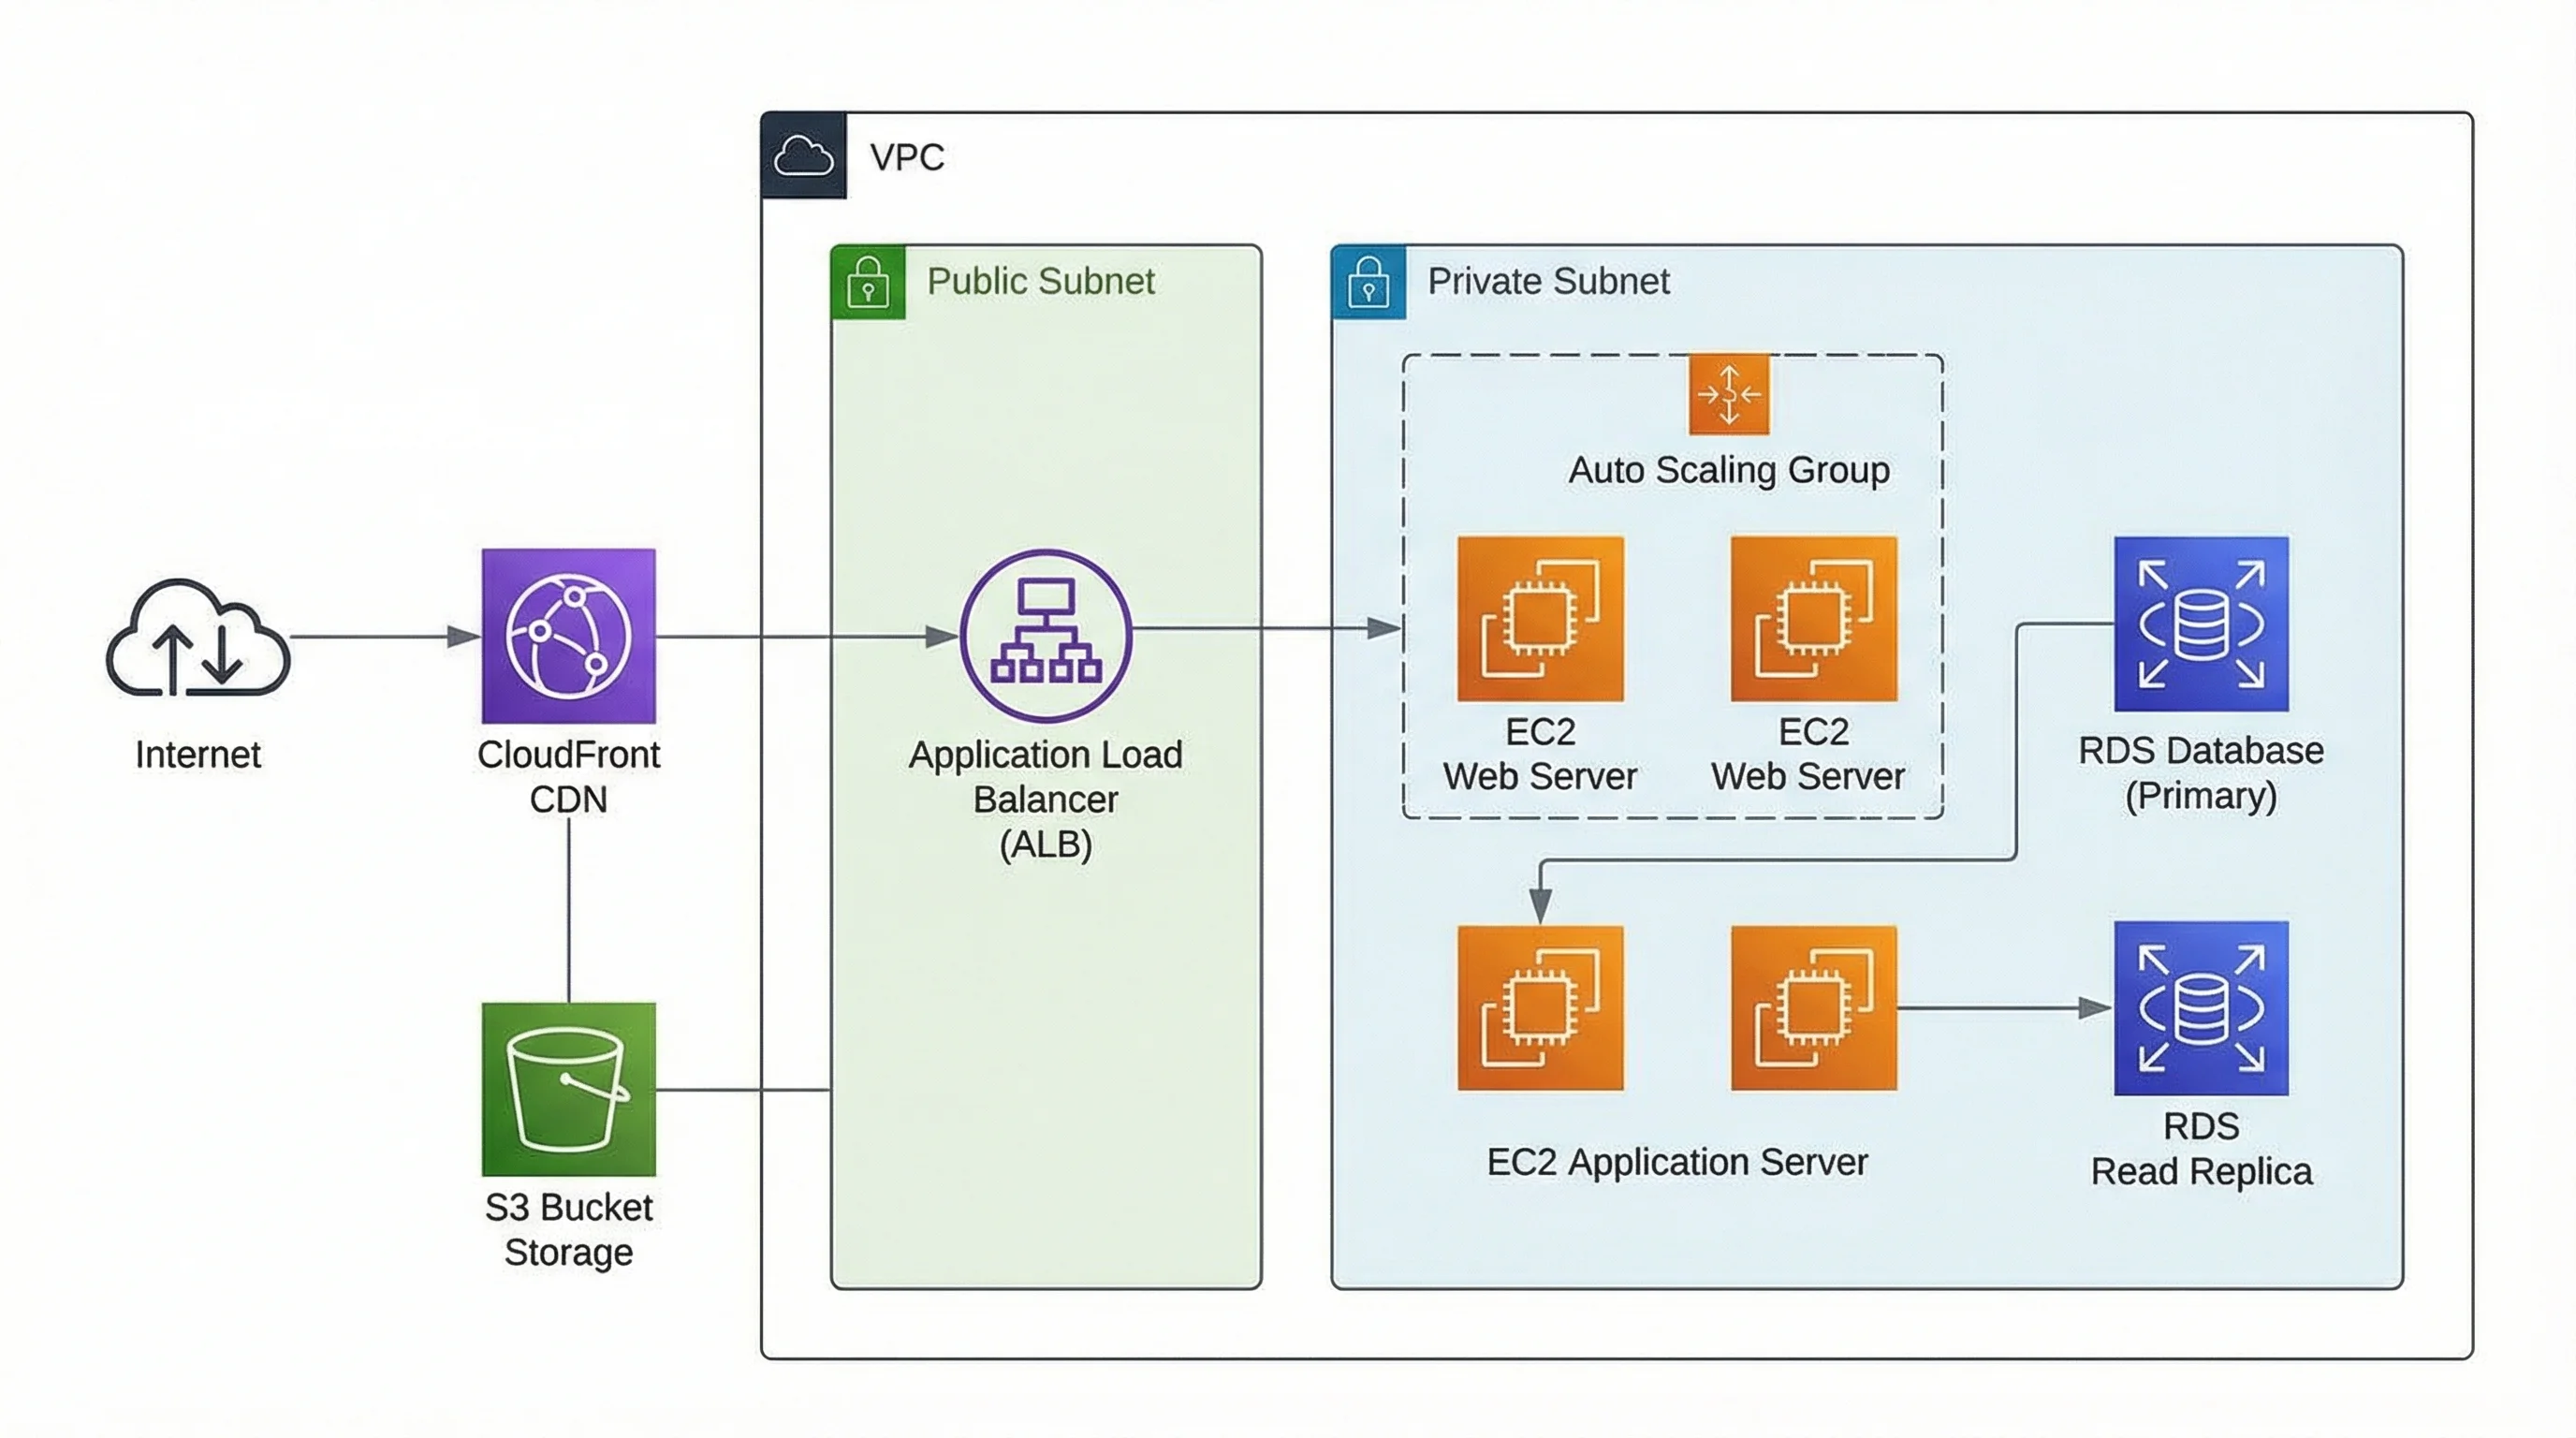
Example 3: Cloud Architecture Diagram
Modern networks extend into the cloud. A cloud architecture diagram might show:
- On-premises data center connected to a cloud provider via VPN or Direct Connect.
- Virtual Private Cloud (VPC) with public and private subnets.
- Load balancers distributing traffic to auto-scaling groups of application servers.
- Managed database services (RDS, Cloud SQL) in private subnets.
- CDN and edge caching for static content delivery.
- IAM boundaries and security groups shown as colored zones.
Cloud architecture diagrams often use the provider's official icon set (AWS Architecture Icons, Azure Icon Set, or Google Cloud icons) for clarity.
Network Diagram Best Practices
Follow these best practices to ensure your network diagrams remain useful over time.
1. Keep It Simple and Purpose-Driven
A diagram that tries to show everything becomes unreadable. Create separate diagrams for different audiences and purposes -- a high-level overview for management, a detailed logical diagram for network engineers, and a physical diagram for data center technicians.
2. Use Consistent Naming Conventions
Assign hostnames and labels that follow a logical pattern. For example, use sw-floor2-acc01 for the first access switch on the second floor, or fw-edge-01 for the primary edge firewall. Consistent naming makes diagrams self-documenting.
3. Version Control Your Diagrams
Treat network diagrams like code. Store them in a version control system (Git) or a documentation platform with revision history. Every change should be tracked with a date, author, and reason for the update.
4. Use Layers or Pages for Complexity
If your network is large, break the diagram into layers. A top-level diagram shows the overall architecture with links to sub-diagrams for each segment, floor, or data center. This approach keeps each view clean while preserving the full picture.
5. Validate Against Reality
A diagram is only as good as its accuracy. Periodically walk the server room and verify that the physical layout matches the diagram. Run network discovery scans to catch devices that were added without documentation.
6. Make It Accessible
Store diagrams where the team can find them -- a shared wiki, a documentation portal, or a network management platform. A beautiful diagram locked in one engineer's laptop is worthless during a 2 AM outage.
If you need a diagramming tool, check our comparison of the best free diagram software or explore open-source diagramming tools for self-hosted options.
When to Update Your Network Diagram
A network diagram is a living document. Here are the key triggers that should prompt an update:
New Hardware or Infrastructure Changes
Whenever a switch, router, server, or access point is added, removed, or relocated, the diagram must be updated immediately. Make diagram updates part of your change management process -- no ticket is closed until the diagram is current.
Security Audits and Compliance Reviews
Before any security audit, review your diagrams for accuracy. Auditors will compare your documentation against the actual network. Discrepancies can lead to compliance findings, so it is better to catch them first.
Network Migrations and Upgrades
Moving to a new data center, upgrading from 1G to 10G switches, or migrating workloads to the cloud all require updated diagrams. Create "before" and "after" versions to track the transition.
After Major Incidents
After resolving a significant outage or security incident, update the diagram to reflect any changes made during remediation. Also add notes about the root cause to help prevent recurrence.
Periodic Reviews
Even without specific triggers, schedule quarterly reviews of your network diagrams. Networks evolve gradually -- a device added here, a cable moved there -- and these small changes accumulate into major documentation drift if left unchecked.
Frequently Asked Questions
What is the difference between a logical and a physical network diagram?
A logical network diagram shows how data flows through the network -- IP addresses, subnets, VLANs, and routing paths. A physical network diagram shows the actual hardware layout -- where devices are located, how cables are run, and which ports are connected. Most organizations need both: logical diagrams for planning and troubleshooting, physical diagrams for cabling and on-site work.
What are the best tools for creating network diagrams?
Popular options include Draw.io (free, browser-based), Lucidchart (cloud-based with templates), Microsoft Visio (enterprise standard), and SolarWinds Network Topology Mapper (auto-discovery). For a full comparison, see our guide to the best free diagram software. If you prefer AI-assisted generation, our Network Diagram Generator lets you describe your network in plain text and receive a professional diagram.
How often should I update my network diagram?
Update your diagram whenever a change occurs -- new devices, removed hardware, reconfigured VLANs, or new cloud connections. At minimum, conduct a quarterly review to catch undocumented changes. Tie diagram updates to your change management workflow so they happen automatically as part of the approval process.
What level of detail should a network diagram include?
It depends on the audience. An executive overview might show only major segments and cloud connections. A network engineer's diagram should include IP addresses, interface names, VLAN tags, and link speeds. A physical diagram needs rack positions, cable types, and port numbers. Create multiple diagram tiers with increasing detail rather than cramming everything into one view.
Can AI generate network diagrams?
Yes. AI-powered tools can generate network diagrams from text descriptions, inventory lists, or configuration files. You describe your network in natural language -- specifying devices, connections, and topology -- and the tool produces a structured diagram. This approach is particularly useful for quick documentation, brainstorming new architectures, or generating diagrams when you do not have access to traditional diagramming software. Our Network Diagram Generator uses this approach to create topology diagrams in seconds.
Start Diagramming Your Network Today
Network diagrams are not optional -- they are a fundamental part of responsible IT management. Whether you are documenting a five-device home network or a multi-site enterprise infrastructure, the process is the same: gather your inventory, choose the right diagram type, place your devices logically, label everything clearly, and keep the diagram updated.
The hardest part is getting started. Pick one segment of your network, document it thoroughly, and expand from there. Within a few sessions, you will have a complete picture of your infrastructure that makes every future task -- from troubleshooting to capacity planning -- faster and more reliable.
Network Diagram Generator
Generate network topology diagrams from text descriptions.
Categories
More Posts
")
How to Make a Venn Diagram: Free Guide with Examples & AI Generator (2026)
Learn how to make a Venn diagram step by step. Explore 10+ real examples for science, business, and education — or use our free AI Venn diagram maker to create one instantly.

Signal Transduction Pathway Diagram: A Complete Guide for Biology Students and Researchers
Learn how to create signal transduction pathway diagrams for research papers and presentations. Covers GPCR, RTK, MAPK, and Wnt pathways with tools, symbols, and step-by-step guidance.
")
How to Make a Gantt Chart: Step-by-Step Guide for Projects and Research (2026)
Learn how to make a Gantt chart for project planning, research schedules, and launch timelines. Covers manual logic, Excel workflows, common mistakes, and when to use timeline tools instead.