Can ChatGPT Make Scientific Diagrams?
Yes, for sketches, but labels, arrows and units often go wrong. What to check, and a code route.
Describe a setup, material stack or method and get a clean labelled figure draft. Check every label, arrow and unit before you use it.
Start with this diagram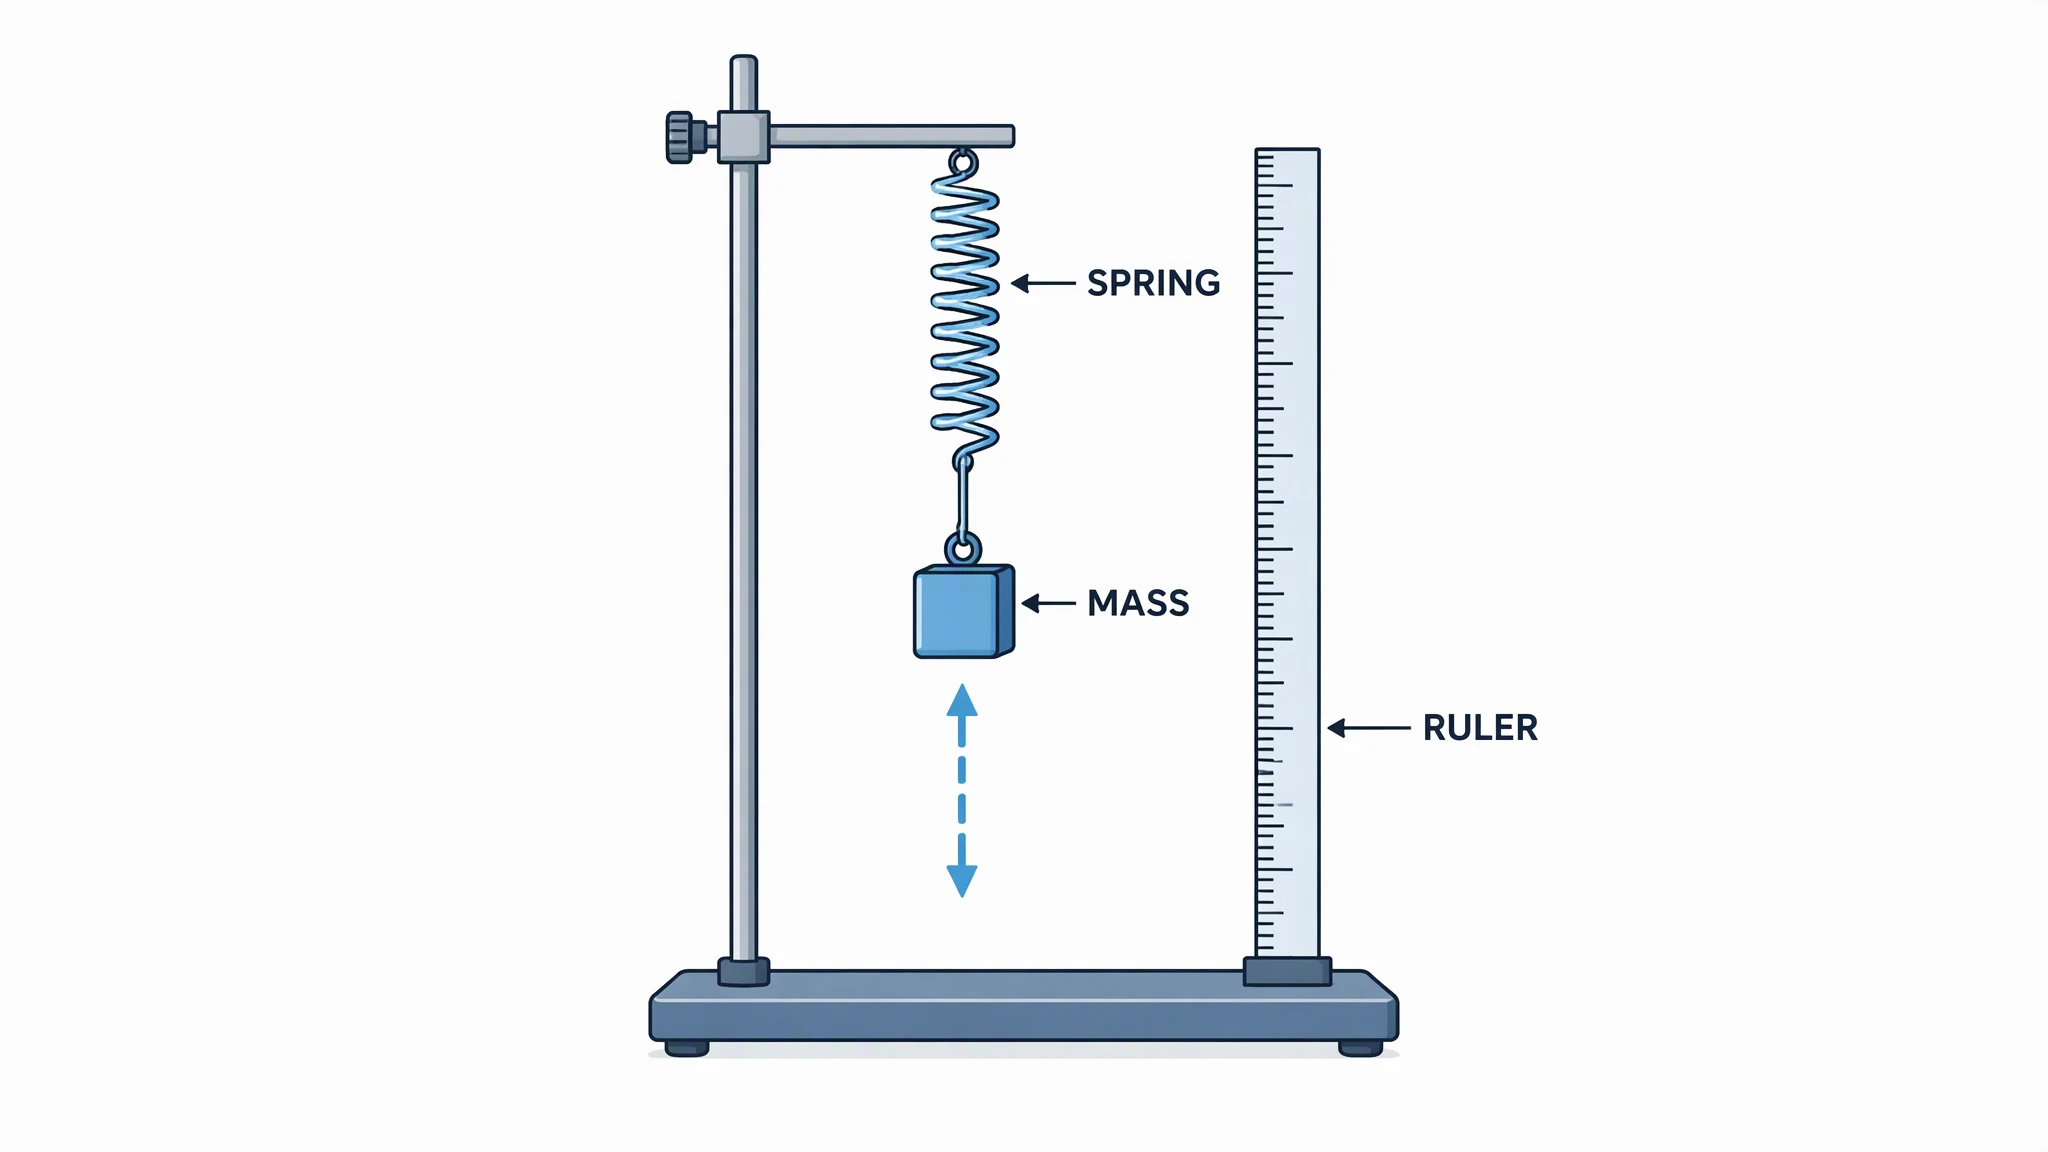
Yes, partly. ChatGPT can produce a diagram-style image from a description, including text in the picture, so it works for a first sketch or a concept figure. But AI-drawn figures often get label spelling, arrow direction, proportions and units wrong, so check every element by hand before it goes near a paper, and for exact control ask for Mermaid, TikZ or SVG code instead (the example images on this page were made with ConceptViz, not ChatGPT).
What ChatGPT can do for a figure
OpenAI's help page for ChatGPT Images says it lets you create new images and edit existing ones, and that it "can follow instructions to add text, add details within the image, or make the background transparent." It is available on all tiers, and on the Free tier image creation has its own usage limit that is separate from normal chat (checked November 2026). So the access question is easy. The harder question is whether the result is scientifically right, and that is on you.
OpenAI also says of its editor that "Highlights are not always precise, and edits may extend beyond the area you selected." In practice, if you ask for one label to be fixed, re-check the rest of the figure, because other parts can change too.
Is a ChatGPT image good enough for a paper?
Usually only as a draft. A ChatGPT image suits a concept sketch, a lab-meeting slide or a first layout idea. It is rarely safe as a final journal figure without edits, because text and arrows can hide small errors, the file is a raster image rather than editable vector art, and journals set their own resolution and AI-use rules.
Three routes, and when to use each
| Route | Best for | Control | Main risk |
|---|---|---|---|
| Ask ChatGPT for a finished image | Quick concept sketches, slide visuals | Low: you re-prompt and hope | Misspelt labels, wrong arrows, invented parts |
| Ask ChatGPT for code (Mermaid, TikZ, SVG), then render it yourself | Flowcharts, methods diagrams, anything with exact positions and text | High: you edit the source text | You must render and debug the code yourself |
| Use a dedicated figure tool such as ConceptViz | Labelled schematics of setups, stacks and pathways | Medium: prompt, check, regenerate | Still AI: you must check every label |
We have not benchmarked ChatGPT against other tools, so this table is about how each route works, not a score.
The code route: Mermaid, TikZ or SVG
A text description of a diagram is exactly what code is good at. Ask the assistant to write the source, then render it yourself, so the text is real text and positions are exact. Mermaid suits flowcharts, TikZ suits LaTeX papers, and SVG can be opened and edited in a vector editor. Here is a small Mermaid example of the pipeline figure further down this page:
flowchart LR
  A[Raw data] --> B[Clean] --> C[Train model] --> D[Validate] --> E[Report]
  D -->|Tune| C
Paste it into any Mermaid renderer and you get a flowchart whose boxes and arrows follow the code. If an arrow is wrong, you change one line instead of re-rolling a picture. The trade-off is that the look is plain and the assistant can still write code that fails to compile, so you need to run it and read the error.
What a good result looks like: three examples
To show what you are aiming for, we generated three non-biological figures with ConceptViz. These are ConceptViz outputs, not ChatGPT outputs, and we did not run a side-by-side test. Each was generated from a short prompt that listed the exact label words, and we then checked each one by eye. They are not perfect, and the notes under each image say what we would still verify.
Experimental setup. All three labels are spelled correctly, the spring hangs from the clamp arm, the mass hangs from the spring, and the double arrow shows vertical motion. What we would still check: the ruler is drawn beside the spring but its zero point and scale are not defined, and the tick marks are not uniform near one spot. Neither matters for a sketch, but both would for a measurement figure.
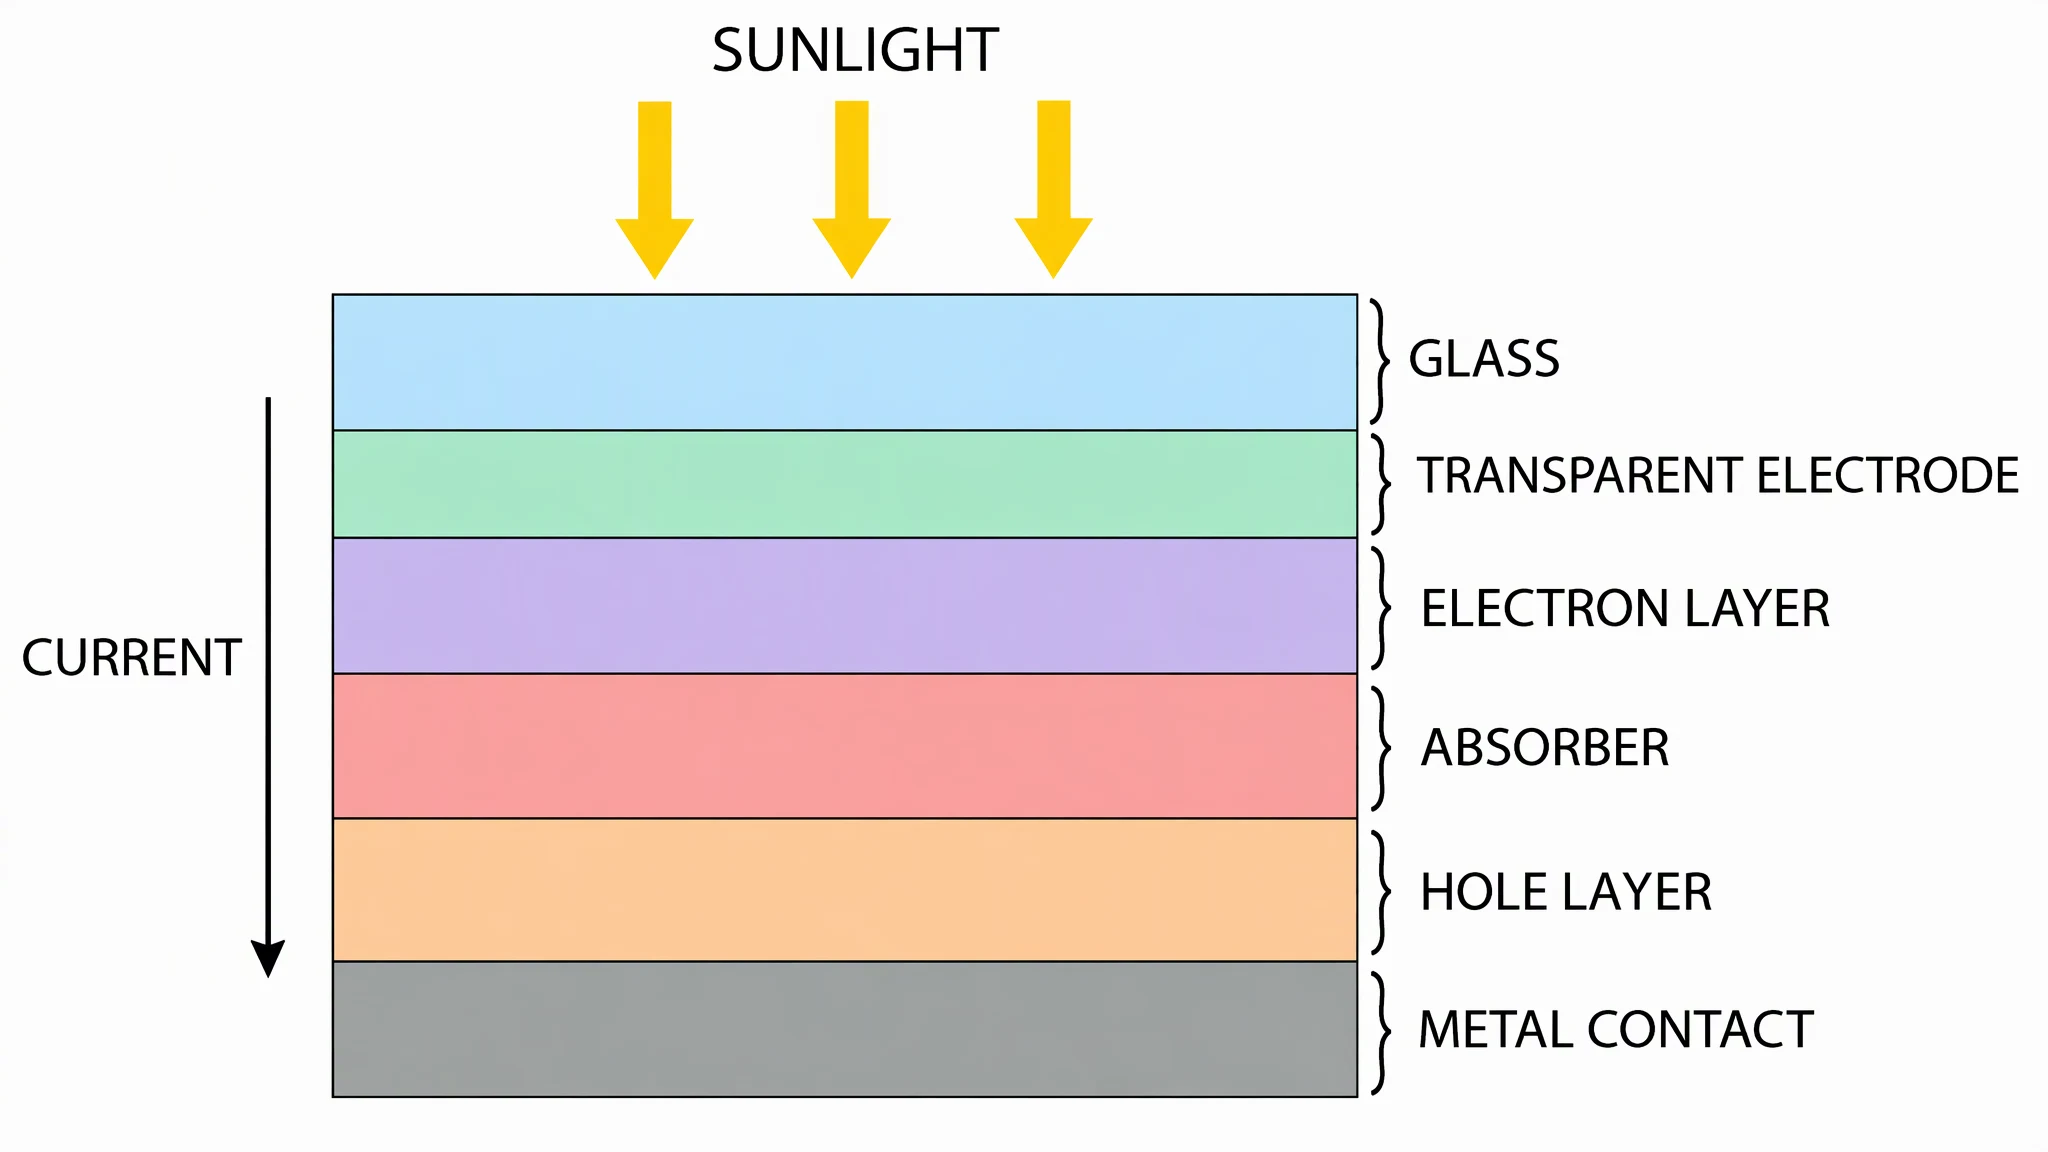
Material stack. Labels are spelled correctly and the layers are in a plausible order. What we would still check: layer thicknesses are not to scale (a real stack has very different thicknesses), and the CURRENT arrow shows one direction without saying whether it means conventional current or electron flow. A reviewer in your field would ask.
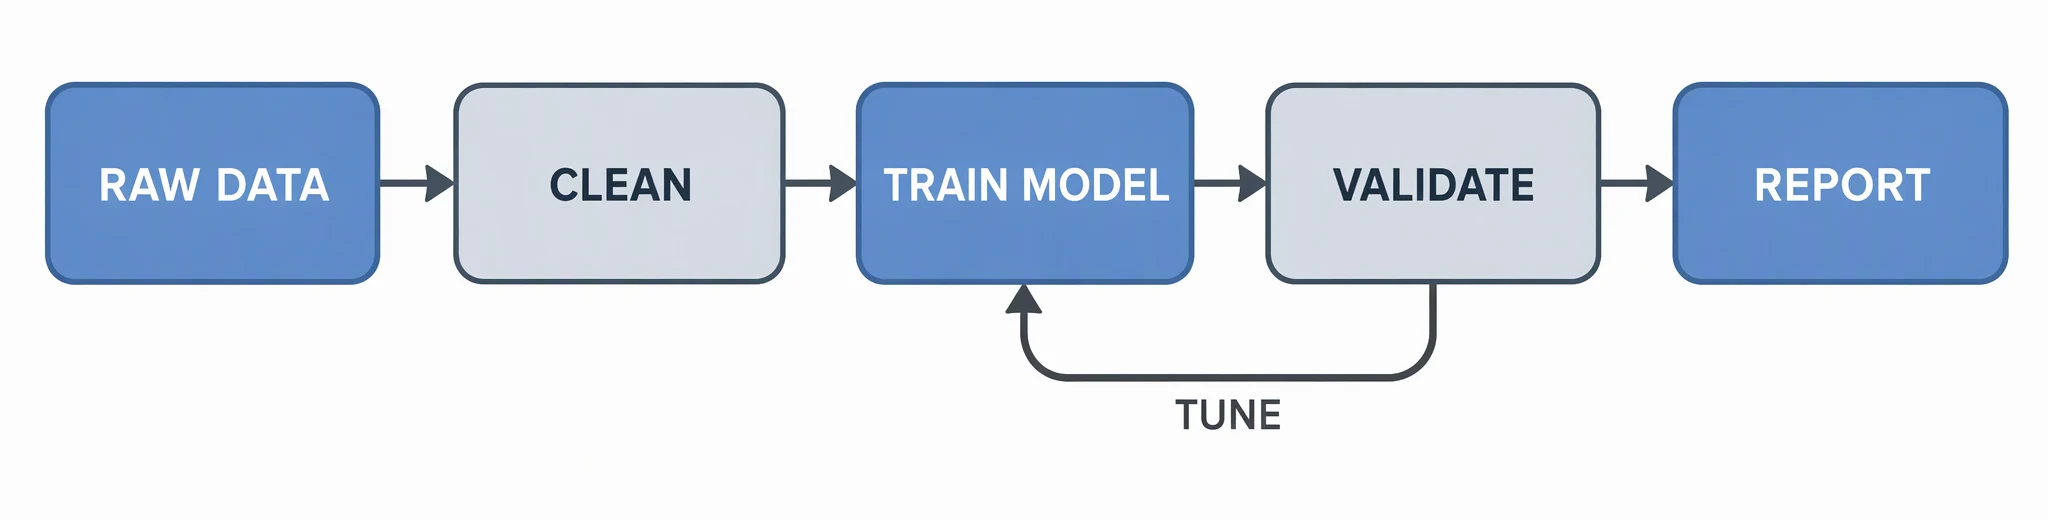
Method flowchart. Spelling, box sizes and spacing are clean and the TUNE loop points the right way. It is simple on purpose: the more boxes and cross-links you ask for, the more likely an arrow ends up in the wrong place.
The ChatGPT pitfalls checklist
Use this list on any AI-generated figure, from any tool, before you submit.
- Spelling. Read every label letter by letter, including units and chemical or gene-style names. Image models can swap or drop letters.
- Arrow direction. Trace each arrow against your actual process: beam, current, flow, causality. A wrong arrowhead reverses the meaning.
- Proportions. Check relative sizes and layer thicknesses. A schematic does not have to be to scale, but then say so in the caption.
- Legend and colours. Every colour needs one meaning, used consistently. Check that the legend matches the drawing, and that the figure still reads in greyscale.
- Units and numbers. Any value in the image (scale bars, axis ticks, concentrations) must come from your data, not from the model.
- Invented parts. Look for components that do not exist in your setup, or missing ones.
- Symbols. Circuit, optics and chemistry symbols should follow your field's convention.
- Resolution and format. Check the pixel width at the printed column width, and whether the journal wants vector files. See Figure Resolution & DPI Requirements by Journal for the numbers.
- Policy. Check the journal's rules on AI-generated images and whether disclosure is required.
How to prompt for a figure you can check
- Name the figure type and the exact labels: "labels: SPRING, MASS, RULER".
- Keep the label text short and simple; long labels are where misspellings creep in.
- Give the structure in order: "top to bottom: clamp arm, spring, mass".
- Say what to leave out: "no title, no extra text, white background".
- Regenerate rather than patch. Fix one thing at a time and re-read the whole figure each time.
If you would rather start from a tool built for labelled research figures, open the AI Scientific Image Generator or ConceptViz Studio, write a short prompt like the ones above, and run the checklist on the result.
Frequently asked questions
Can ChatGPT make scientific diagrams? It can generate diagram-style images and add text to them, according to OpenAI's help page. But labels, arrows, proportions and units often need correction, so use the result as a draft and check every element.
Is it free to make scientific diagrams with ChatGPT? OpenAI says ChatGPT Images is available on all tiers and that Free users have separate usage limits for image generation (checked November 2026). The limits can change, so check the in-product notice rather than relying on a number from a blog.
Should I ask ChatGPT for an image or for code? For flowcharts, methods diagrams and anything where positions and text must be exact, code (Mermaid, TikZ or SVG) is more controllable because you can edit the source. For a quick concept sketch, an image is faster.
Can I put a ChatGPT figure in a journal paper? Only if the journal's policy allows AI-generated images and you meet any disclosure rule. Beyond policy, you must check the science in every label and arrow, and the file must meet the journal's resolution and format requirements.
Are the example figures in this article from ChatGPT? No. They were generated with ConceptViz and are shown only to illustrate what a checkable result looks like. We did not run a comparison with ChatGPT.
Related guides
- Figure Resolution & DPI Requirements by Journal
- Nature figure size, font size and guidelines (plus Science and Cell)
- TOC graphic requirements by journal: sizes and formats
- Graphical Abstract Maker
AI Scientific Image Generator
Make a labelled figure draft for a setup, stack or method, then run the checklist above before you use it.
Try it on your figure →Sources
OpenAI statements were read from the official Help Center pages in November 2026. Wording can change, so open the live pages to confirm.
- OpenAI Help Center, Images in ChatGPT: image creation and editing, adding text, availability on all tiers, editor selection precision
- OpenAI Help Center, ChatGPT Free Tier FAQ: Free users can create images; image generation has usage limits separate from chat
Categories
More Posts
How to Write a Research Manuscript: IMRaD Format Guide
A comprehensive IMRaD format guide to writing research manuscripts. Learn the best writing order, avoid common rejection reasons, and get your paper published.
BioRender Pricing 2026: Plans, Academic Cost, When to Switch
BioRender pricing in 2026: Academic Individual is $35/month billed yearly. Compare plans, add-ons, publication rights, and when switching makes sense.
What Is a Particulate Diagram? Particle Models Explained
A particulate diagram shows matter as individual particles. Learn how particle diagrams represent solids, liquids, gases, elements, and mixtures, with examples.