Electron Transport Chain Diagram Generator Complexes I–IV
Generate a labeled ETC diagram with Complexes I–IV, Q, cytochrome c, and ATP synthase on the inner mitochondrial membrane.
Electron Transport Chain Diagram Generator
Free to try ·
Your ETC diagram will appear here
Describe your diagram and click Generate
Electron Transport Chain Examples
Labeled, simplified, and blank mitochondrial ETC diagrams for study and teaching
Simplified overview
A cleaner beginner version that keeps complex order, donors, and O₂ as the terminal acceptor.
Proton gradient
Highlights that Complexes I, III, and IV pump protons, while Complex II does not.
Complete labeled ETC
The full inner-membrane map — NADH at I, FADH₂ at II, O₂ reduced at IV, protons returning through ATP synthase.
Oxidative phosphorylation
ETC plus ATP synthase — the proton-motive force turning ADP and Pi into ATP in the matrix.
Cellular respiration context
Places the chain after glycolysis and the Krebs cycle, with NADH and FADH₂ feeding the membrane.
Blank worksheet
The same membrane layout with names removed — fill complexes, carriers, and products from memory.
What is the electron transport chain?
The mitochondrial electron transport chain (ETC) is a set of protein complexes in the inner membrane that take high-energy electrons from NADH and FADH₂ and pass them to oxygen. As electrons move, Complexes I, III, and IV pump protons into the intermembrane space. The resulting proton-motive force drives ATP synthase. This generator turns a description of that map into a labeled teaching figure. It is the respiratory chain, not the photosynthetic chain in thylakoids.
The complexes and carriers
- Complex I (NADH dehydrogenase): NADH donates electrons to ubiquinone; 4 H⁺ pumped.
- Complex II (succinate dehydrogenase): FADH₂ / succinate enter here; no protons pumped.
- Ubiquinone (Q) carries electrons in the membrane to Complex III.
- Complex III (cytochrome bc₁): Q-cycle; 4 H⁺ pumped; electrons to cytochrome c.
- Cytochrome c is a mobile protein on the intermembrane-space face.
- Complex IV (cytochrome c oxidase): electrons to O₂, making H₂O; 2 H⁺ pumped.
- ATP synthase (Complex V) lets H⁺ return to the matrix and makes ATP.
NADH vs FADH₂
NADH feeds Complex I, so those electrons drive pumps at I, III, and IV (~10 H⁺ in the common teaching tally). FADH₂ skips Complex I and enters at II, so it only drives III and IV (~6 H⁺). That is why textbooks give a lower ATP yield for FADH₂. Ask the generator to keep that split visible when you want a study figure.
Labeled vs blank diagrams, and an honesty note
A fully labeled ETC is best when you are first learning the chain: every complex, carrier, donor, and O₂ as the terminal acceptor is named. A blank version of the same membrane layout is better for revision. This tool can produce both from a short description. These diagrams are AI-generated illustrations, so always check them against your textbook before relying on them. Membrane cartoons are easy to get wrong: Complex II must not pump protons, NADH should enter at I (not II), FADH₂ at II (not I), and this page is the mitochondrial chain, not photosystem II. Treat the output as a strong starting draft to verify, not an authoritative source.
Frequently Asked Questions
Related Biology Tools
 Biology
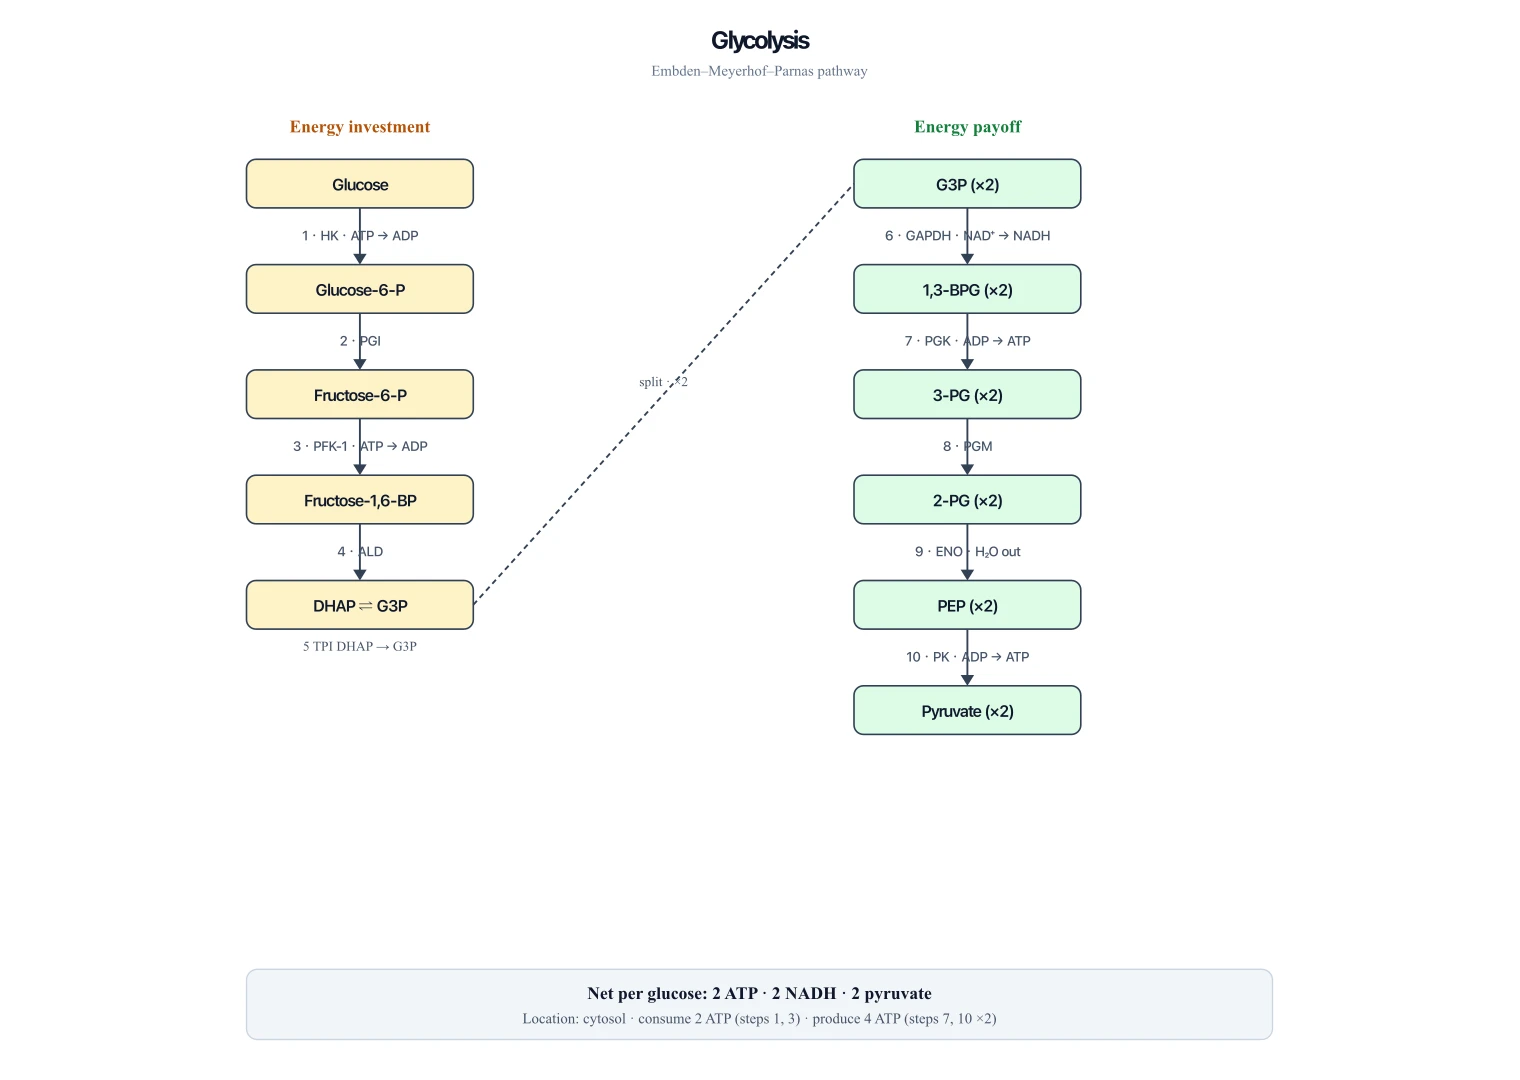
Glycolysis Diagram Generator
The cytosolic stage that produces the NADH feeding Complex I.
 Biology
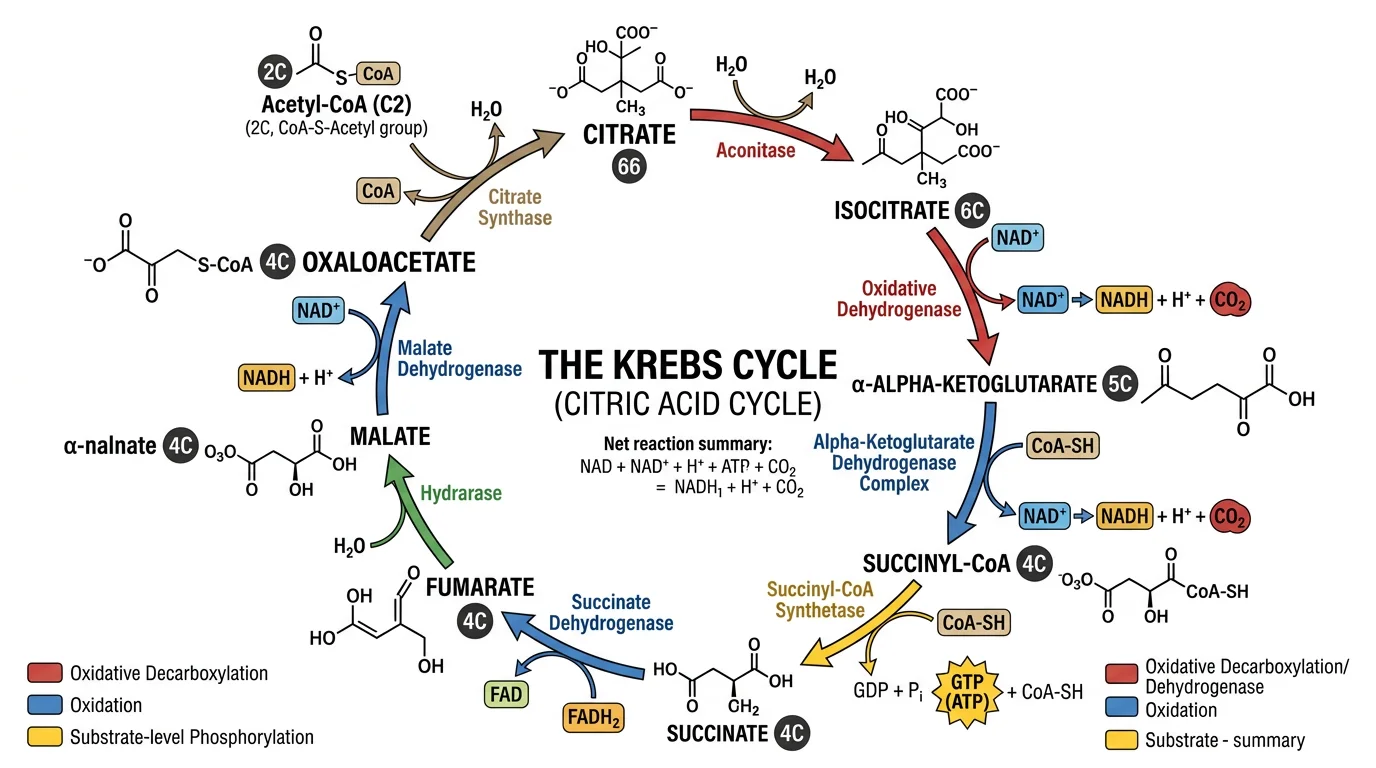
Krebs Cycle Diagram Generator
The matrix cycle that also supplies NADH and FADH₂ to the chain.
 Biology
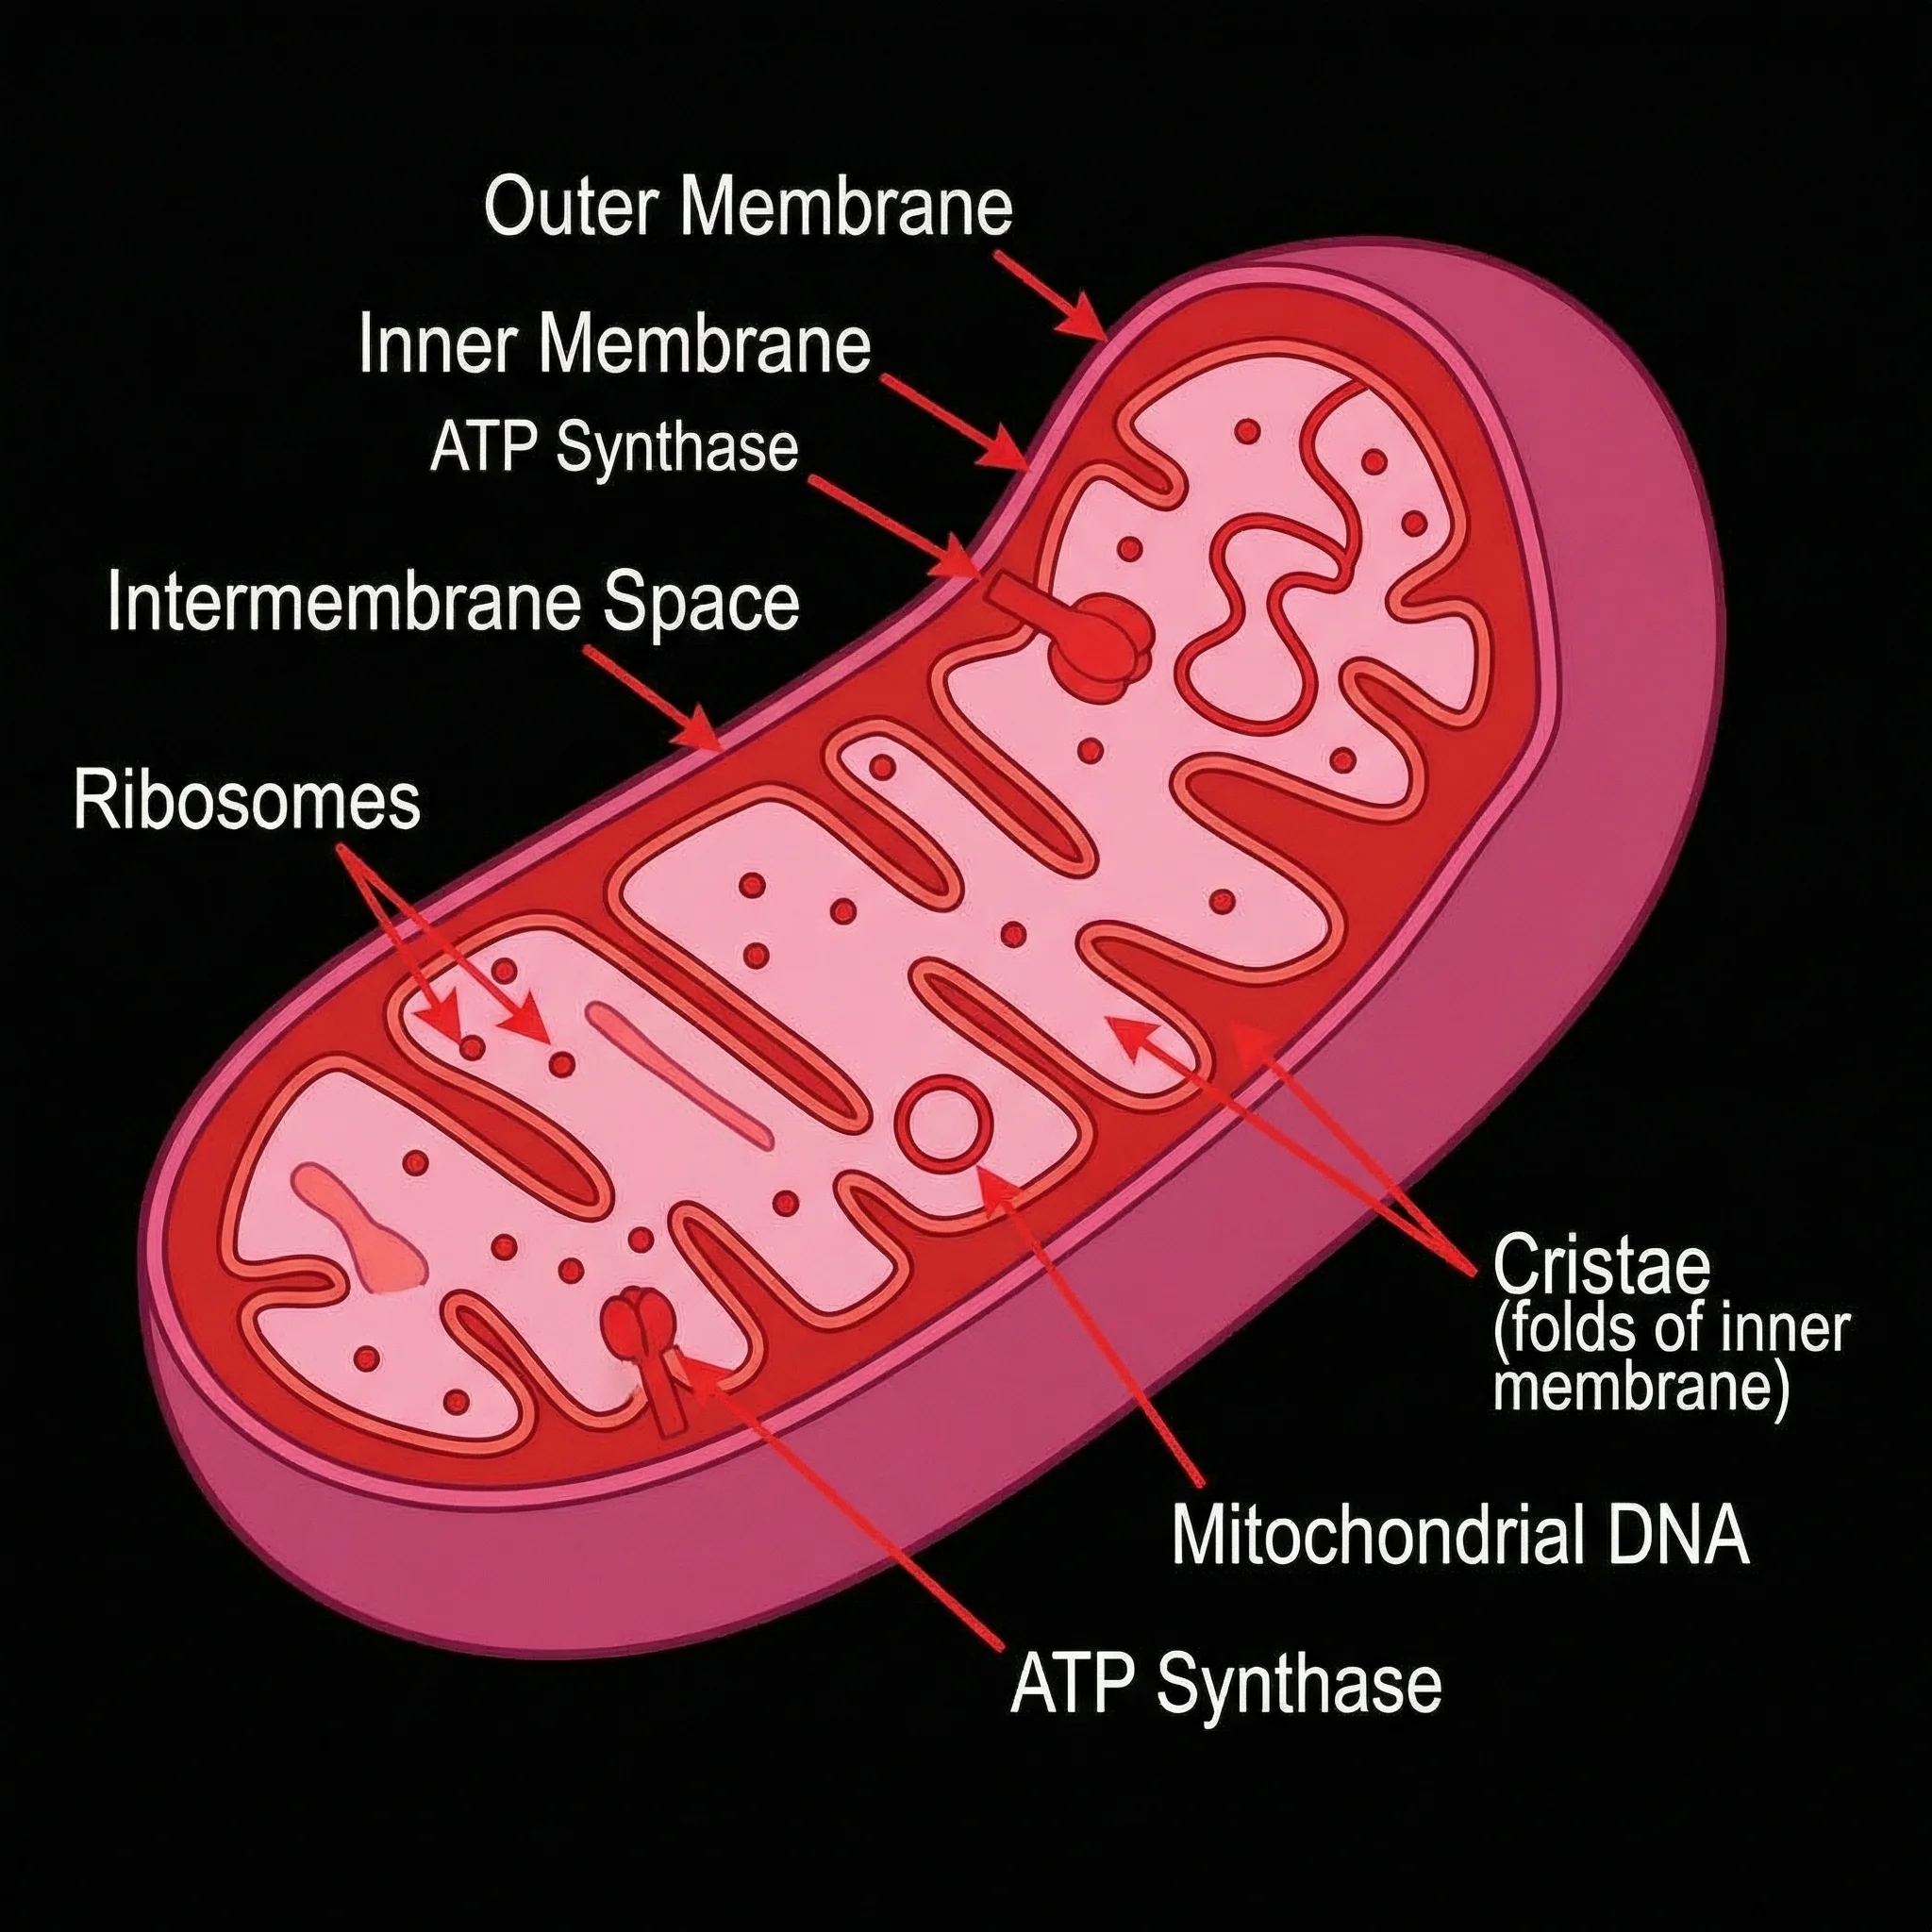
Mitochondria Diagram Generator
Label cristae, matrix, and membranes around the ETC.