Krebs Cycle Diagram Generator for the Citric Acid (TCA) Cycle
Generate a labeled Krebs cycle (citric acid cycle / TCA cycle) diagram from a plain-English description. Show acetyl-CoA entry, the eight intermediates, enzymes, and the NADH, FADH2, ATP/GTP, and CO2 outputs per turn — then download it for study, slides, or revision.
Krebs Cycle Diagram Generator
Free to try ·
Your Krebs cycle diagram will appear here
Describe your diagram and click Generate
Krebs Cycle Diagram Examples
Labeled, simplified, and blank citric acid cycle diagrams for study and teaching
Complete Labeled Krebs Cycle
The full eight-step cycle — every intermediate from citrate back to oxaloacetate, with enzymes and energy carriers labeled.
Simplified Cycle Overview
A clean, beginner-friendly version that highlights acetyl-CoA entry and the headline outputs per turn.
Cycle With Enzymes
Focuses on the enzyme at each step, with the three key regulatory enzymes called out.
Energy Carrier Focus
Marks exactly where each NADH, FADH2, GTP, and CO2 comes from, with a per-turn summary.
Mitochondrial Context
Places the cycle in the mitochondrial matrix and shows NADH and FADH2 feeding the electron transport chain.
Blank Cycle for Revision
A blank, unlabeled version for self-testing — fill in the intermediates, enzymes, and products from memory.
What is the Krebs cycle (citric acid cycle / TCA cycle)?
The Krebs cycle — also called the citric acid cycle or the tricarboxylic acid (TCA) cycle — is a closed loop of eight enzyme-driven reactions that oxidize acetyl-CoA to extract its energy. Each turn begins when a two-carbon acetyl group joins with the four-carbon oxaloacetate to form the six-carbon citrate, and ends when oxaloacetate is regenerated, ready to accept the next acetyl group. The three names refer to the same pathway: "Krebs" honors Hans Krebs, who worked it out in 1937, while "citric acid" and "tricarboxylic acid" both describe citrate, the first molecule made in the cycle. This generator turns a description of the pathway into a clear, labeled diagram you can study from.
Where does the Krebs cycle happen?
In eukaryotic cells, the Krebs cycle takes place in the mitochondrial matrix — the innermost compartment of the mitochondrion, enclosed by the folded inner membrane. This location matters: the NADH and FADH2 produced by the cycle are handed straight to the electron transport chain embedded in that same inner membrane, so the energy carriers do not have to travel far. (In prokaryotes, which lack mitochondria, the same reactions occur in the cytoplasm.) If you want to see the cycle in its compartment, our mitochondria diagram generator shows the matrix, cristae, and membranes around it.
How the Krebs cycle fits into cellular respiration
The Krebs cycle is the third stage of aerobic cellular respiration. First, glycolysis splits glucose into two molecules of pyruvate in the cytoplasm. Next, in the link reaction (pyruvate oxidation), each pyruvate is converted to acetyl-CoA, releasing one CO2 and producing NADH. That acetyl-CoA is the fuel the Krebs cycle burns. Finally, the NADH and FADH2 the cycle generates carry high-energy electrons to the electron transport chain, where most of the cell's ATP is actually made through oxidative phosphorylation. So the cycle sits after glycolysis and the link reaction, and before the electron transport chain — the engine room that loads up the electron carriers.
The eight steps and key intermediates
- Step 1 — Acetyl-CoA + oxaloacetate combine to form citrate (catalyzed by citrate synthase).
- Steps 2–3 — Citrate is rearranged to isocitrate, then oxidized to alpha-ketoglutarate, releasing the first CO2 and the first NADH.
- Step 4 — Alpha-ketoglutarate is oxidized to succinyl-CoA, releasing the second CO2 and a second NADH.
- Step 5 — Succinyl-CoA is converted to succinate, producing one ATP or GTP (substrate-level phosphorylation).
- Step 6 — Succinate is oxidized to fumarate, producing FADH2.
- Steps 7–8 — Fumarate is hydrated to malate, then oxidized back to oxaloacetate, producing the third NADH and closing the loop.
Outputs per turn and per glucose molecule
Each turn of the Krebs cycle produces 3 NADH, 1 FADH2, 1 ATP (or GTP), and 2 CO2, while regenerating the oxaloacetate needed to start again. Because glycolysis splits one glucose into two pyruvate molecules — and therefore two acetyl-CoA — the cycle turns twice per glucose. Doubling the per-turn figures gives the totals per glucose: 6 NADH, 2 FADH2, 2 ATP/GTP, and 4 CO2. Those NADH and FADH2 molecules are where most of the energy from glucose ends up; the electron transport chain later converts them into the bulk of the cell's ATP. Showing both the per-turn and per-glucose numbers on a diagram is one of the clearest ways to make the bookkeeping stick.
Labeled vs blank diagrams for study, and an honesty note
A fully labeled Krebs cycle diagram is ideal when you are first learning the pathway: every intermediate, enzyme, and output is named so you can trace the logic. A blank version — the same circular layout with the labels removed — is better for revision and self-testing, since you fill in the molecules and products from memory before checking your answers. This tool can produce both: describe what you want labeled, or ask for a blank template for quiz practice. One important caveat: these diagrams are AI-generated illustrations, so always review them against your textbook or course notes before relying on them. AI can occasionally mislabel an intermediate, place an enzyme on the wrong step, or miscount CO2 or hydrogen carriers, so treat the output as a strong starting draft to verify, not an authoritative source.
Frequently Asked Questions
Related Biology Tools
 Biology
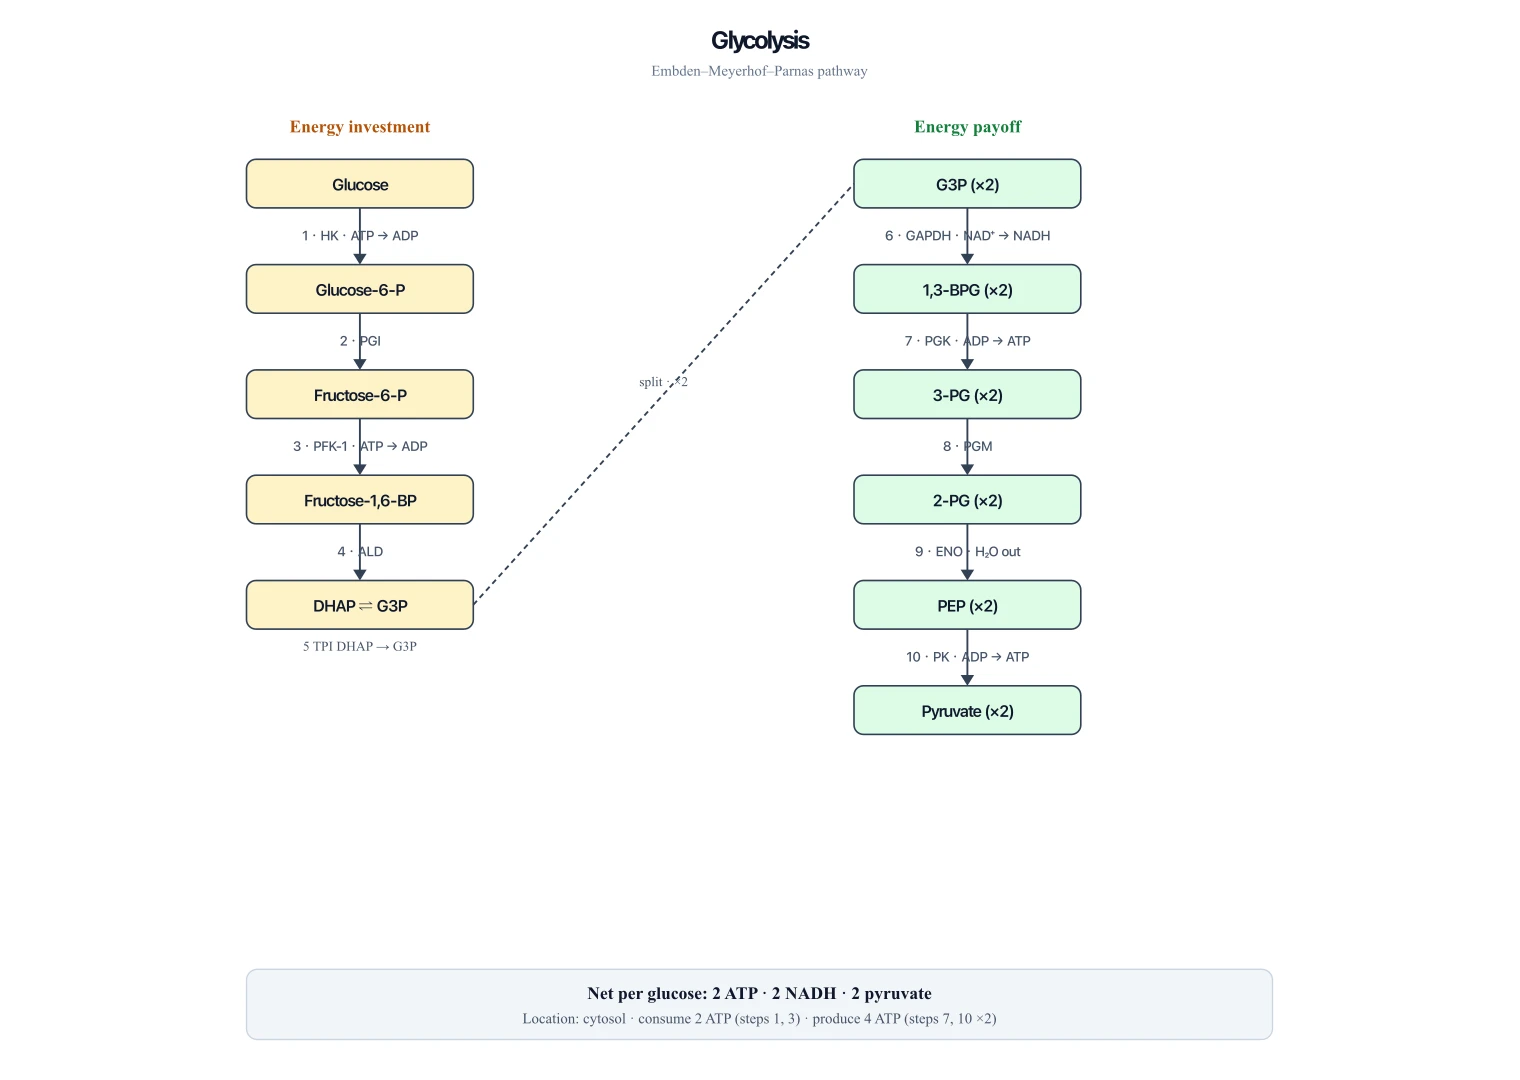
Glycolysis Diagram Generator
The stage before pyruvate oxidation — ten cytosolic steps from glucose to two pyruvate.
 Biology
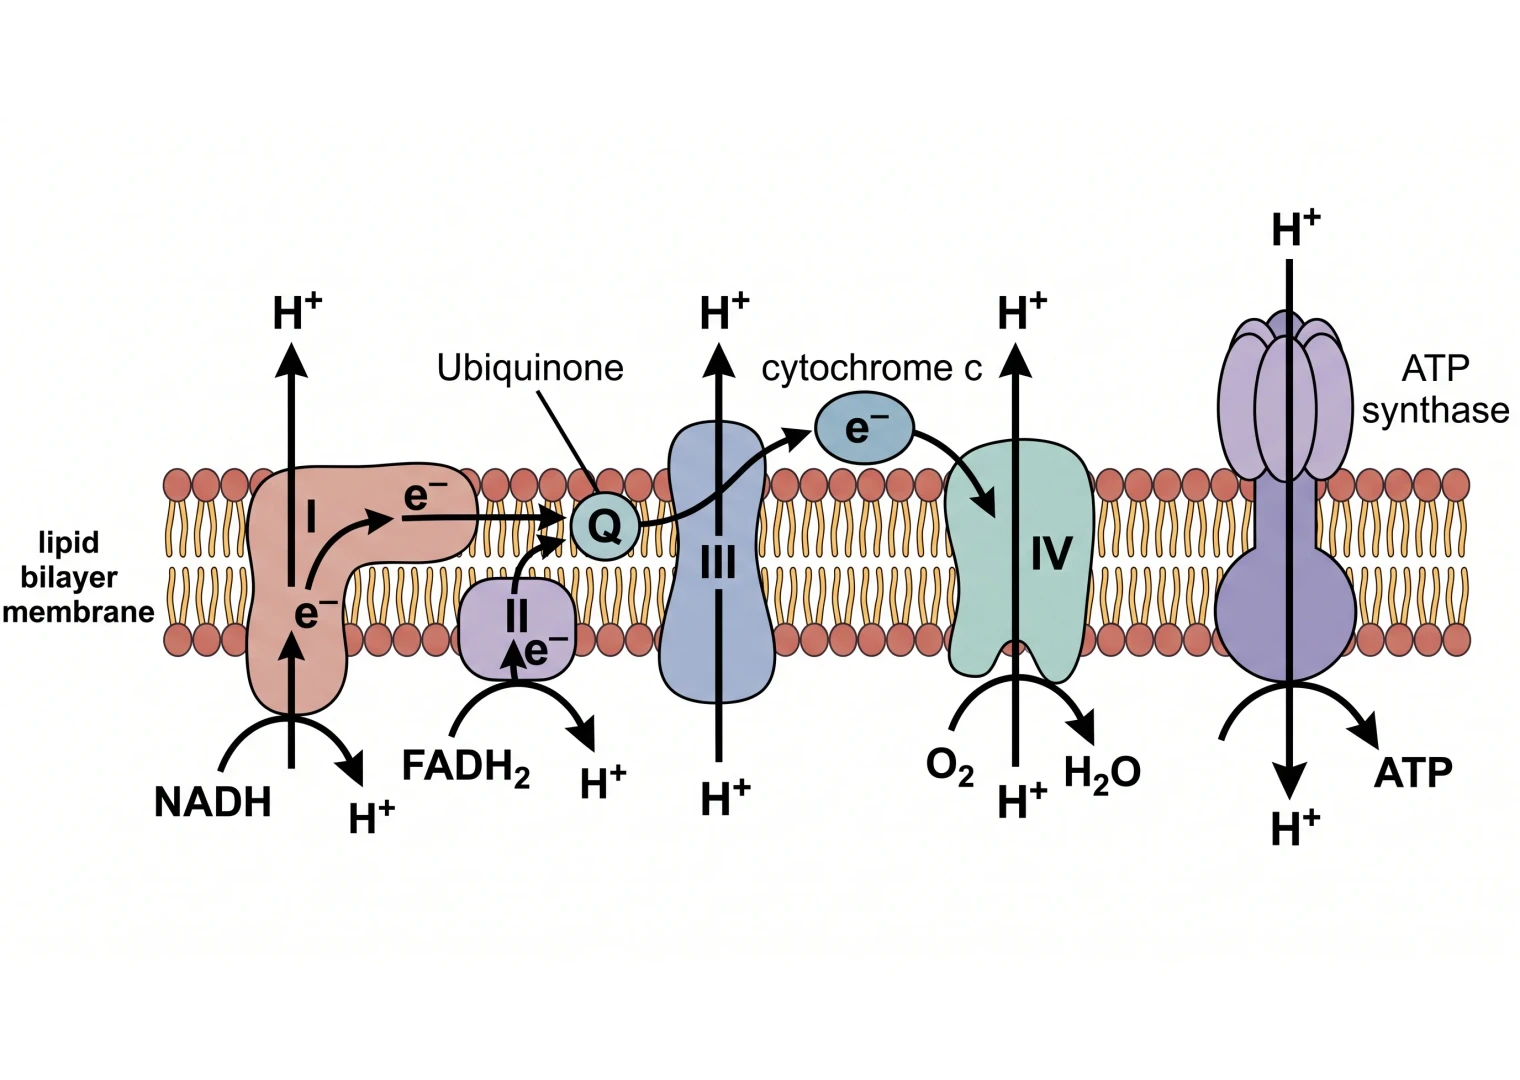
Electron Transport Chain Diagram Generator
The inner-membrane chain that oxidizes NADH and FADH₂ from the cycle.
 Biology
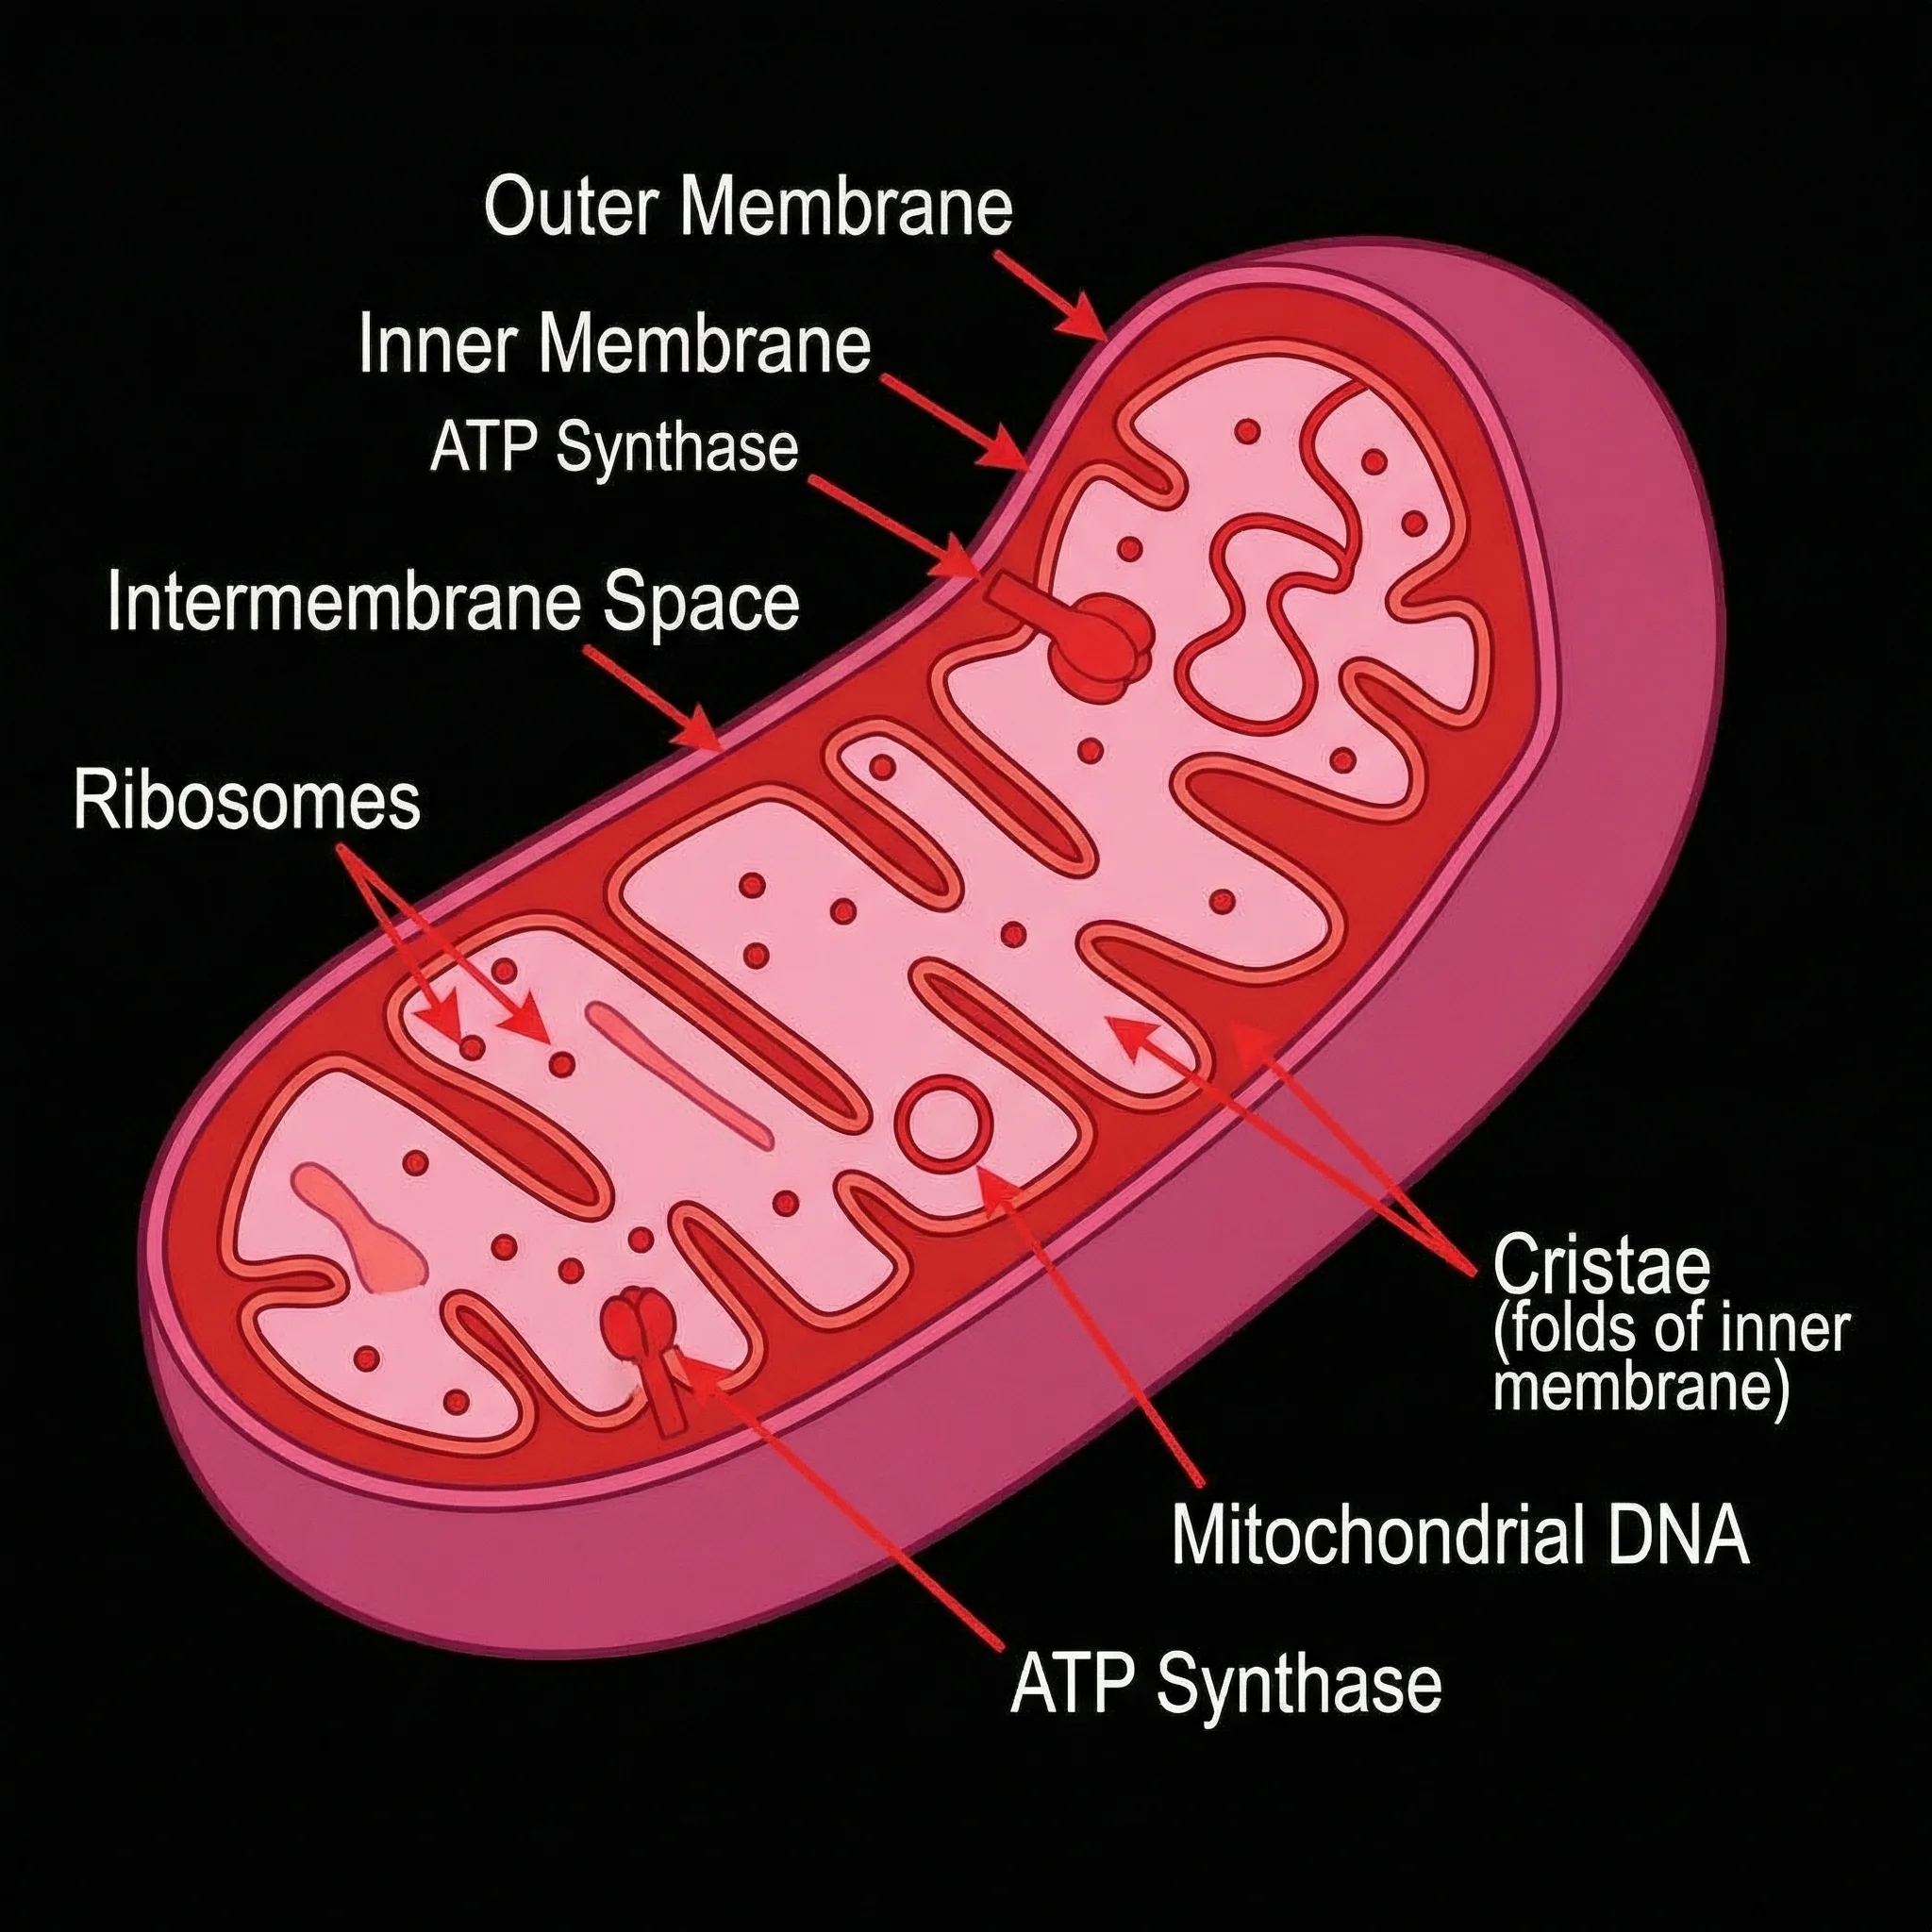
Mitochondria Diagram Generator
Draw a labeled mitochondrion showing the matrix, cristae, and membranes where the Krebs cycle runs.
 Biology
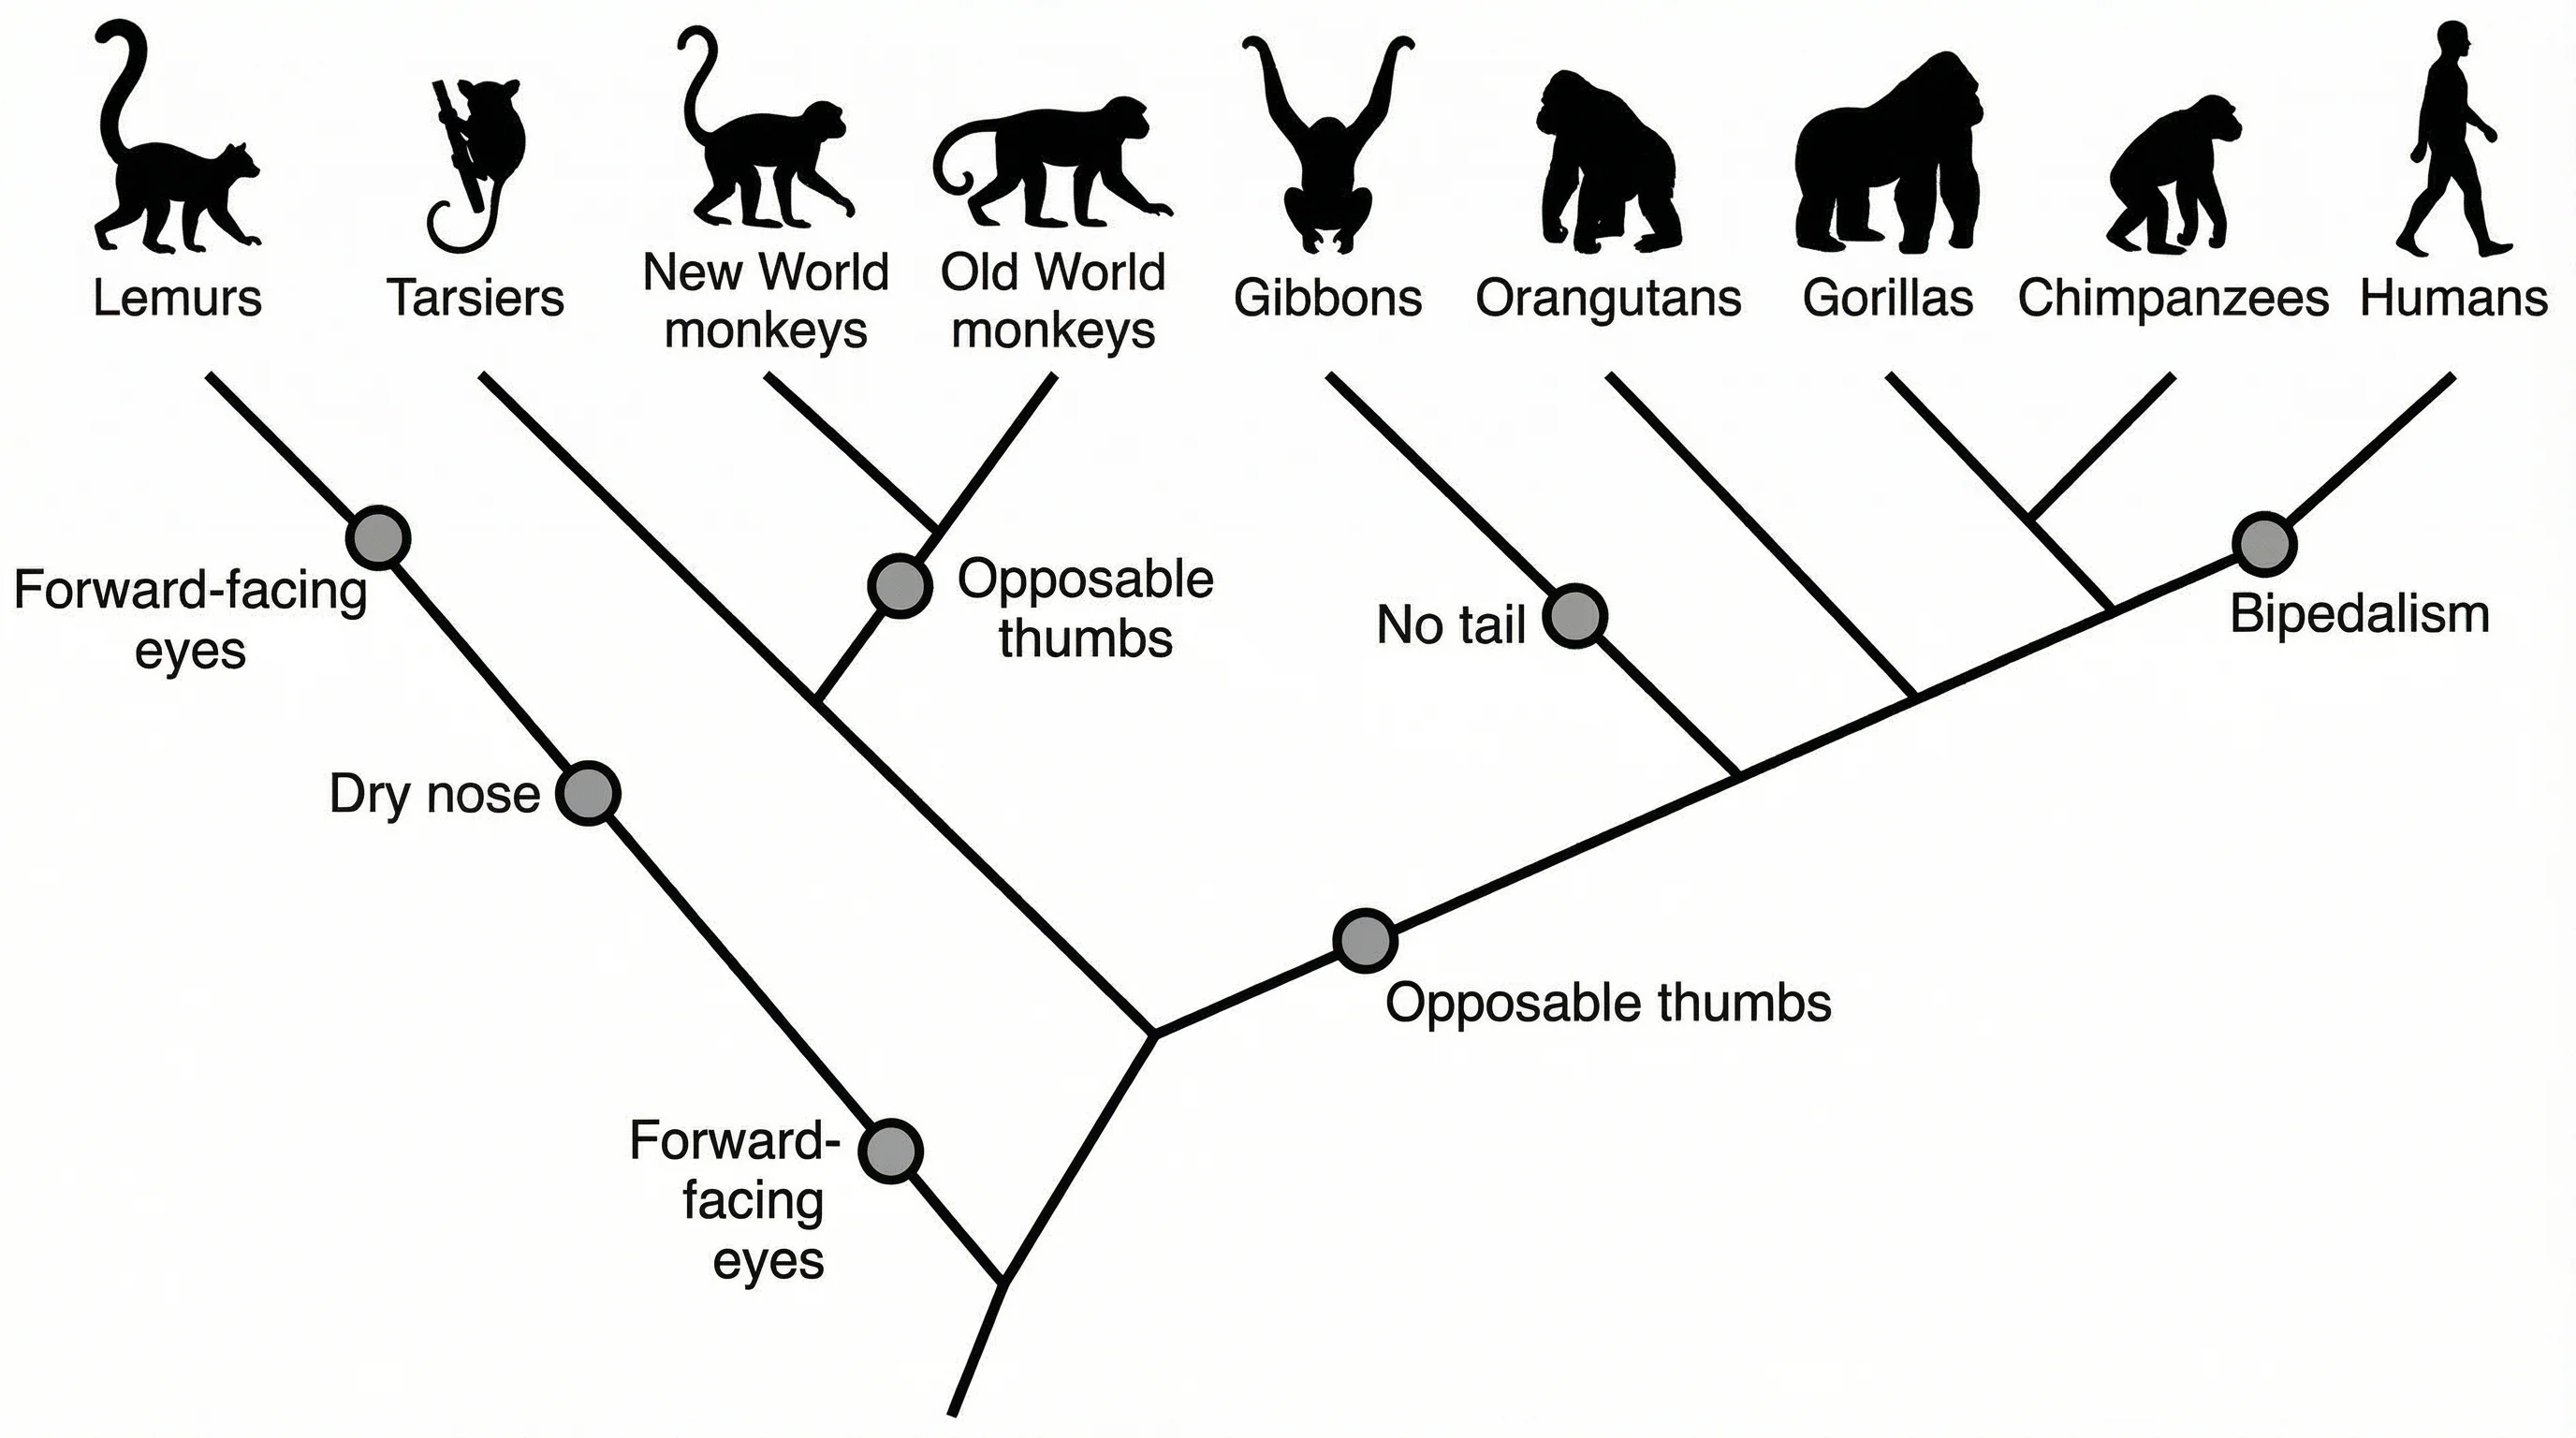
Phylogenetic Tree Maker
Create evolutionary phylogenetic trees showing species relationships and divergence.
 Biology
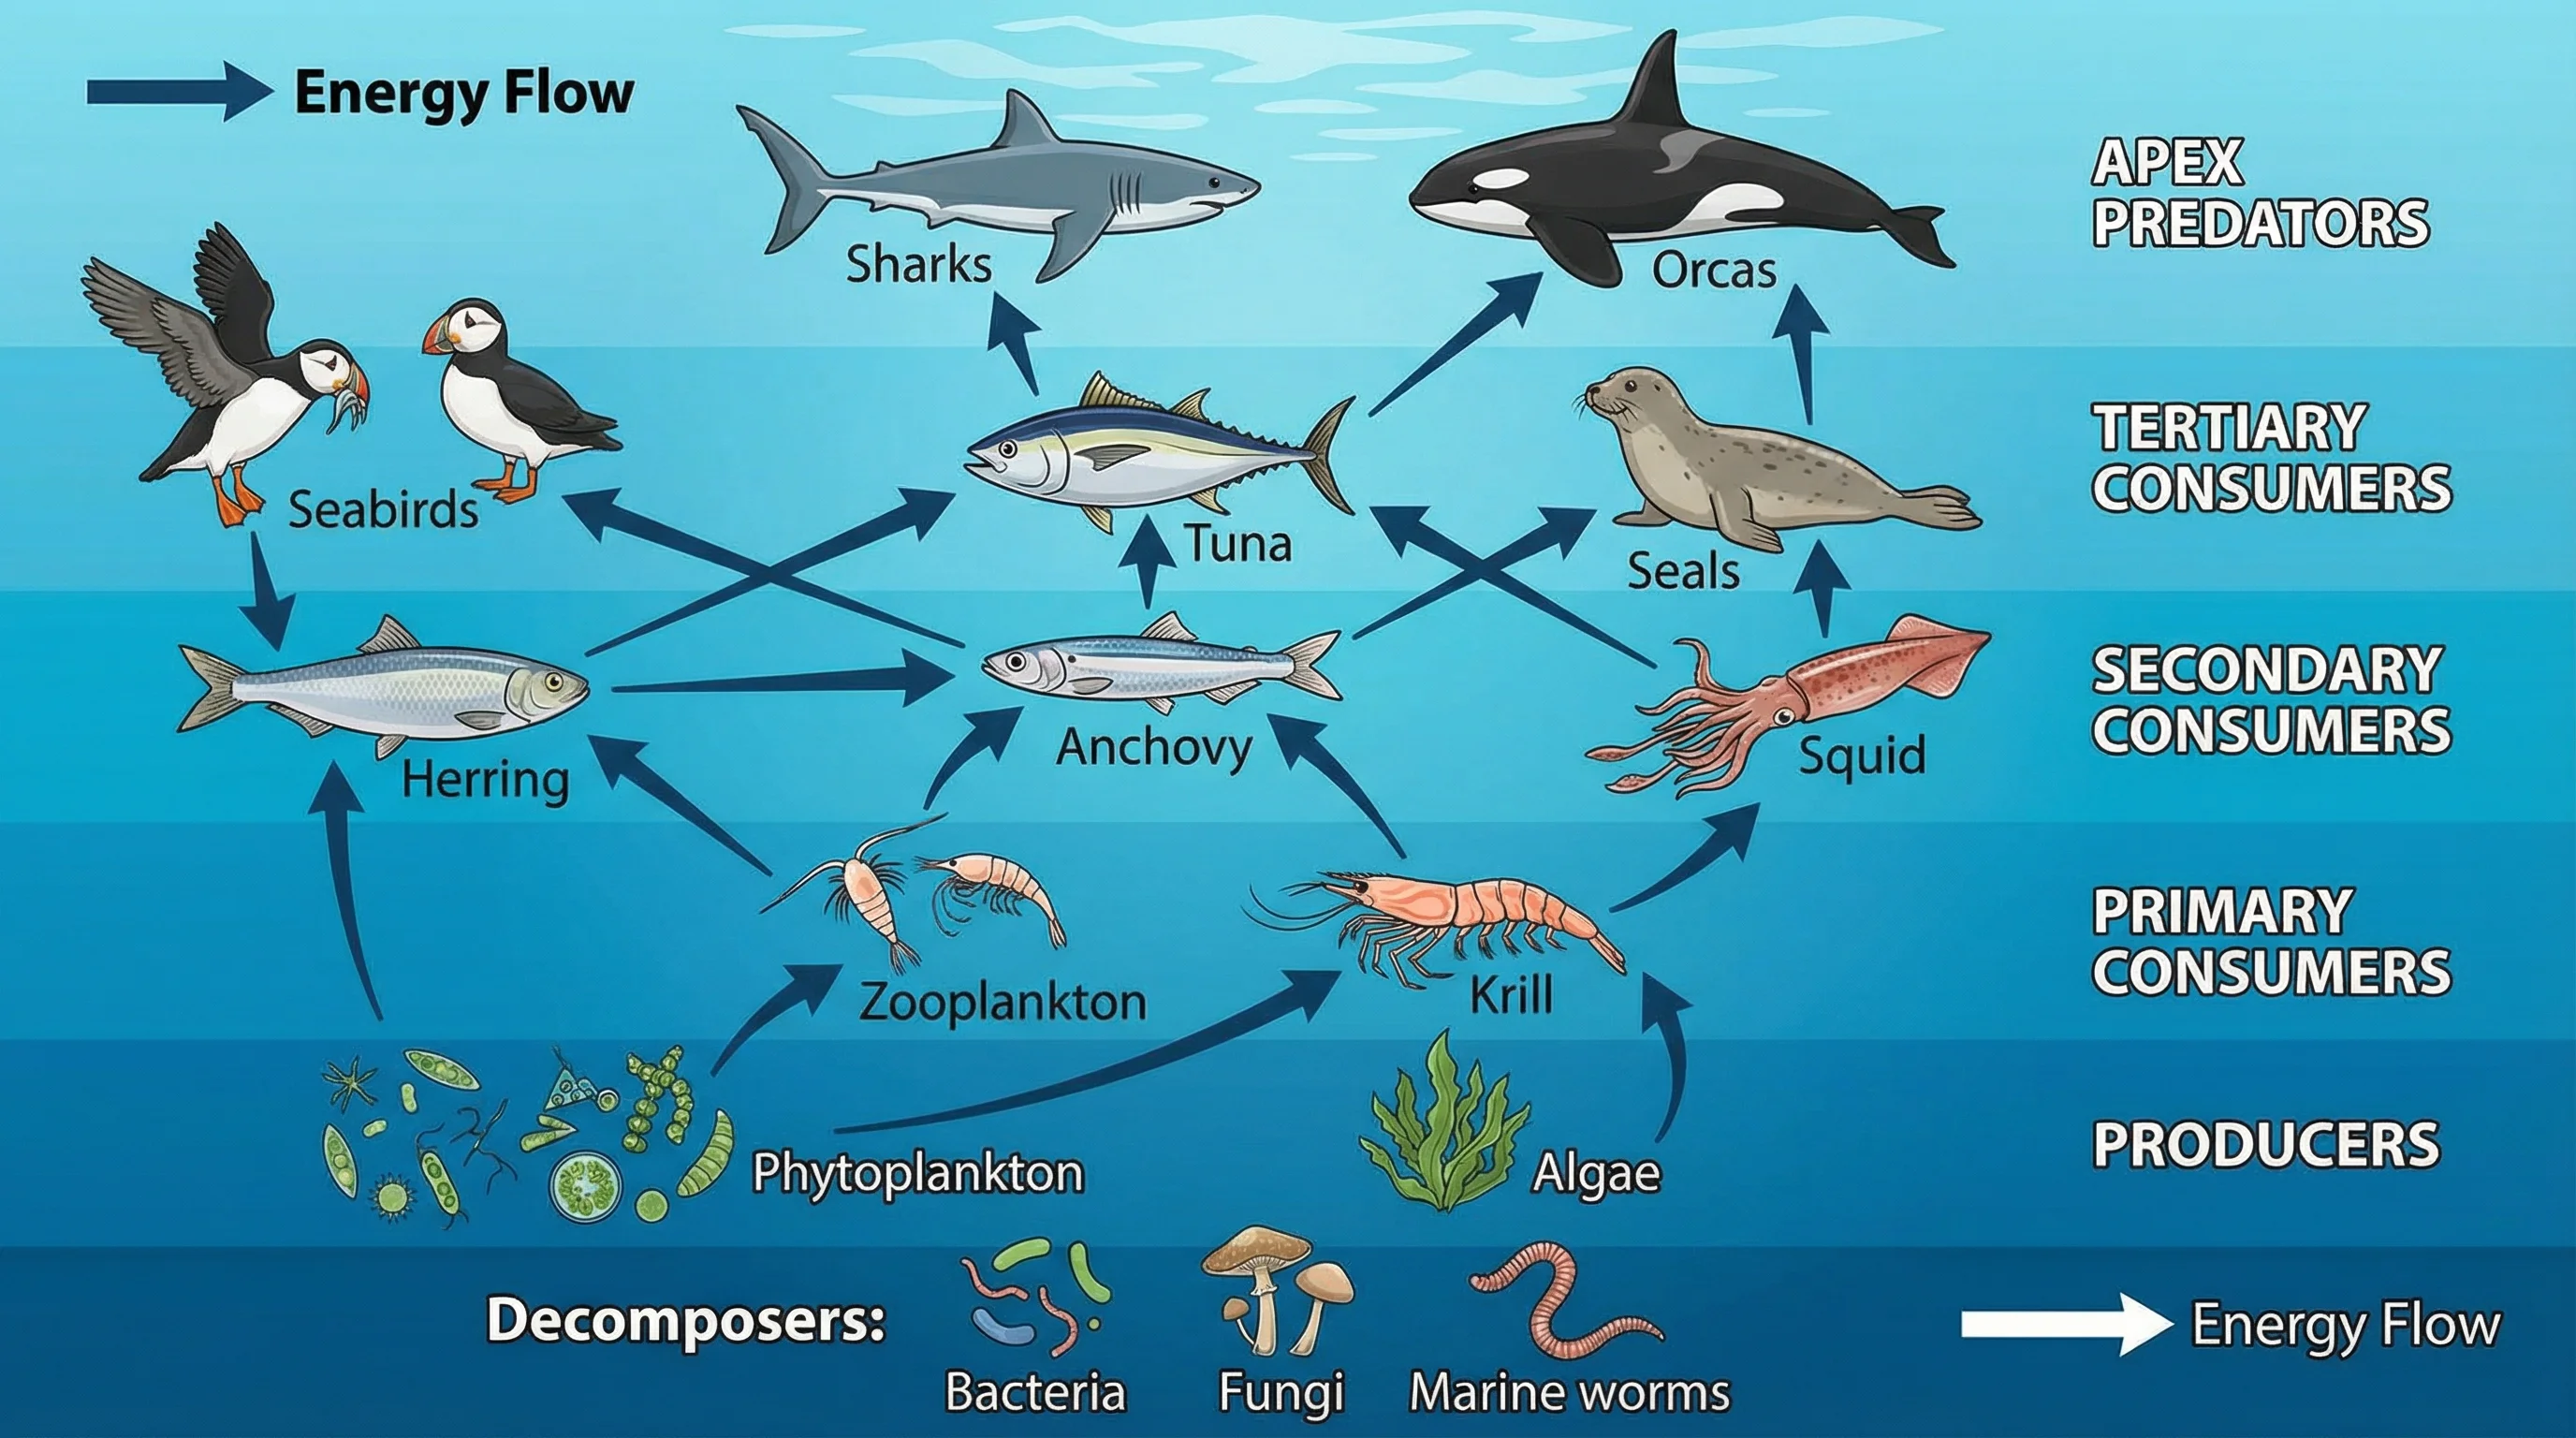
Food Web Generator
Build food web diagrams showing trophic levels and energy flow in ecosystems.