Blog
Teaching tips, tool comparisons, and science diagram guides for STEM educators. Create better classroom materials with AI-powered diagram generation.
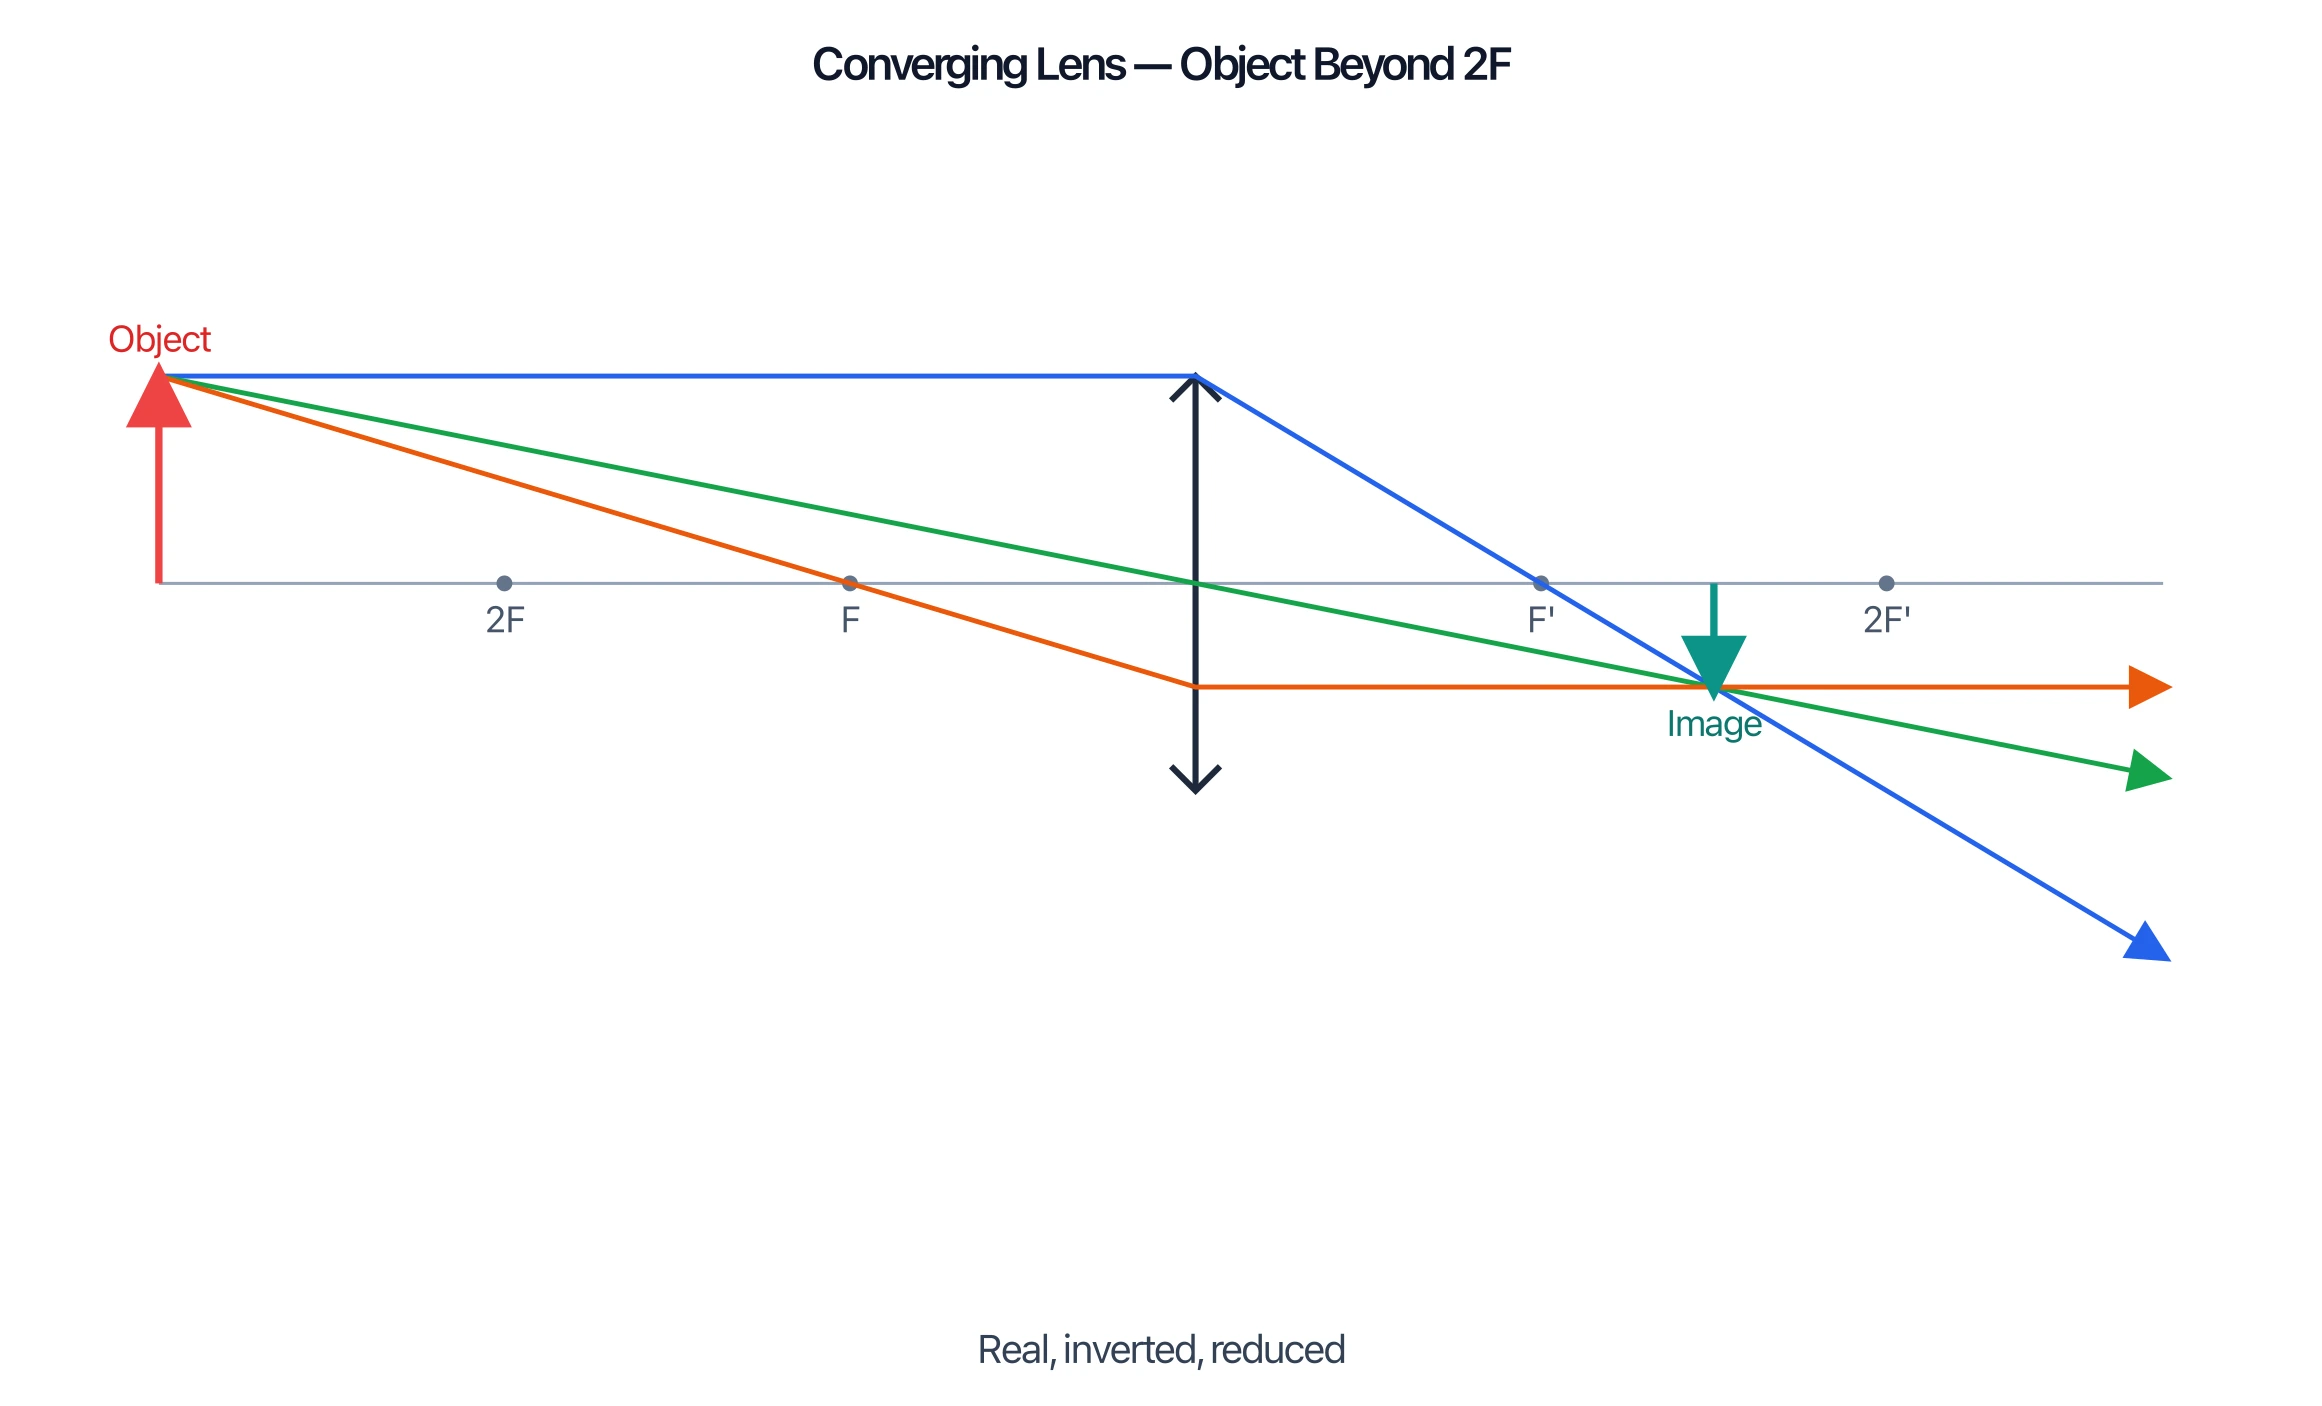
Ray Diagram: Lenses and Mirrors Explained
Learn what a ray diagram is, the principal ray rules for lenses and mirrors, real versus virtual images, and how to draw one step by step with clear examples.
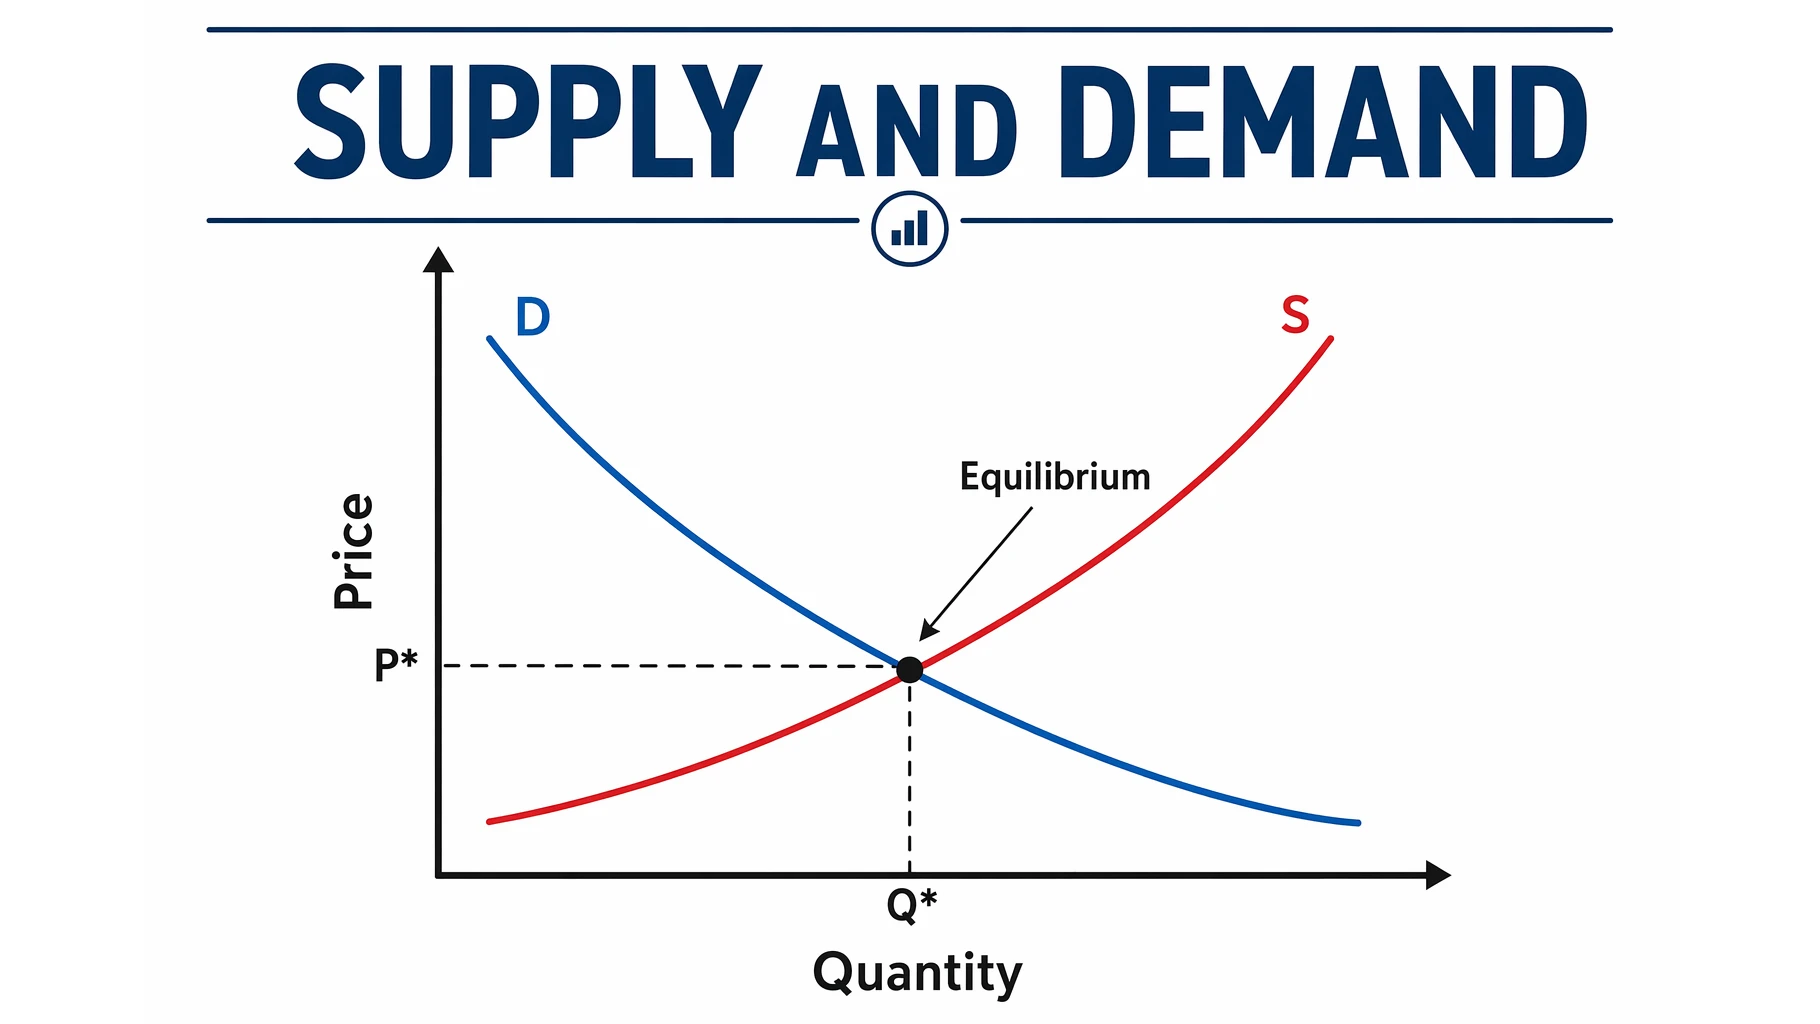
Supply and Demand Graph: Equilibrium & Shifts
Learn how to read the supply and demand graph: why demand slopes down and supply slopes up, where they meet at equilibrium, plus shifts, surplus, and shortage.
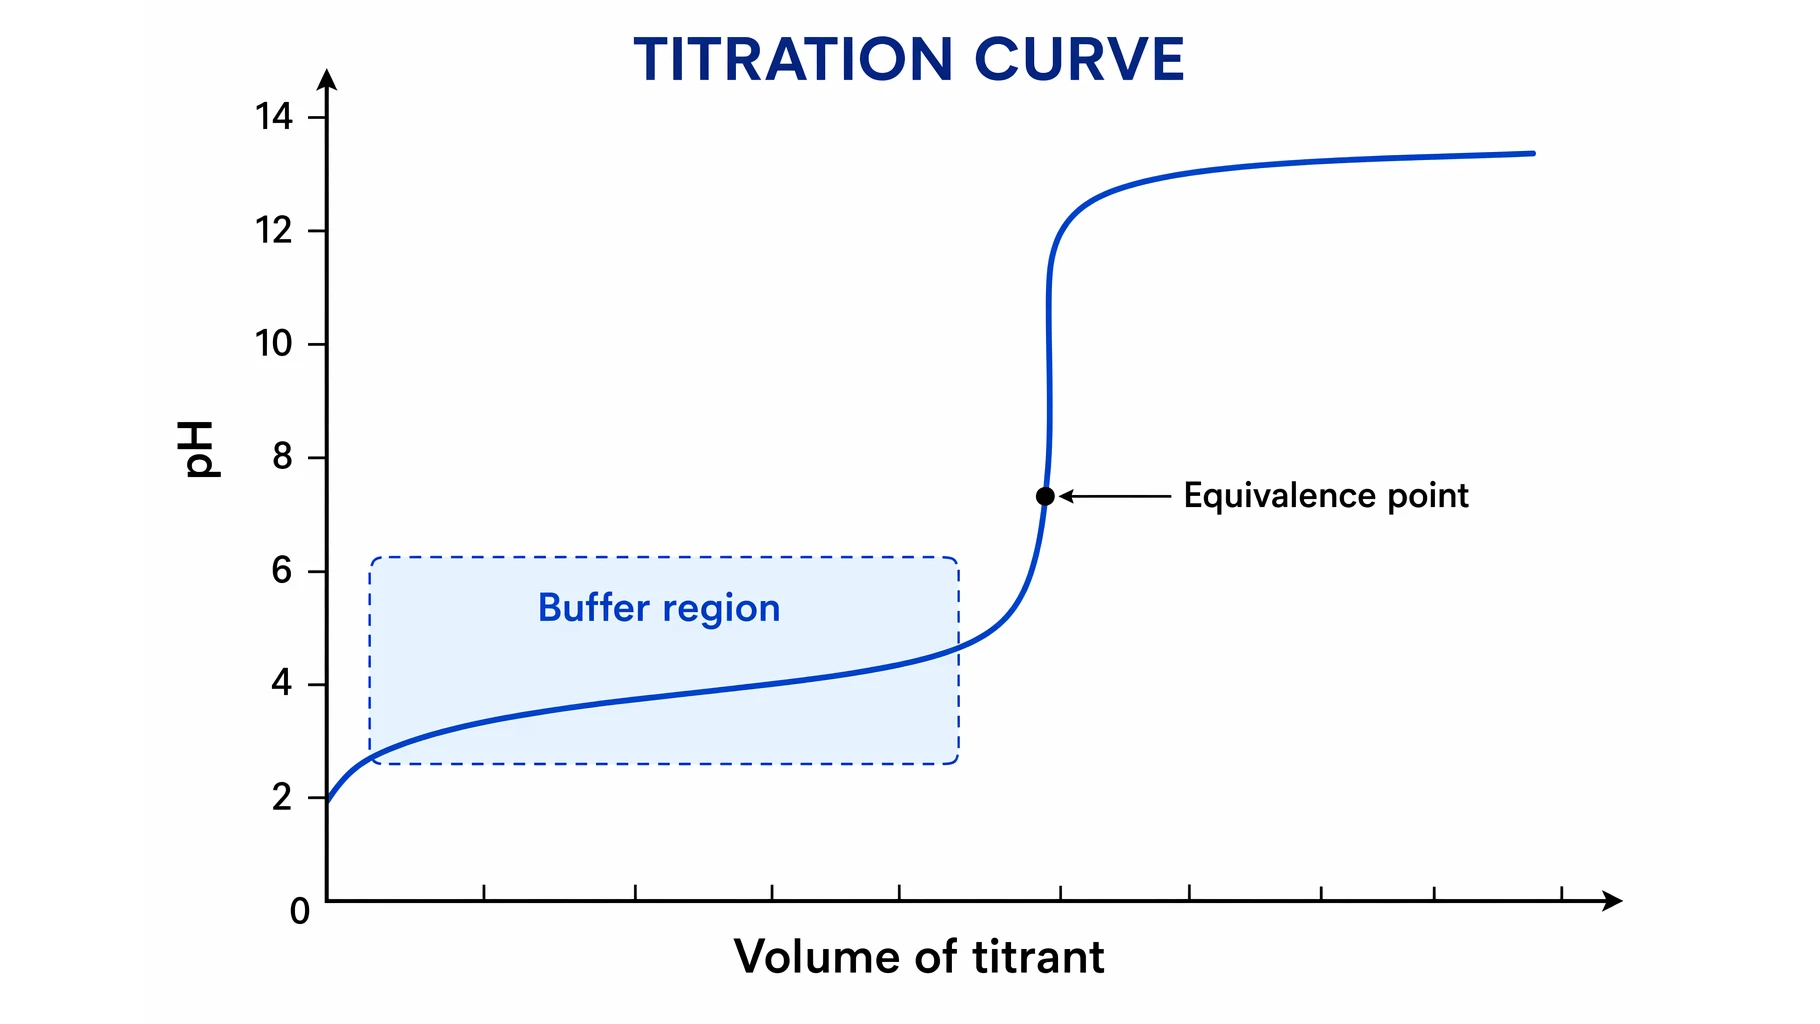
Titration Curve Explained: pH, Equivalence Point & pKa
A titration curve plots pH vs volume of titrant. Learn to read strong and weak acid curves, find the equivalence point, half-equivalence (pKa), and indicator.
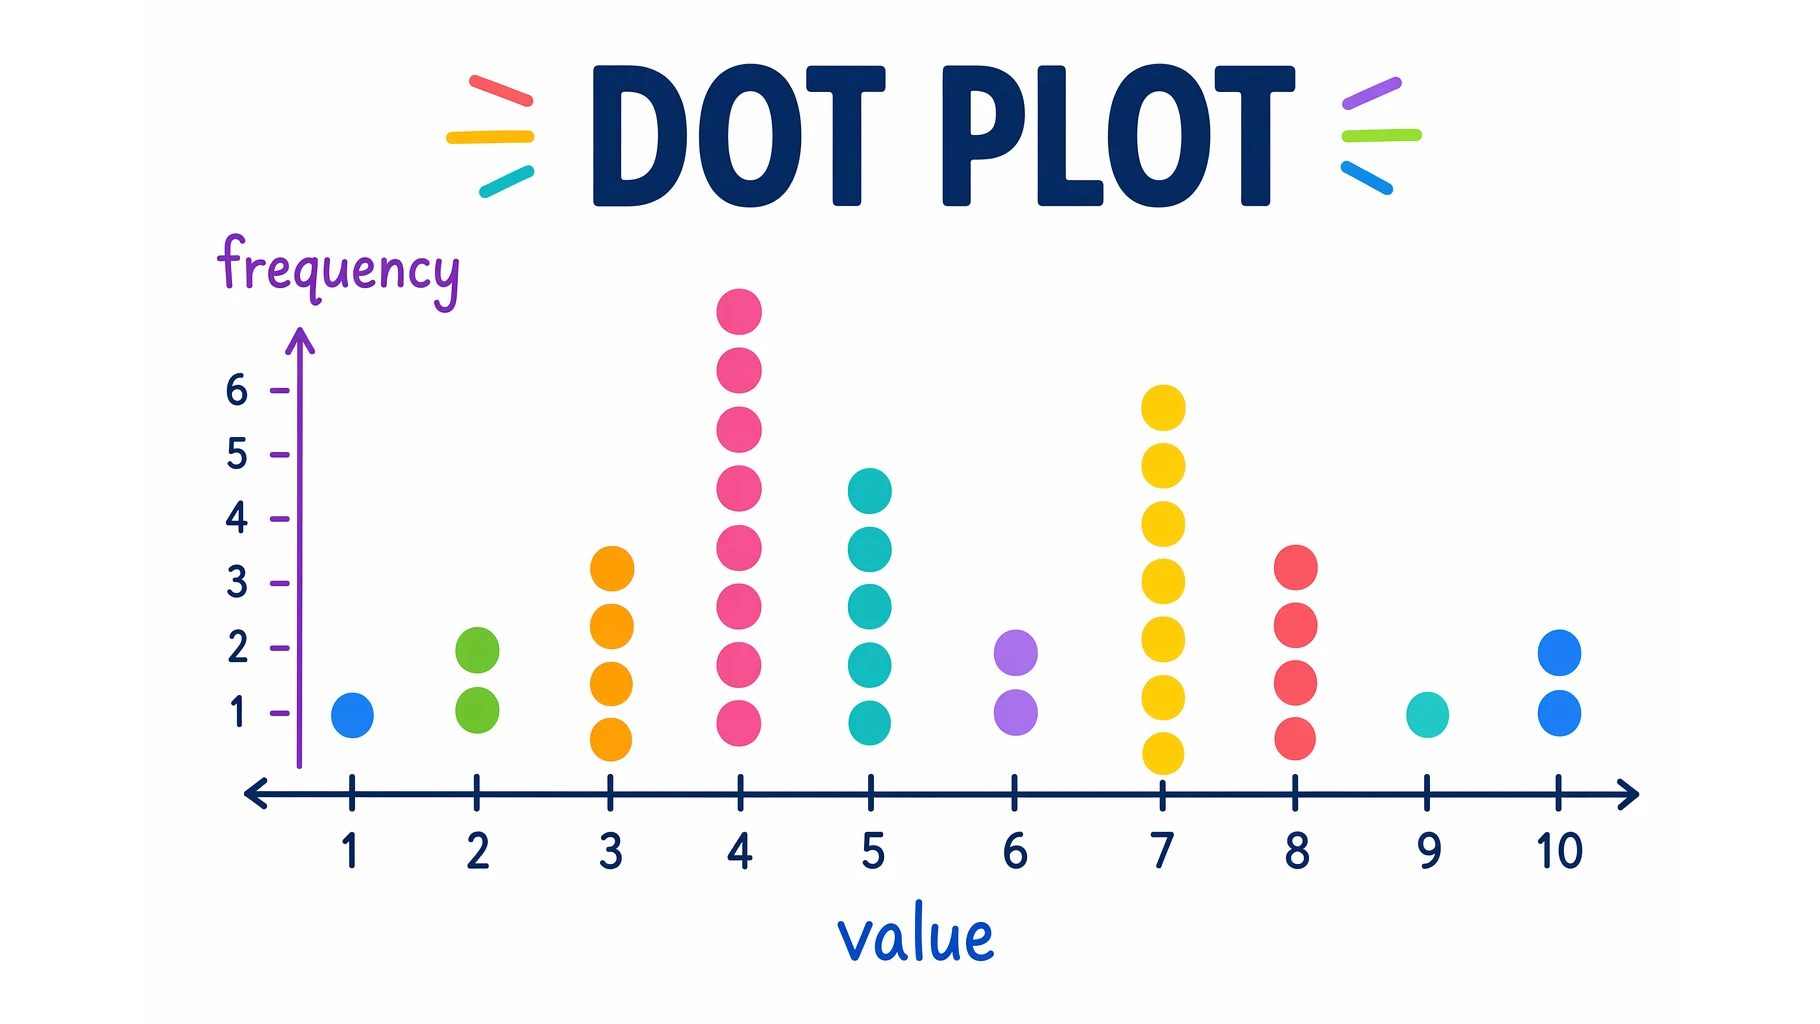
What Is a Dot Plot? Statistics Examples and How to Make One
A dot plot shows data frequency with stacked dots over a number line. Learn to make and read dot plots and find mean, median, mode, and range, with examples.
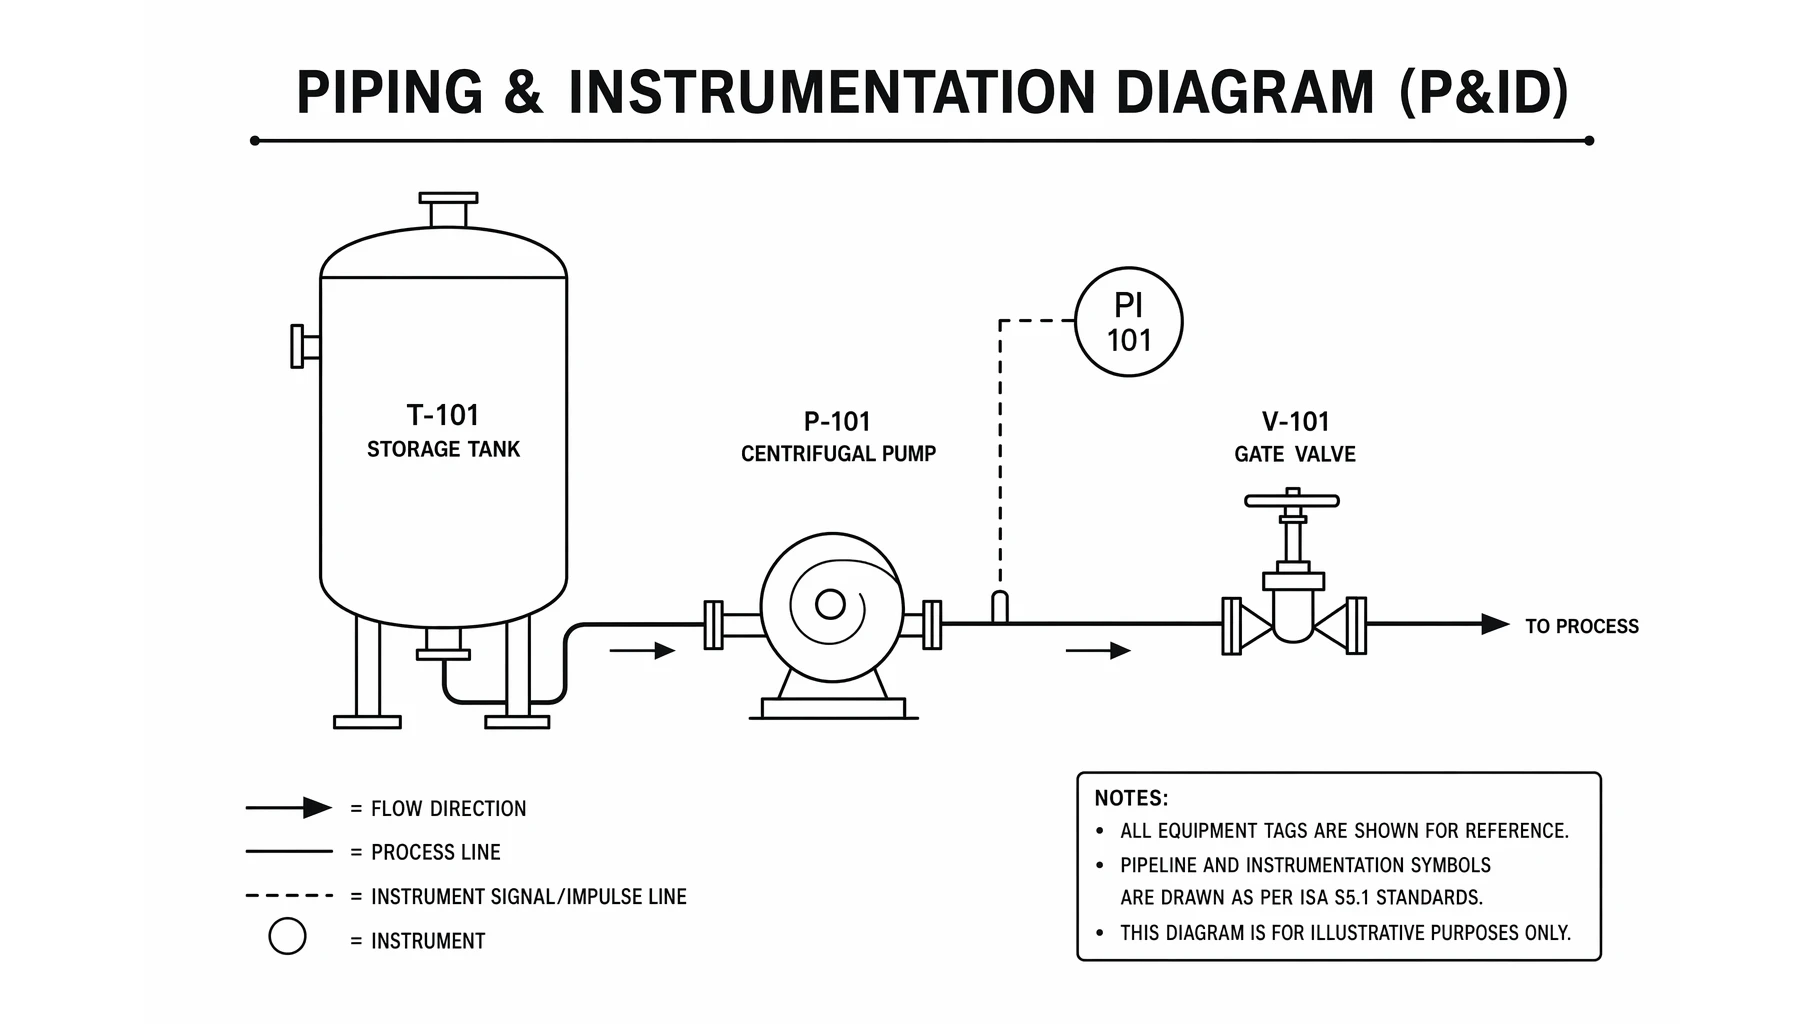
What Is a P&ID? Piping & Instrumentation Diagrams Explained
A P&ID shows every pipe, valve, and instrument in a process. Learn to read piping and instrumentation diagrams, ISA symbols, and how a P&ID differs from a PFD.
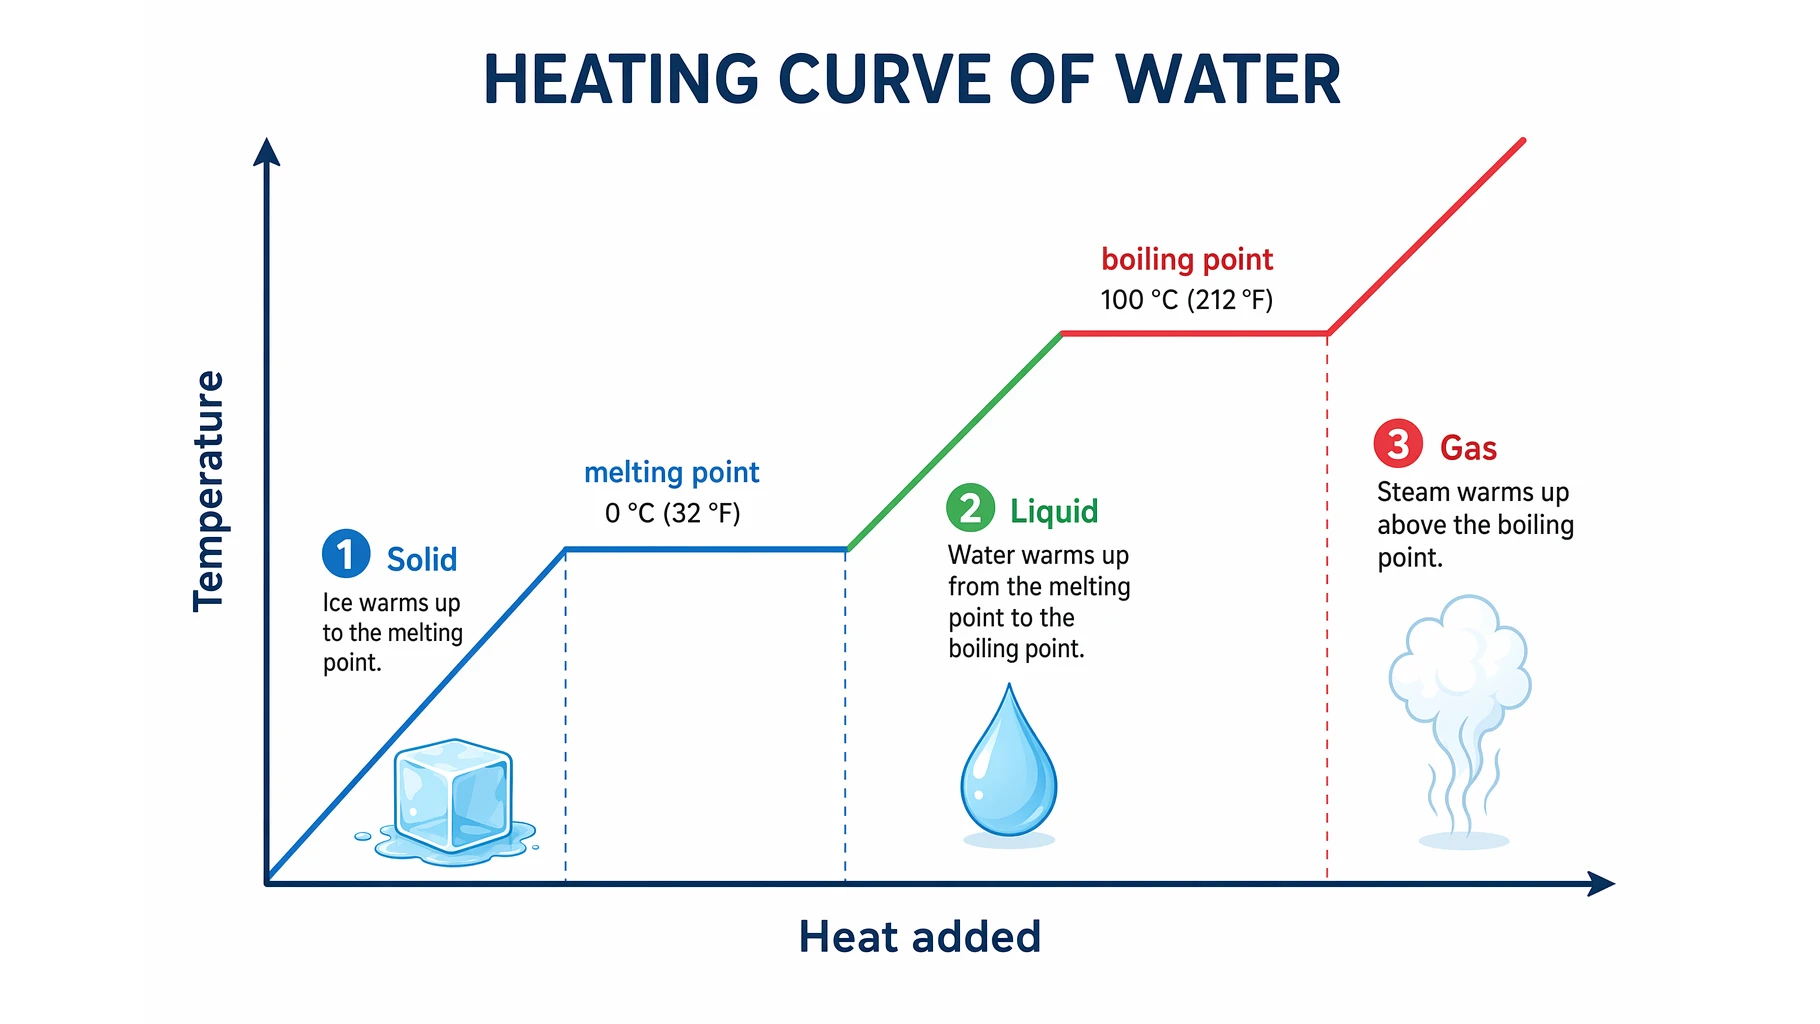
Heating Curve of Water Explained: The 5 Stages
Understand the heating curve of water step by step: what the axes mean, why the plateaus are flat, and how specific and latent heat shape each stage.