Blog
Teaching tips, tool comparisons, and science diagram guides for STEM educators. Create better classroom materials with AI-powered diagram generation.
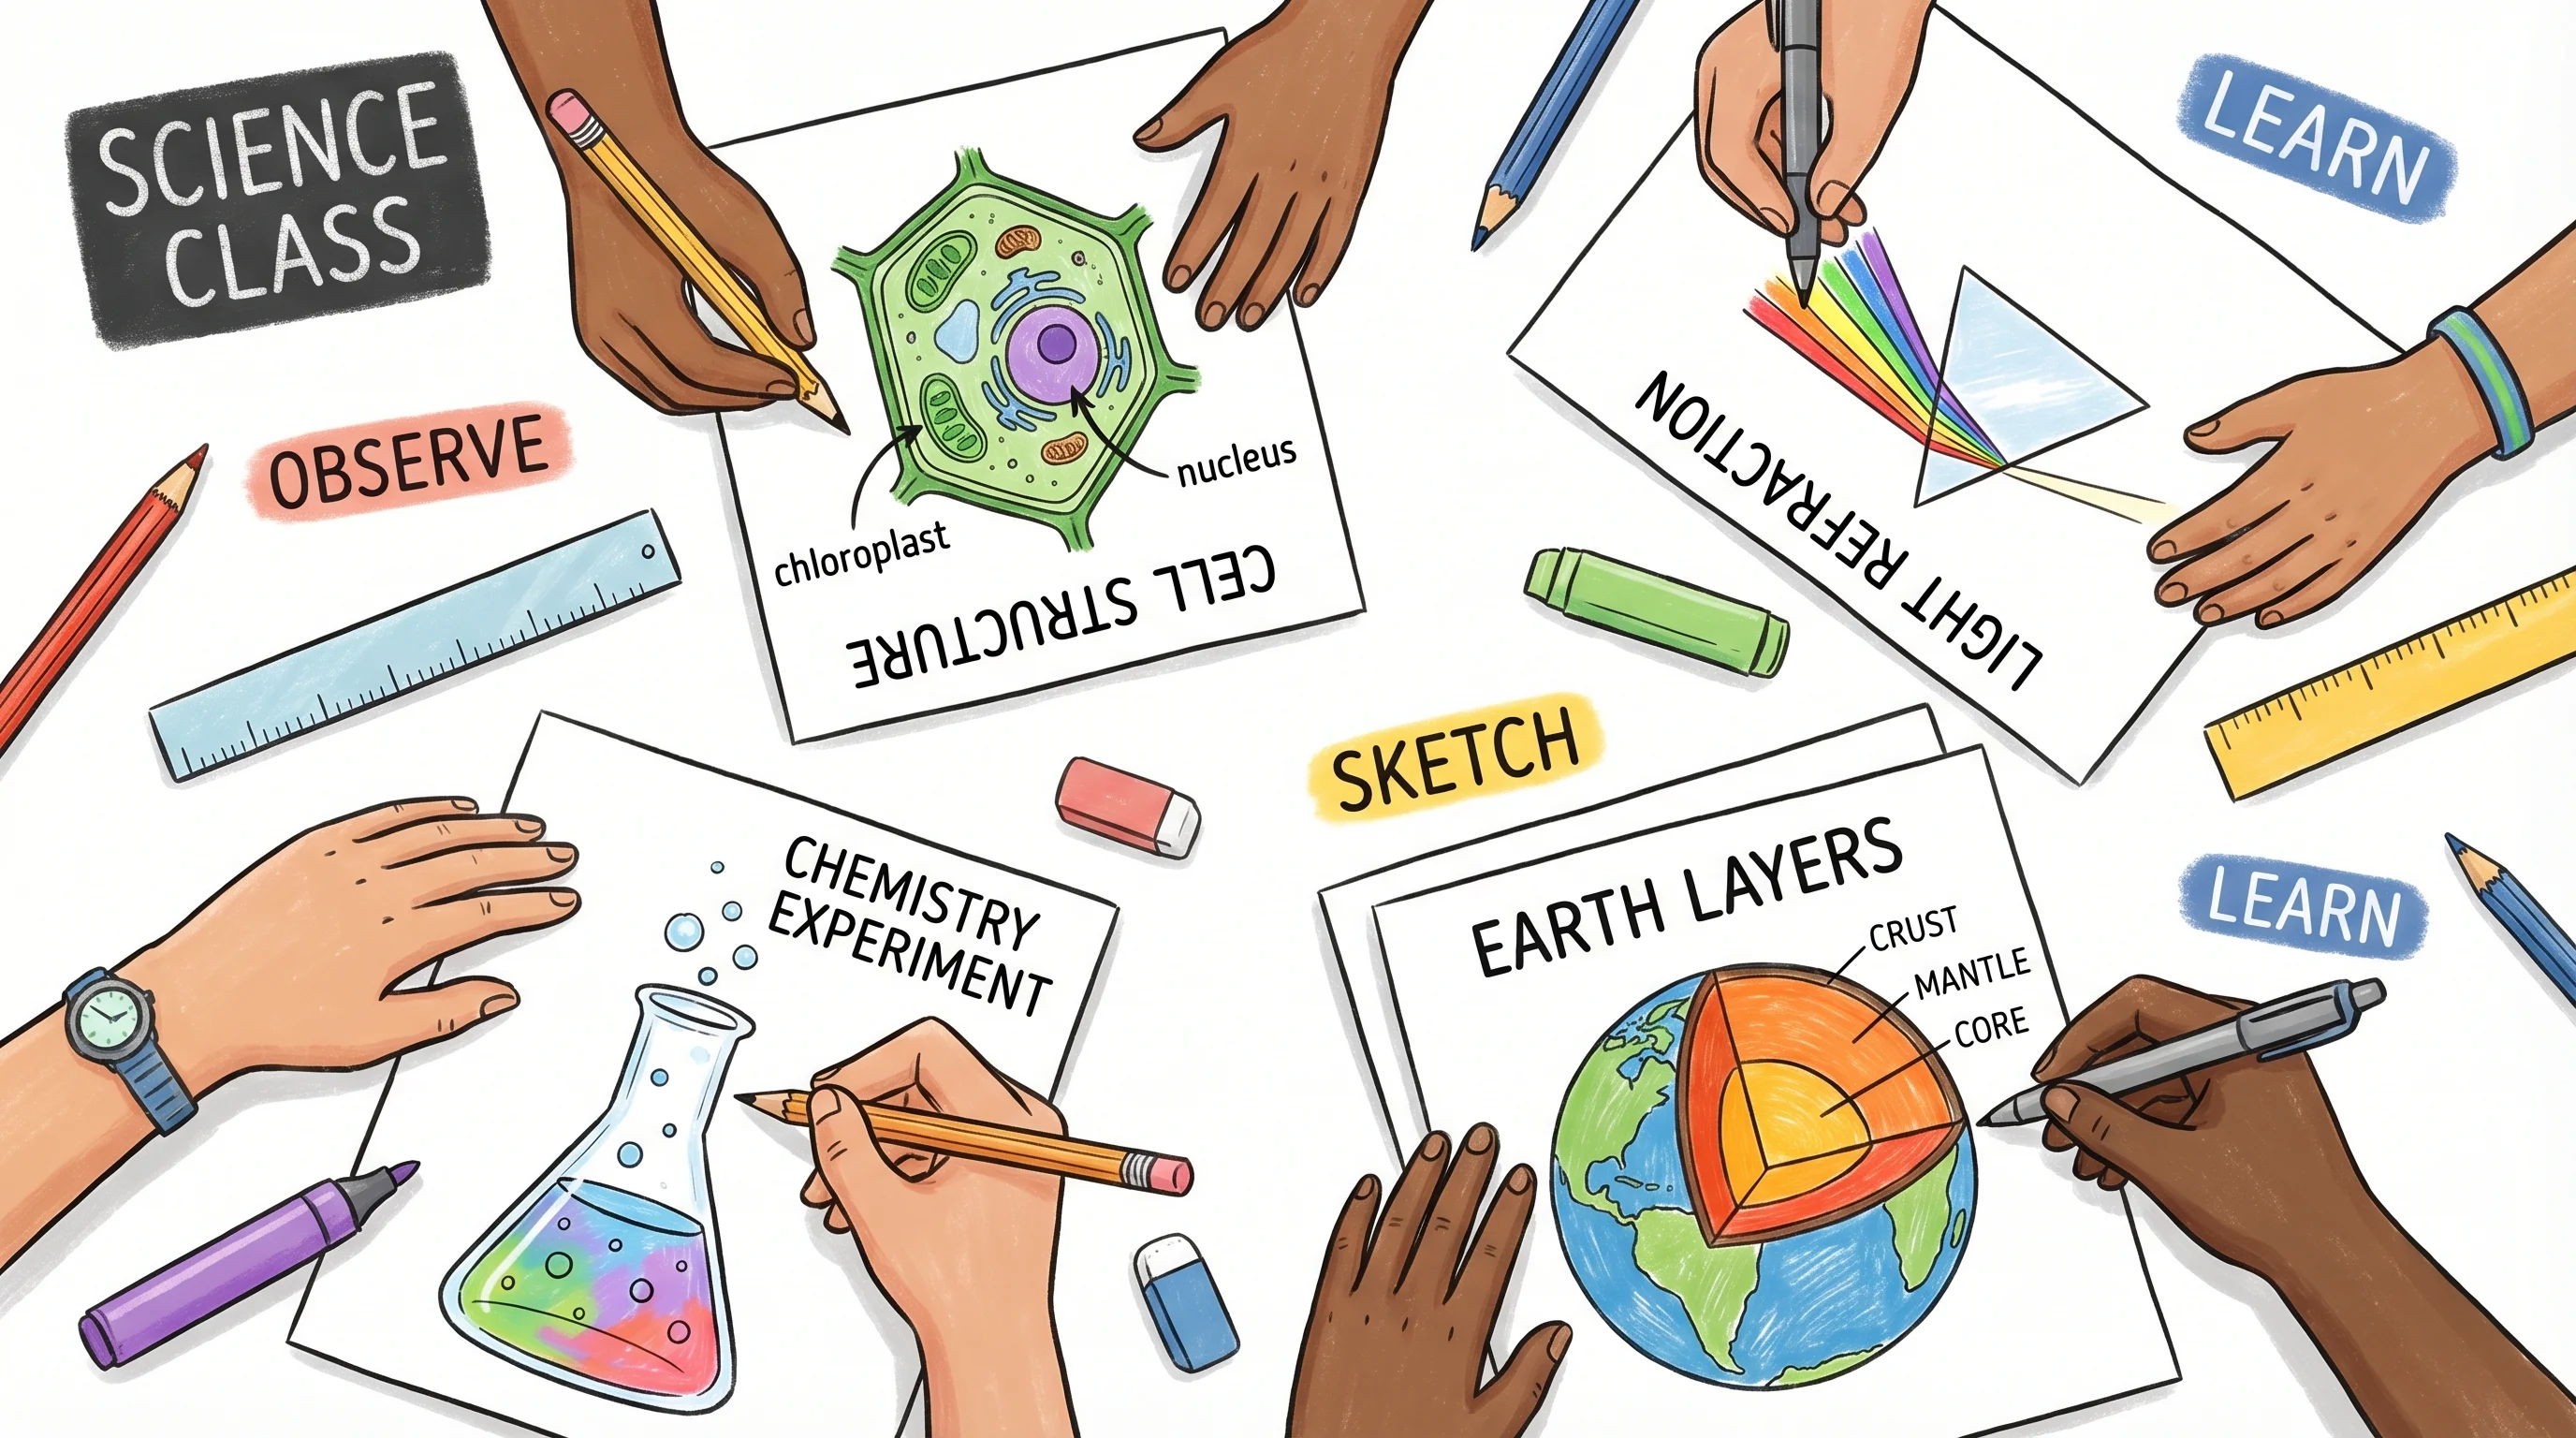
How to Create Science Drawings: Easy Step-by-Step Guide
Learn how to create clear, labeled science drawings for biology, chemistry, and physics class. A step-by-step guide with tips, examples, and free AI tools.
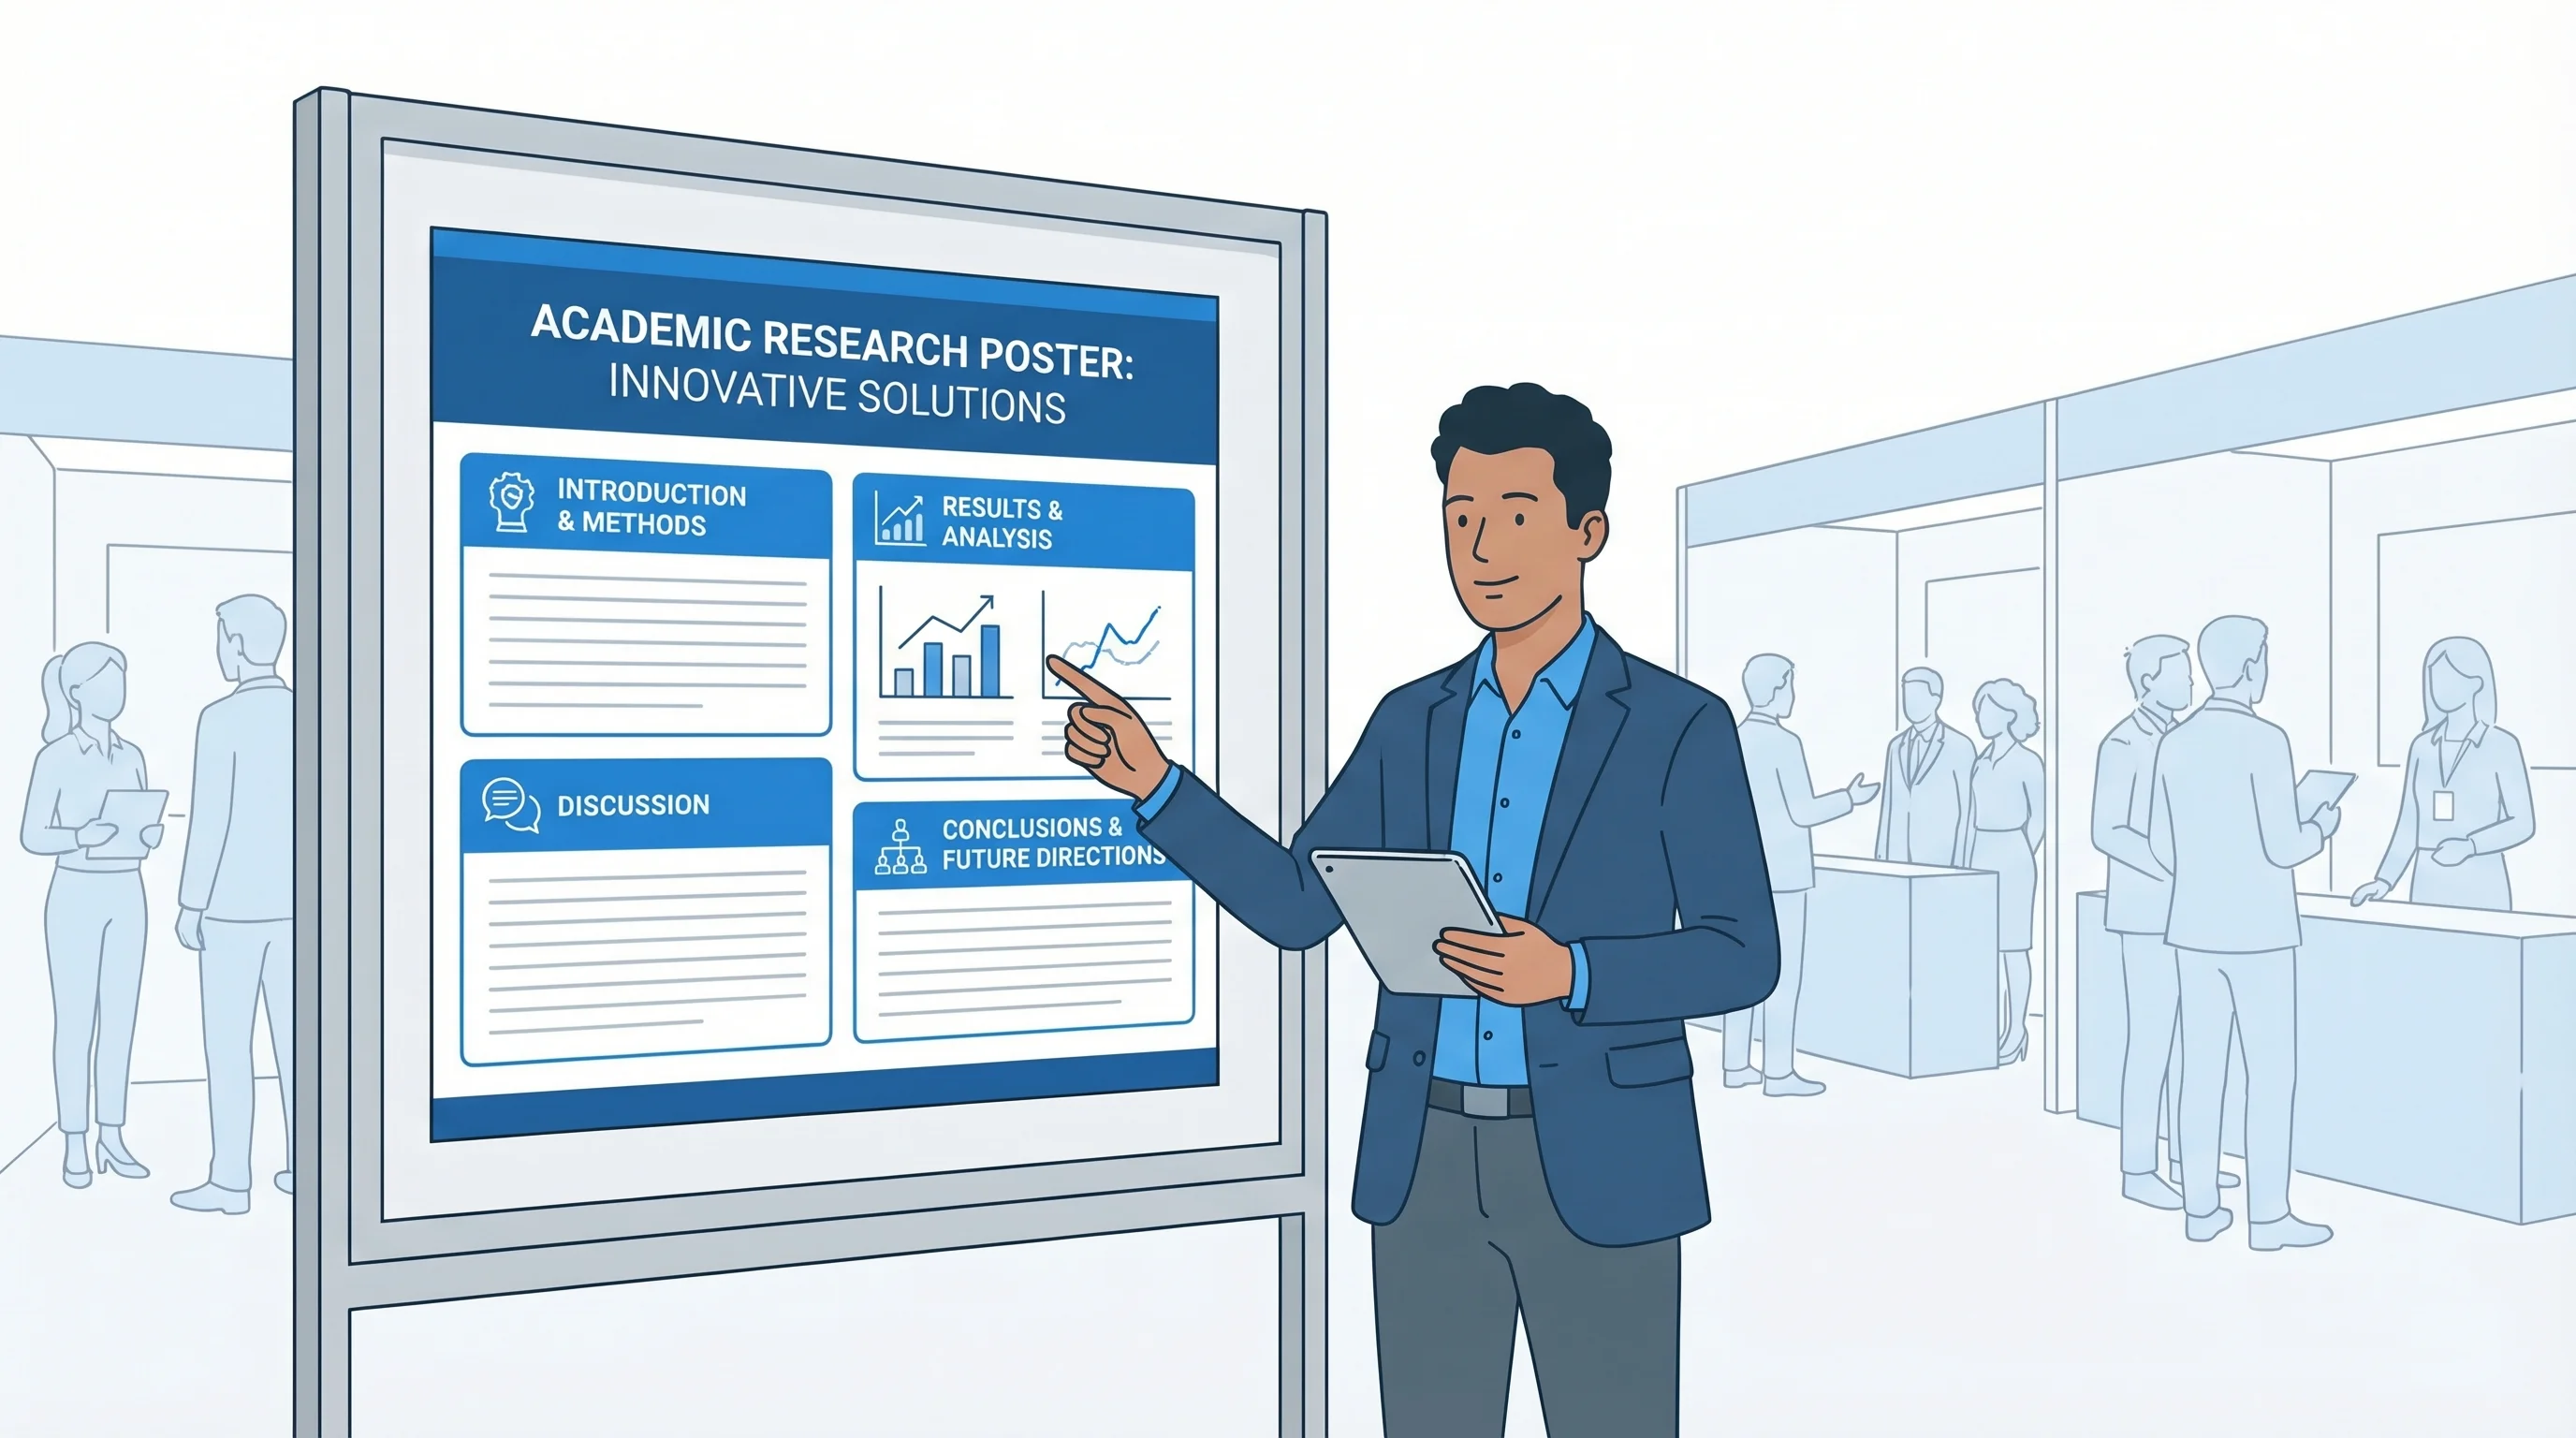
PhD Poster Design Guide: How to Create a Winning Poster
Complete guide to designing PhD conference posters that stand out. Learn layout, typography, and color schemes, and use free AI tools to build research posters.
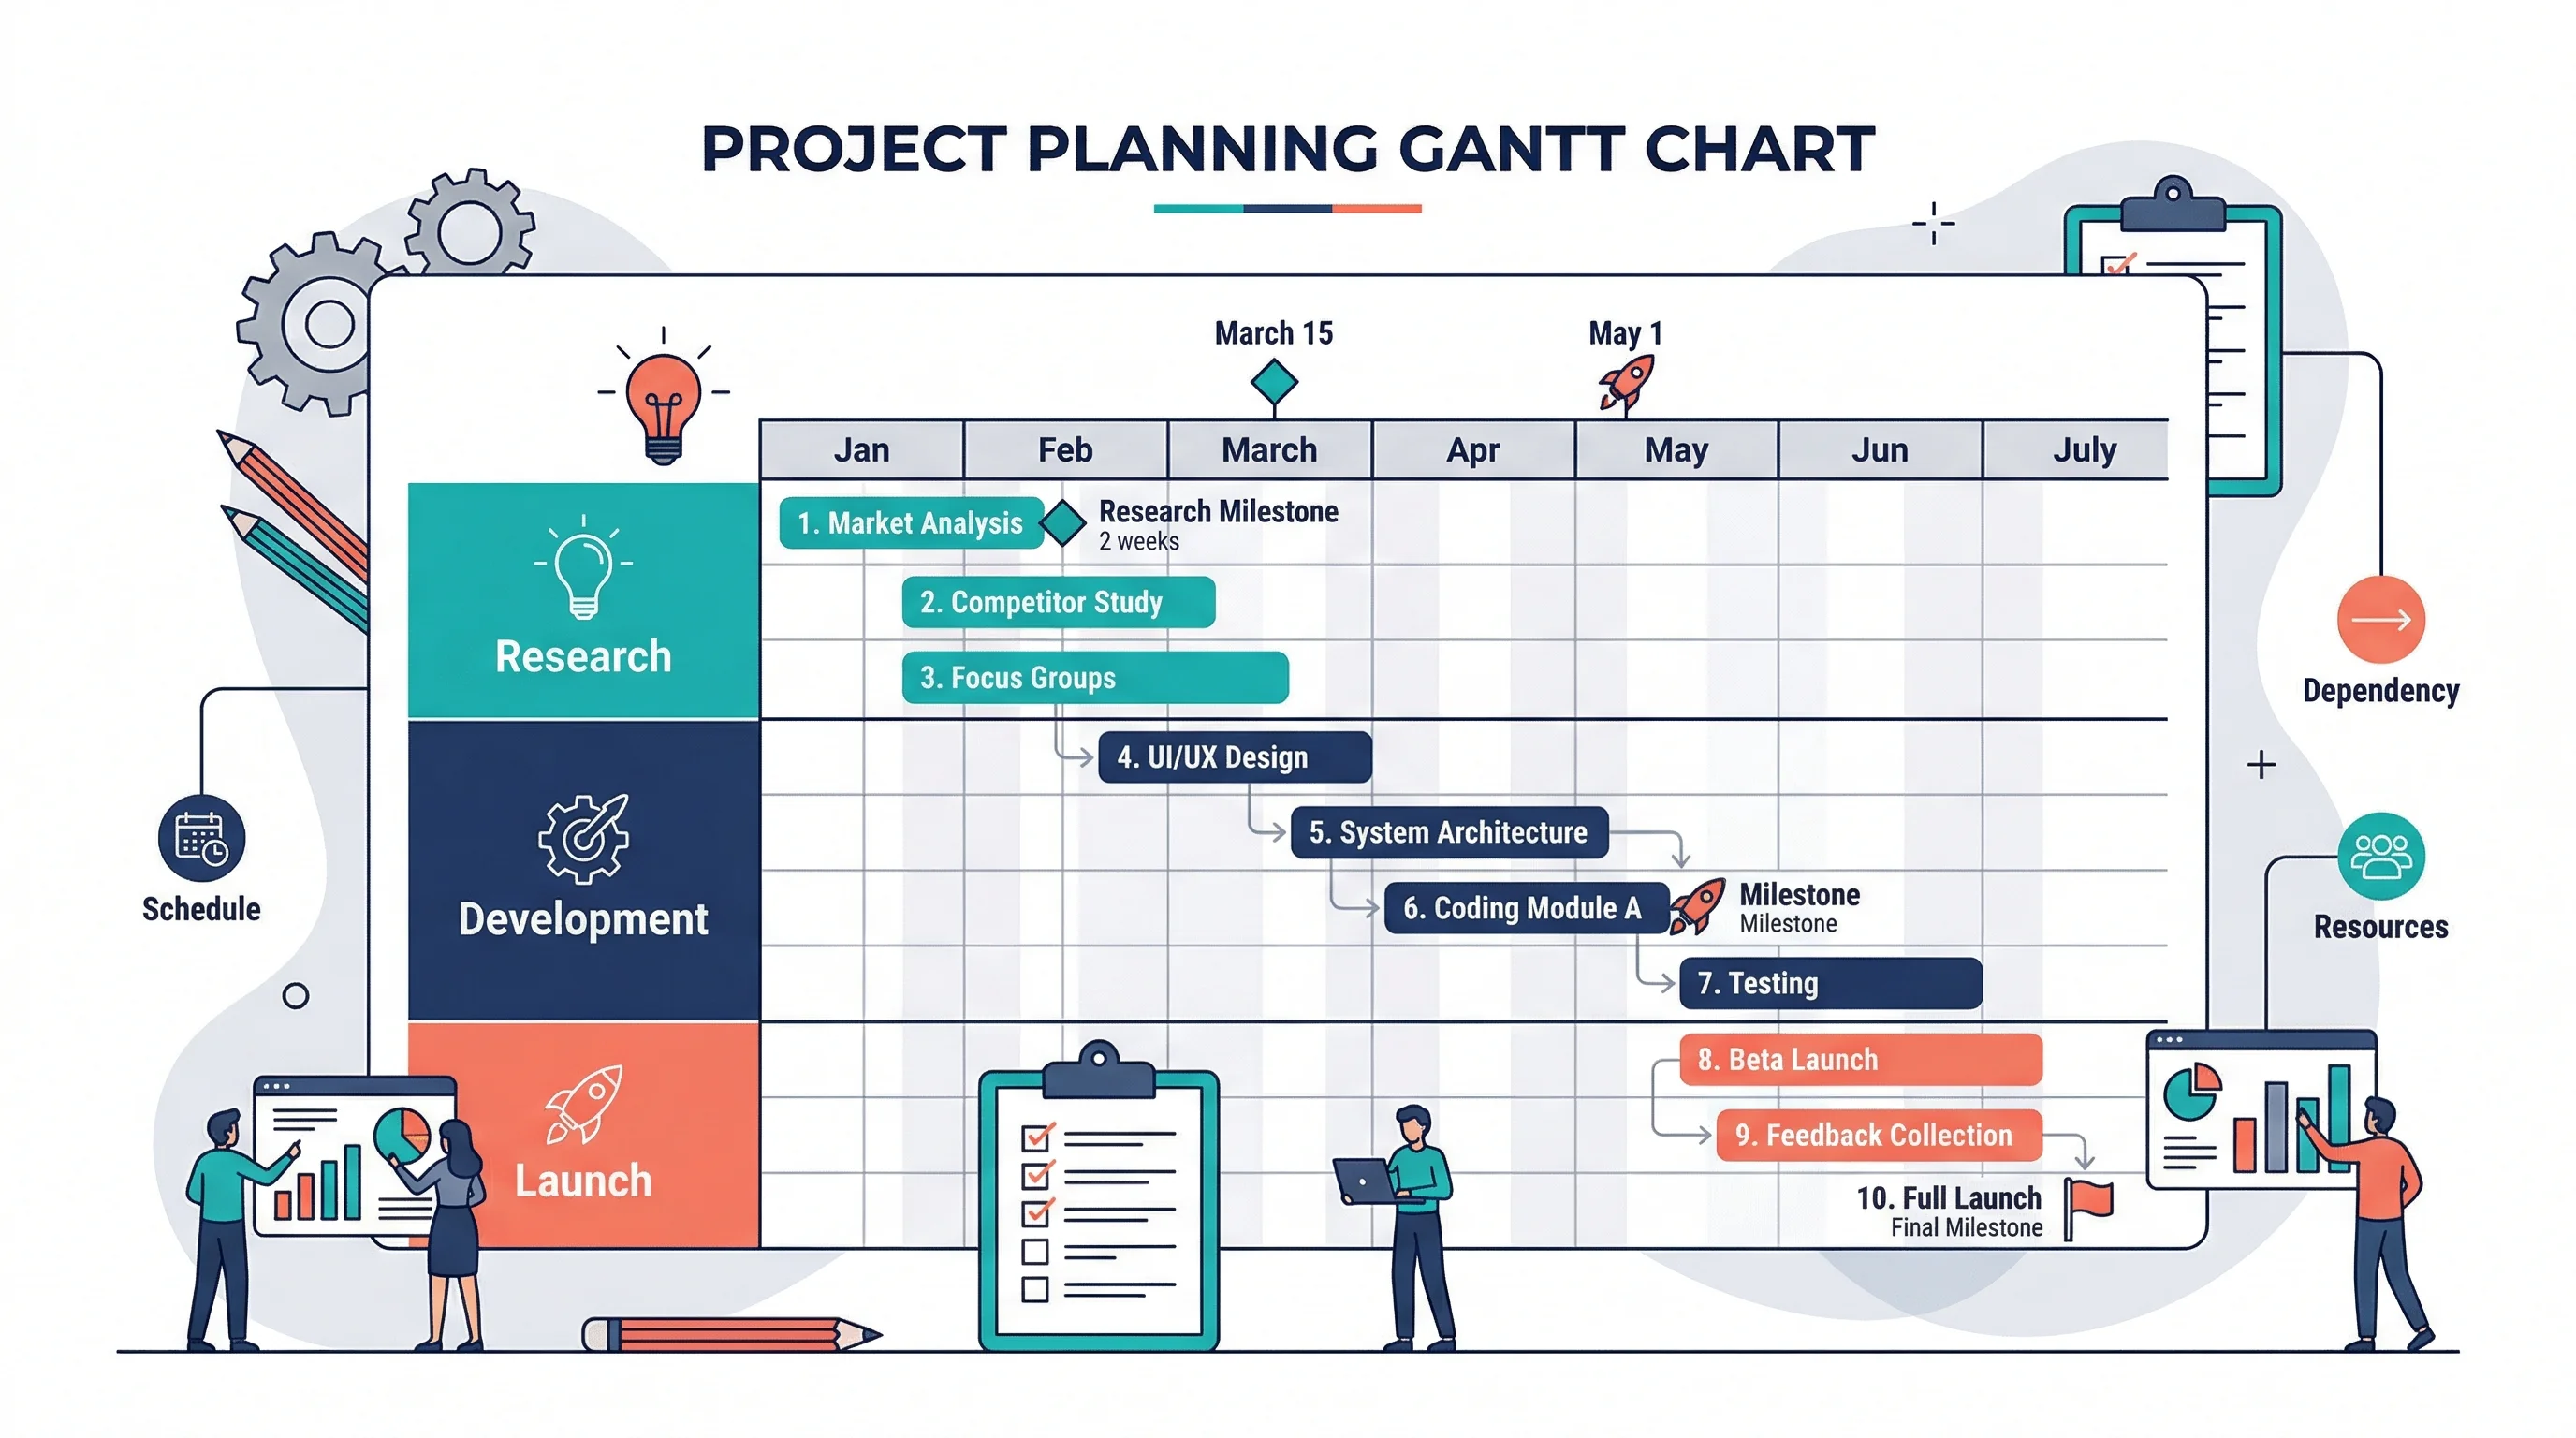
How to Make a Gantt Chart: Step-by-Step Guide
Learn how to make a Gantt chart for project plans, research schedules, and launch timelines. Covers Excel, common mistakes, and when to use timeline tools.
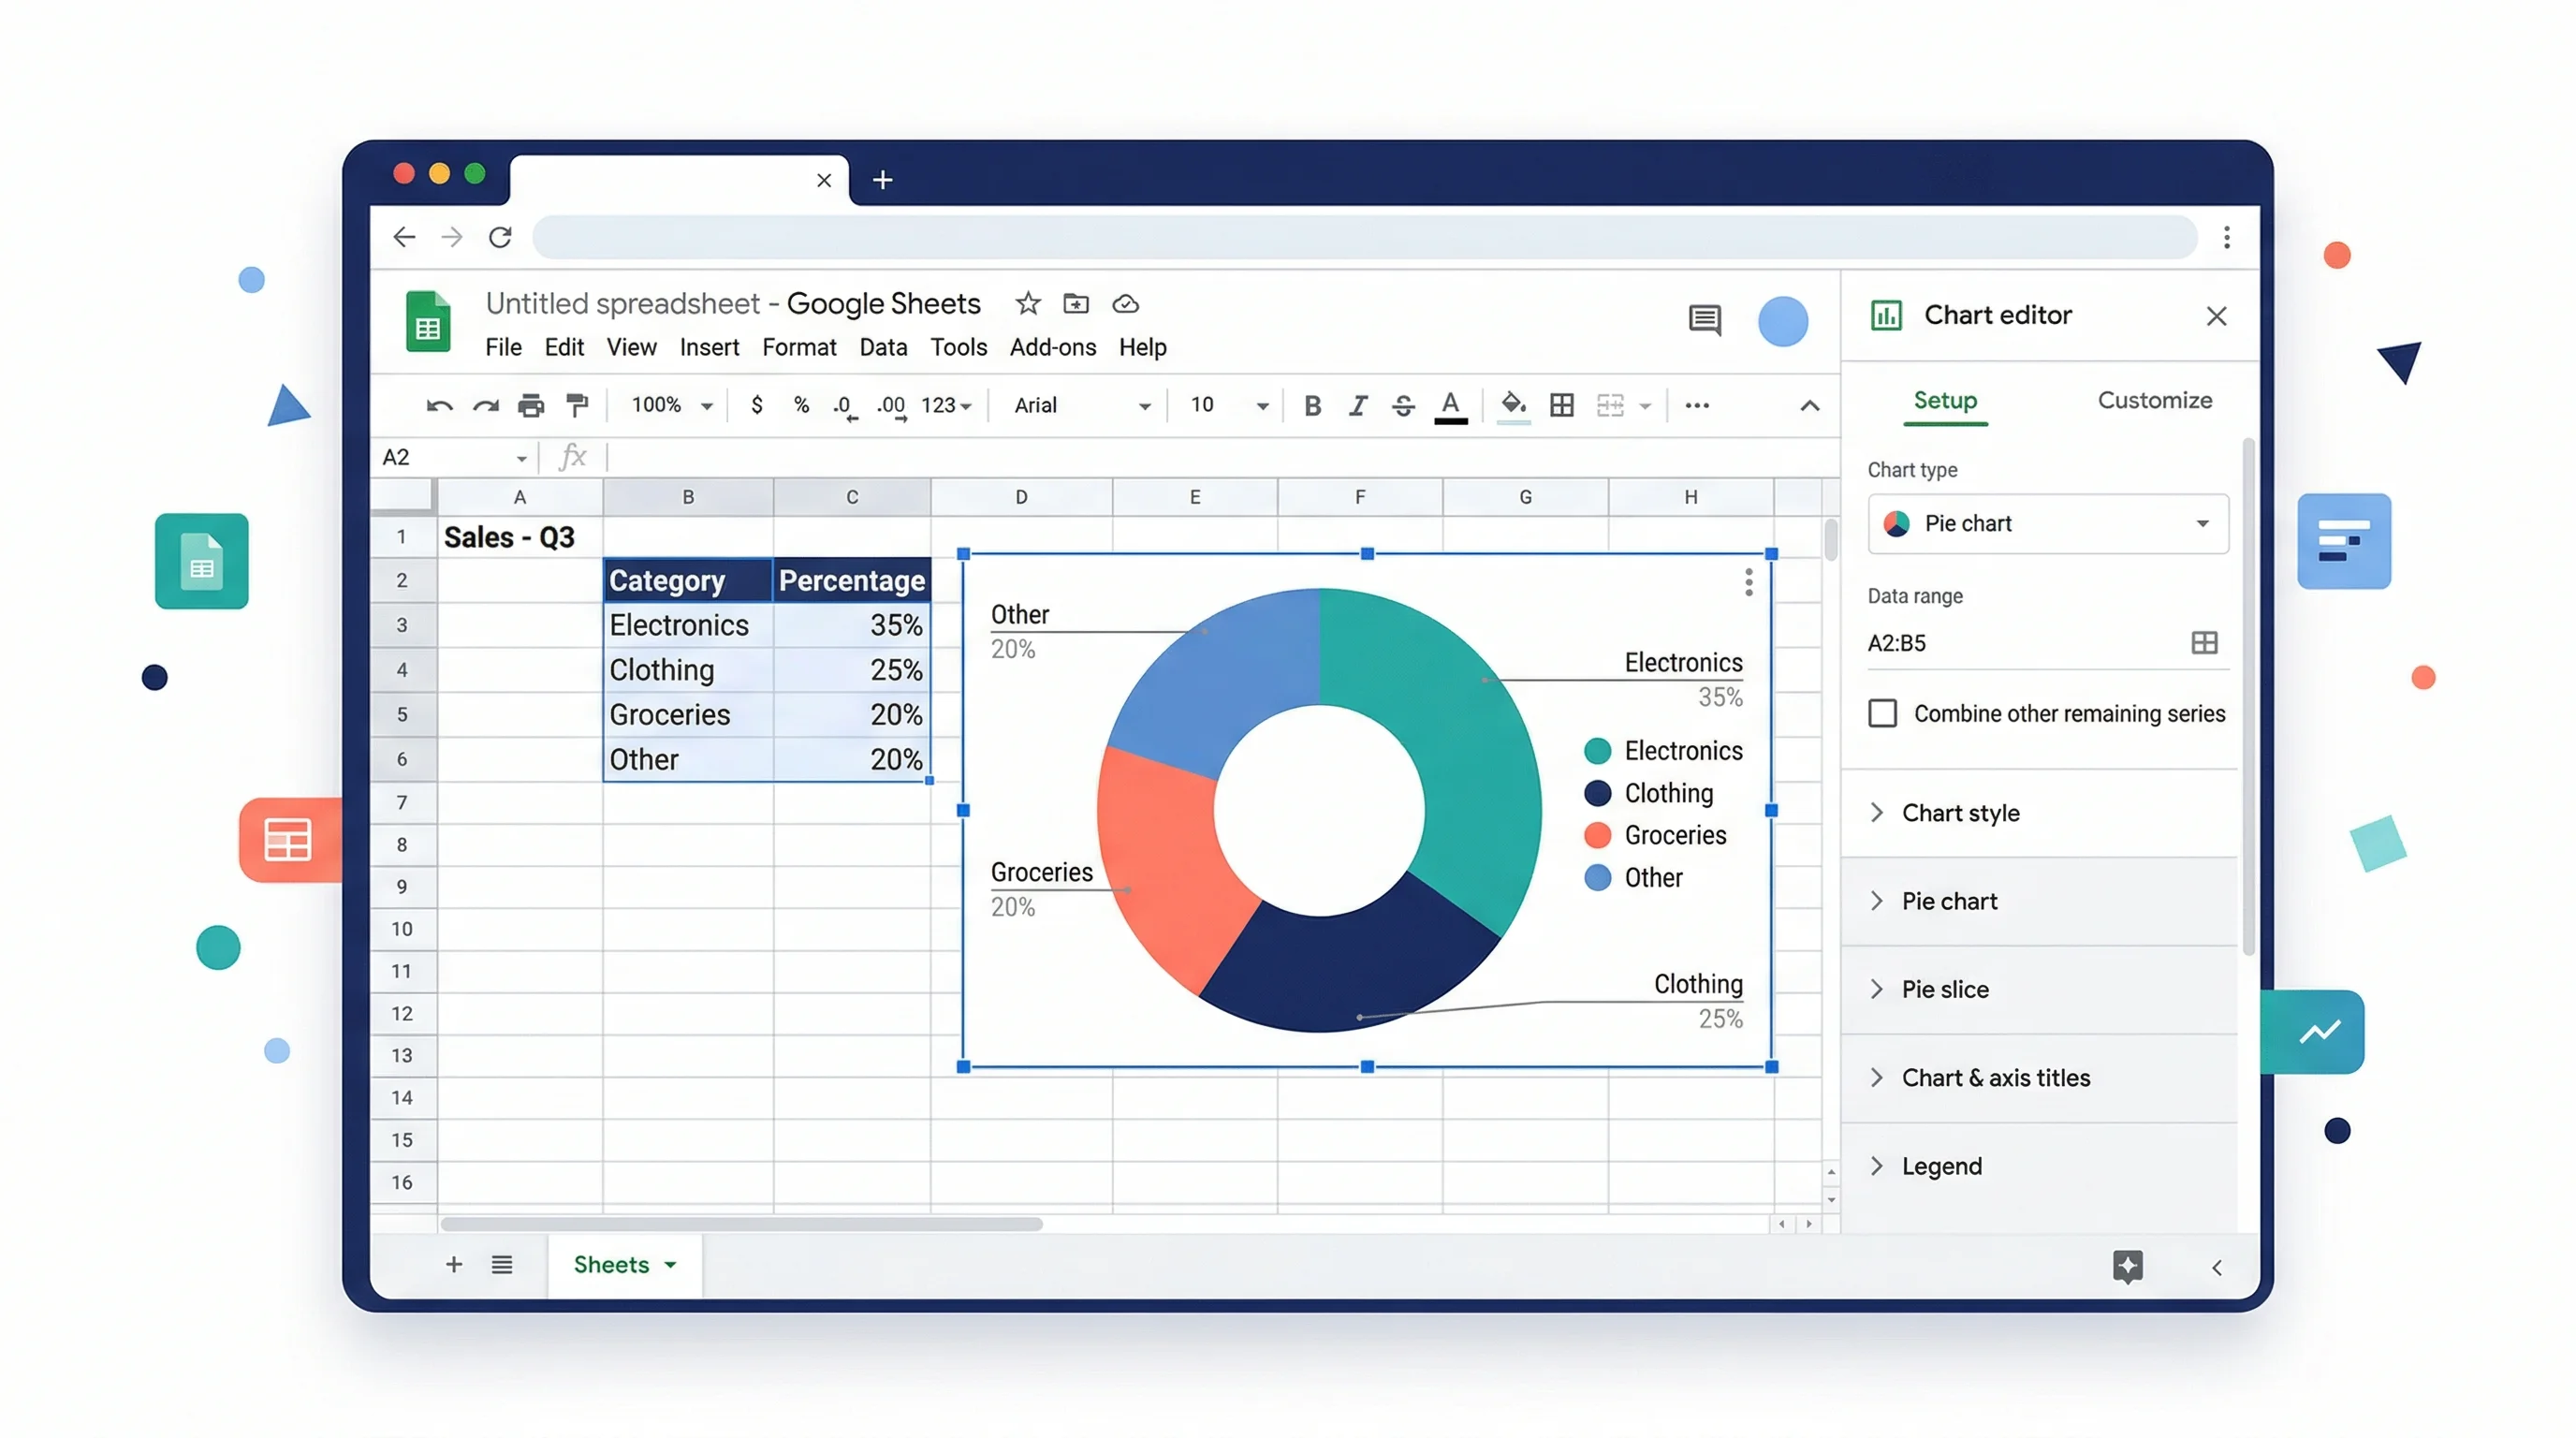
How to Make a Pie Chart in Google Sheets: Step-by-Step
Learn how to create a pie chart in Google Sheets, summarize messy data, format labels, customize slices, and avoid misleading charts, with official help links.
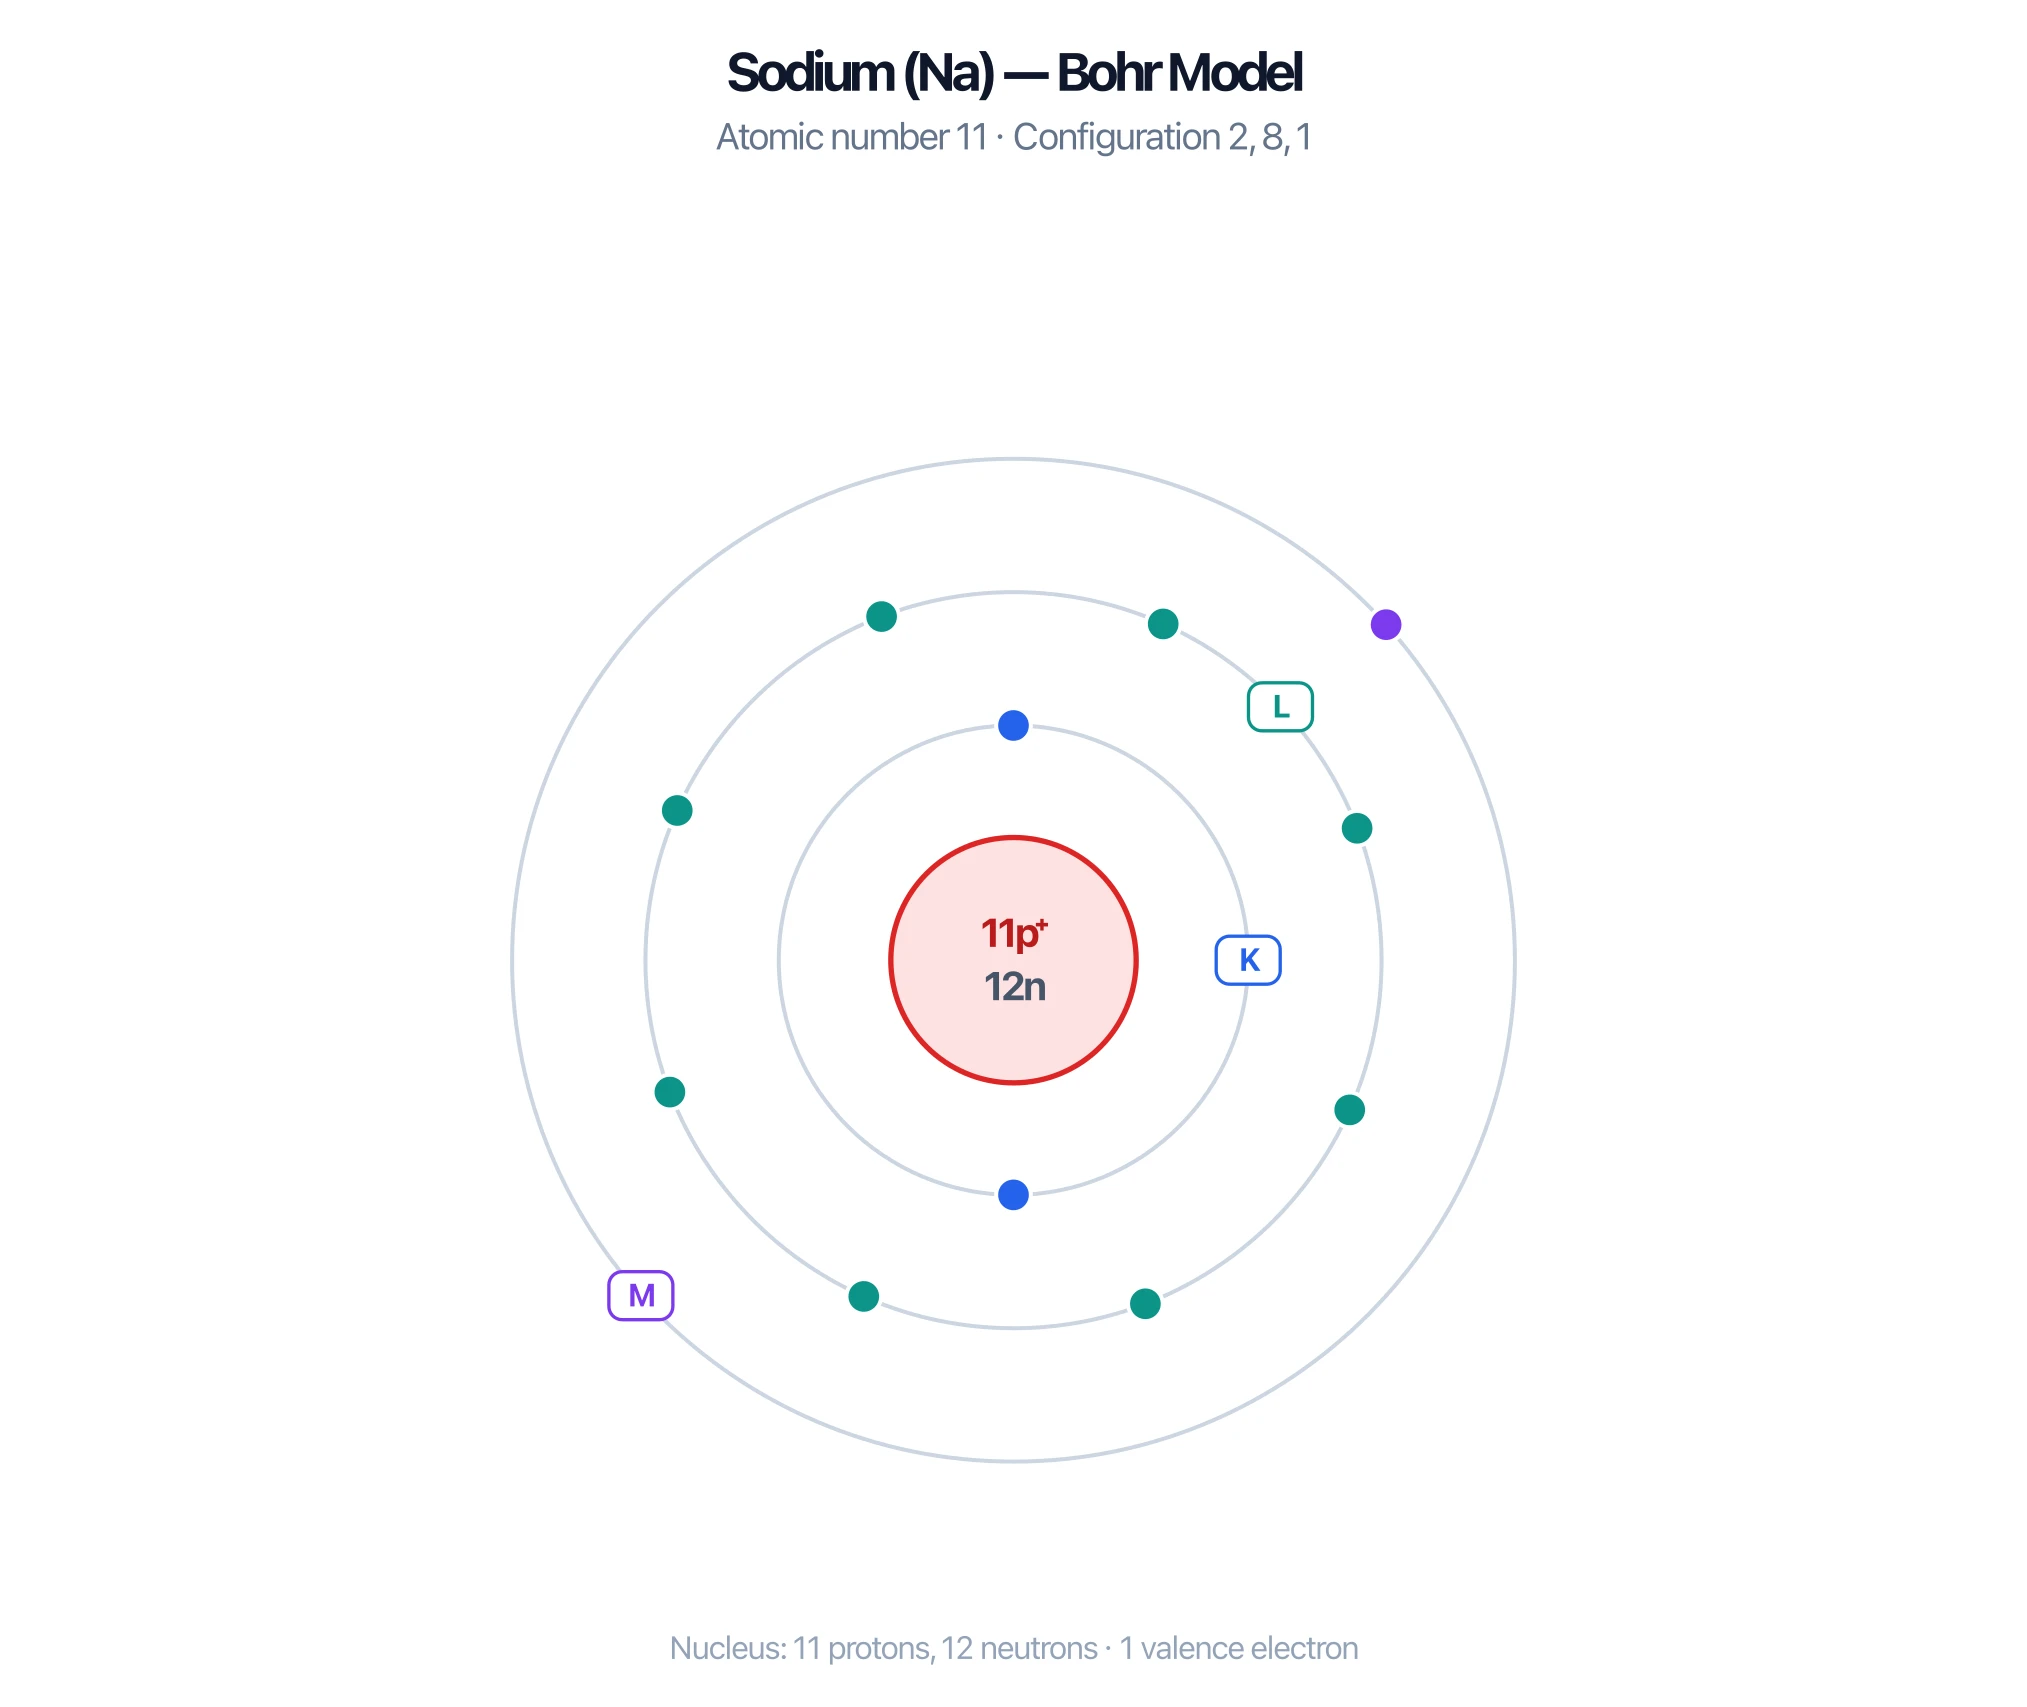
How to Make a Bohr Model: Step-by-Step Guide for Students
Learn how to draw a Bohr model for any element. Covers electron shell rules, common elements, mistakes to avoid, and where Bohr models break down.
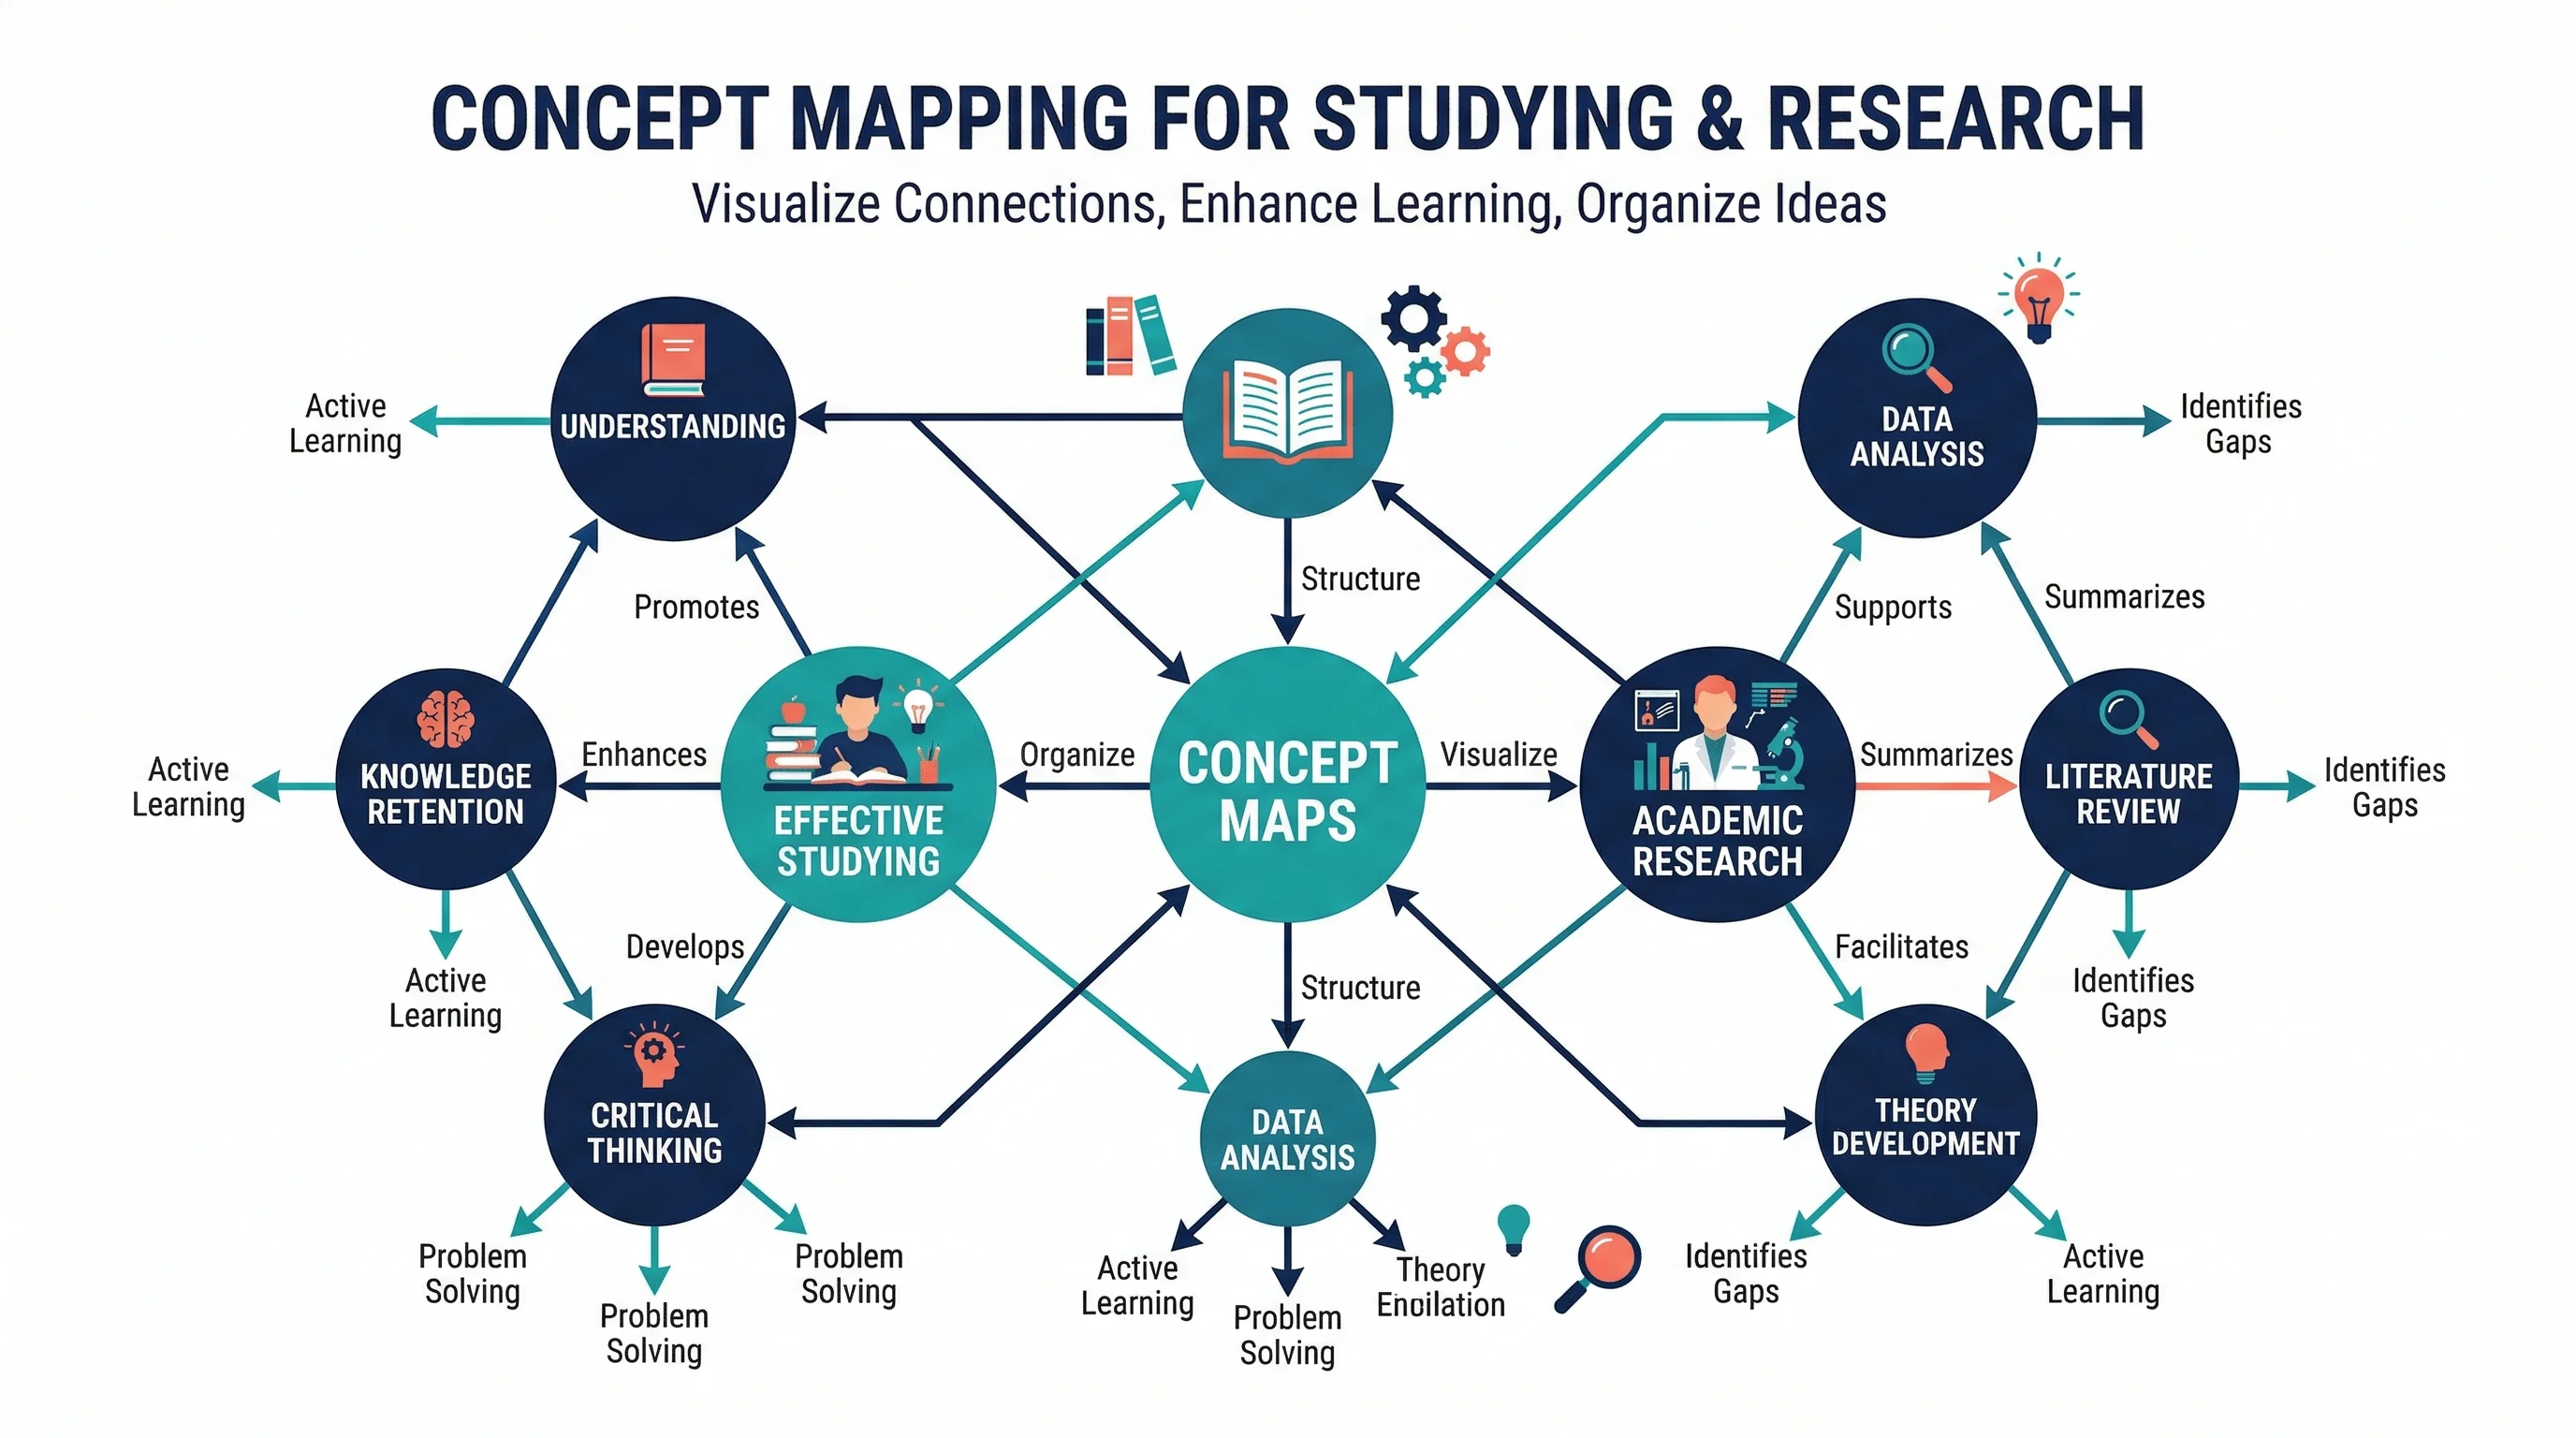
How to Make a Concept Map: Step-by-Step Guide
Learn how to make a concept map for research papers, studying, and brainstorming. Covers structure, linking phrases, tools, and common mistakes, with examples.