AI Infographic Generator from Text or Your Data
Free AI infographic generator: describe a topic or paste your key points and data, and AI turns them into a polished infographic image in seconds. Great for reports, social posts, lessons, and marketing — no design skills needed.
AI Infographic Generator
Free to try ·
Your infographic will appear here
Describe your infographic and click Generate
AI Infographic Examples
Data summaries, processes, timelines, and comparisons generated from a prompt
Market Analysis Infographic
Turn market figures and key points into a polished business graphic — charts, stats, and trends laid out for you.
Process & Workflow
Describe a process and AI renders it as a clean step-by-step flow with arrows and icons.
Comparison Infographic
Side-by-side comparisons become a single visual with stat cards and a themed color palette.
Timeline Infographic
Give AI your milestones and it builds a left-to-right timeline that tells the story.
Framework Infographic
Frameworks and models render as structured diagrams — here a five-stage security framework on a dark theme.
Educational Infographic
Explain a concept visually — cause-and-effect chains and science topics work well for lessons and posts.
What is an AI infographic generator?
An AI infographic generator turns a written description into a finished infographic image. Instead of dragging boxes and aligning charts in a design tool, you describe the topic and the key points or data you want to show, and the AI lays everything out — headings, icons, stat callouts, chart-style visuals, and a coherent color theme — into a single polished graphic. This tool is built for exactly that: type what you want, click generate, and you get a high-resolution infographic you can download and share, with no design skills required.
How to make an infographic with AI
- Describe your topic in plain English — for example "5 ways to reduce your carbon footprint" or "Q3 sales results for the marketing team".
- Add the key points or data you want included: stats, steps, comparisons, or a short list. The more specific you are, the more accurate the result.
- Choose a style and a shape — pick an aspect ratio for Pinterest, Instagram, a story, or a slide, and mention a look such as modern, corporate, colorful, or minimal.
- Click generate, review the image, and tweak your prompt or regenerate until it looks right — then download the high-resolution infographic.
Turn your data and key points into a visual story
Good infographics are not just decoration — they tell a story with data and structure. When you list your numbers, steps, or comparisons in the prompt, the AI organizes them with visual hierarchy: the most important figure gets the most weight, related points are grouped, and the eye is guided from top to bottom. You describe the data and key takeaways in words and the AI handles the layout and visual storytelling, which is the slow, fiddly part of making an infographic by hand. For exact, audited charts you would still build the numbers in a chart tool; here the strength is fast, on-brand visual communication.
What you can use AI infographics for
- Education: explain a concept, process, or timeline for a lesson, study sheet, or classroom poster.
- Marketing: produce on-brand graphics for landing pages, ads, blog posts, and email campaigns quickly.
- Reports & business: summarize survey results, KPIs, market analysis, or quarterly numbers into one shareable visual.
- Social media: create scroll-stopping, ready-to-post infographics sized for Pinterest, Instagram, LinkedIn, and stories.
Tips for a better infographic prompt
The quality of an AI infographic depends heavily on the prompt. Name the infographic type (statistics, process, timeline, comparison, or list) so the AI picks the right layout. Include the actual content — the specific tips, stats, or steps — rather than just a vague topic, and keep the text concise so it stays legible in the image. Specify a color theme or mood and the audience (general public, executives, students), and choose an aspect ratio that matches where it will be posted. If the first result is close but not perfect, adjust one thing at a time and regenerate.
Is this AI infographic generator free, and is it really AI?
Yes — you can generate infographics here for free, and yes, every image is created by an AI image model from your description, not assembled from a fixed template. Because it is AI-generated art, the visuals are striking and fast to produce, but the AI can render text imperfectly and is not a precise charting engine, so always proofread the labels and double-check any numbers before you publish. For graphics where the data must be exact, build the underlying chart in a data tool and use this generator for the surrounding visual story.
Frequently Asked Questions
More Visualization Tools
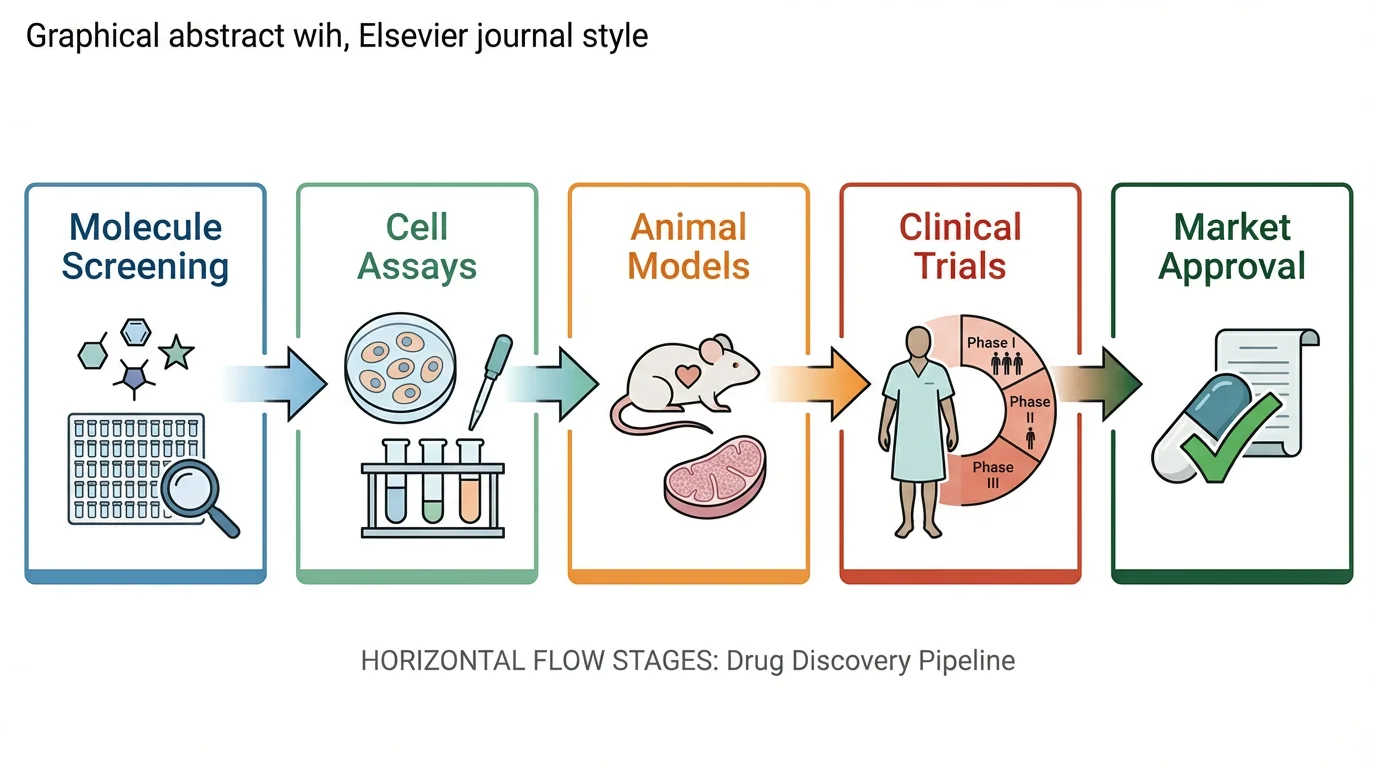 Research
Graphical Abstract Maker
Turn a study or report into a clean, single-panel graphical abstract for journals and slides.
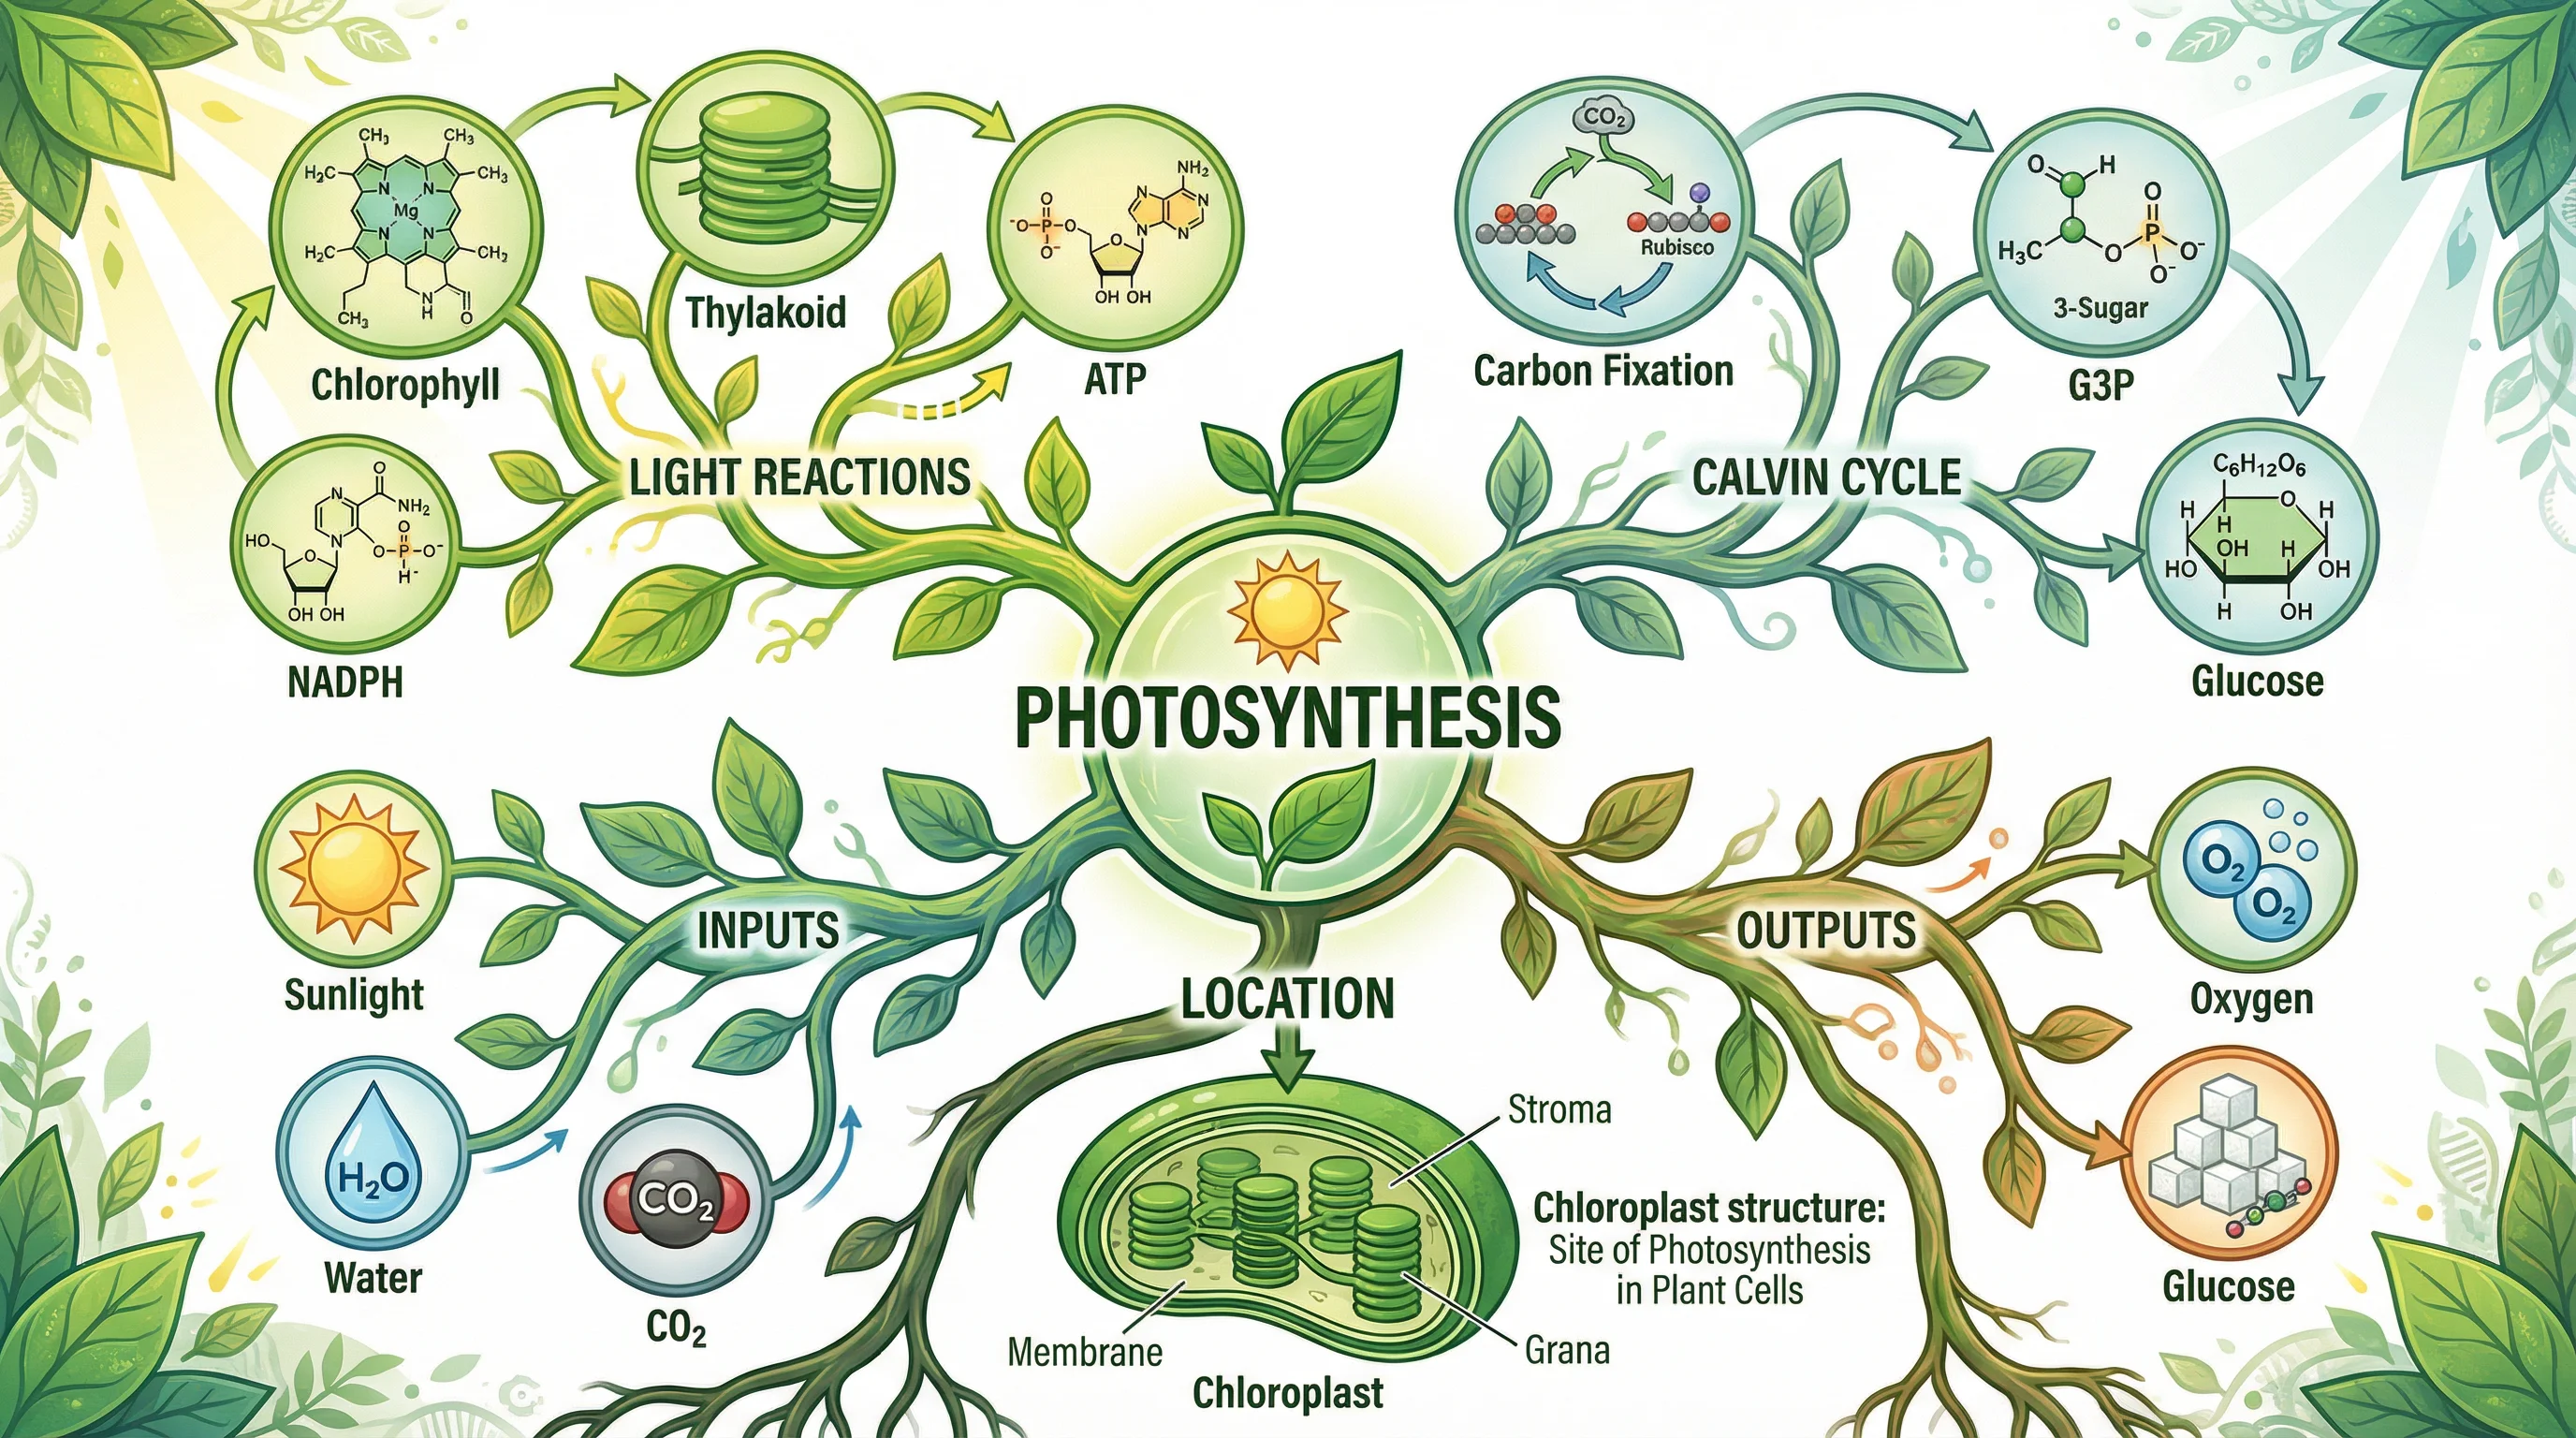 Education
Mind Map Generator
Turn a topic into an organized mind map with branches and sub-branches in seconds.
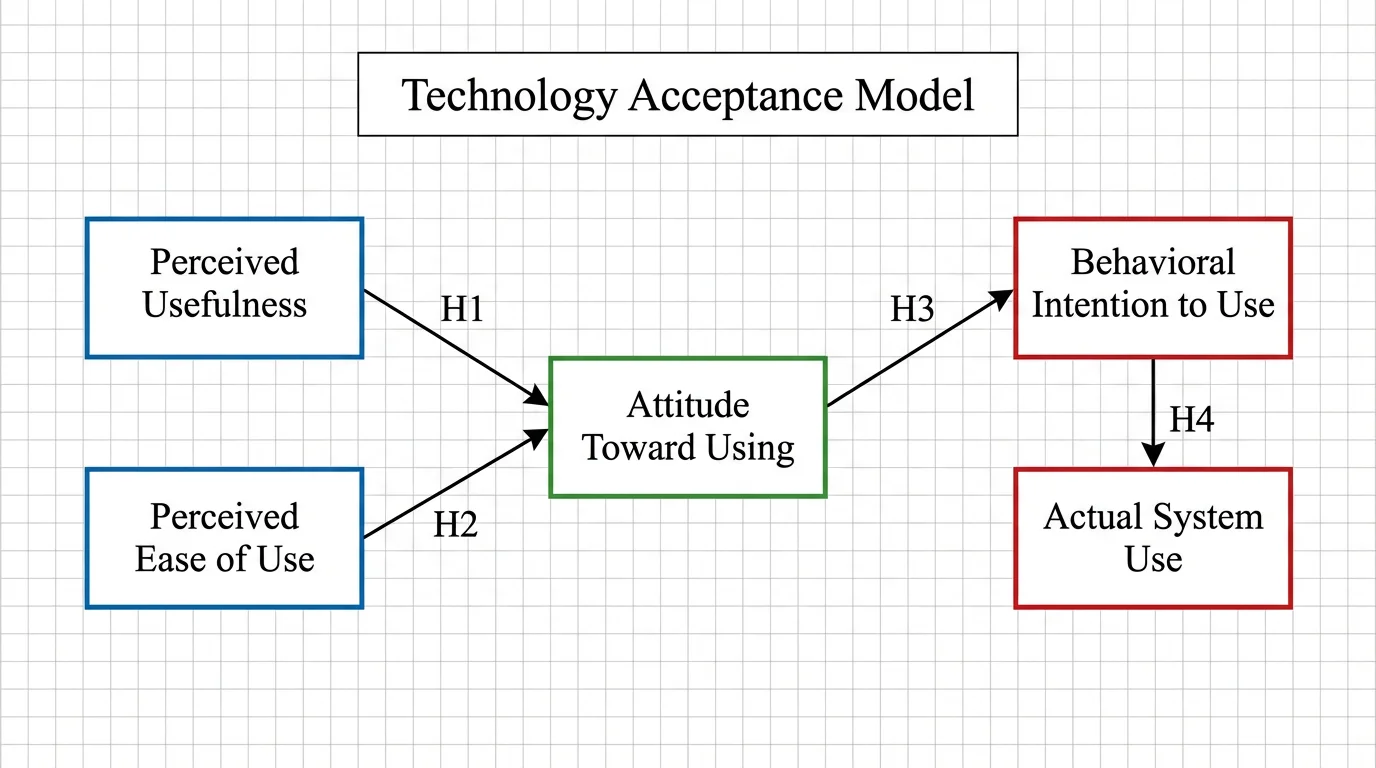 Research
Conceptual Framework Generator
Map variables and relationships into a clear conceptual framework diagram.