Medical Infographic Maker
Make medical and patient education infographics from facts you cite: hand hygiene, blood pressure, stroke signs. Clinician review needed before use.
Create Your Medical Infographic
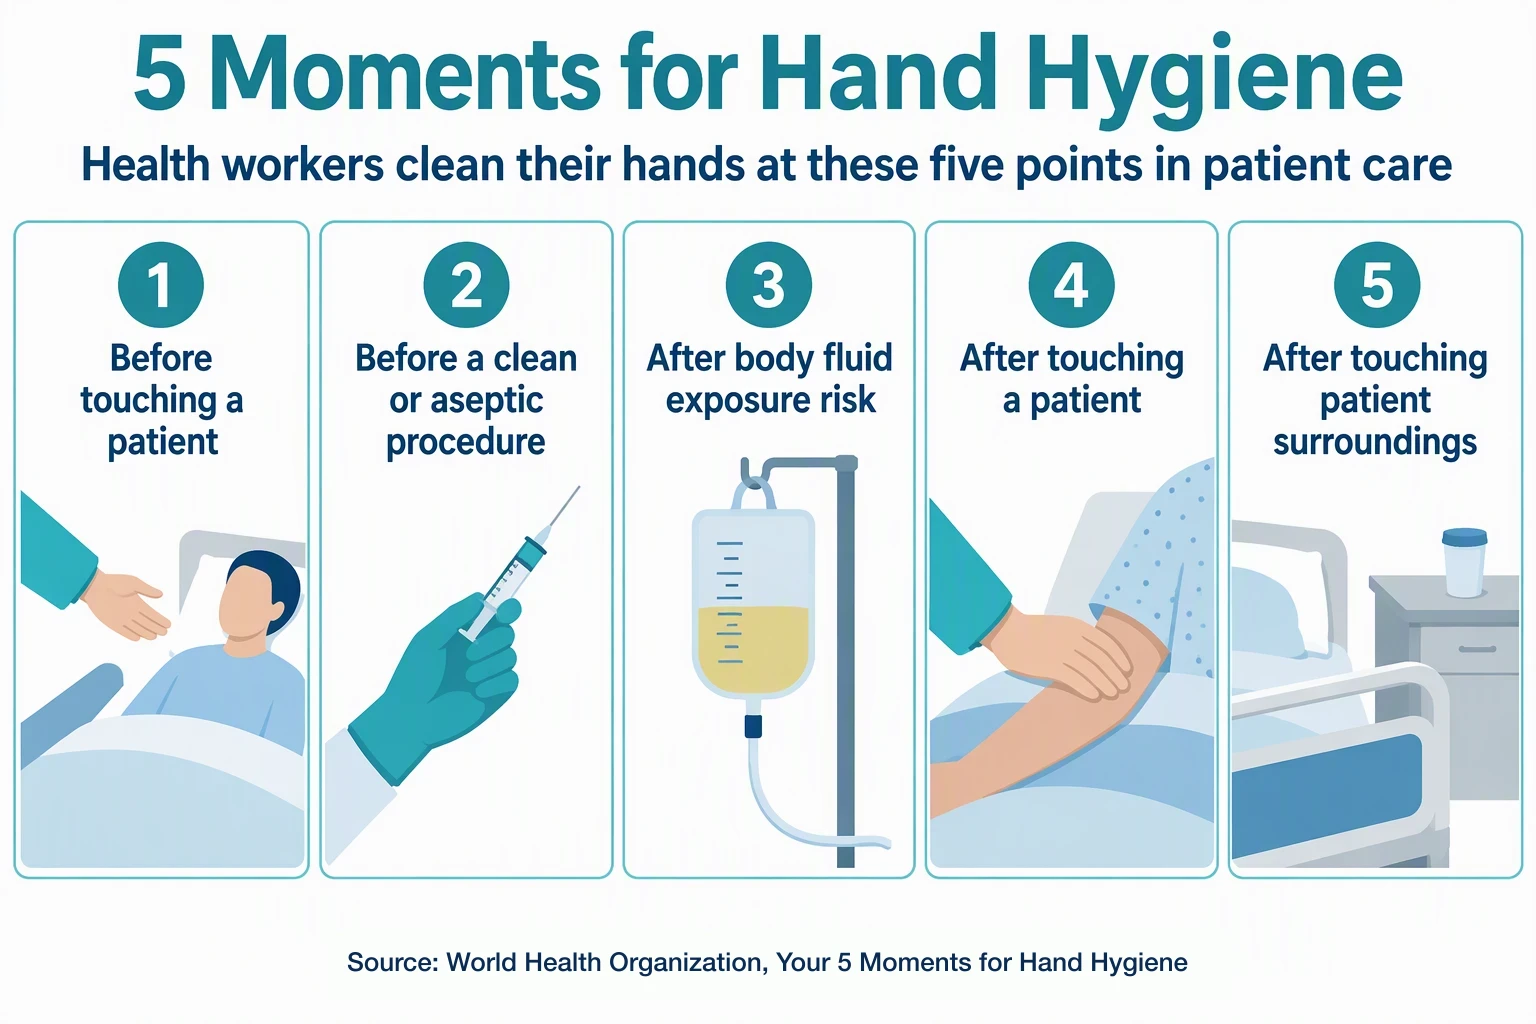 Example: WHO 5 Moments for Hand HygieneView full size
Preview is free on this page ·
Your medical infographic will appear here
AI infographics are drafts. Check every word and number against your source, and have a clinician review before use with patients. No real patient data.
Medical Infographic Examples
Three AI infographics, each checked against an official source and with known flaws noted. No real patients. A clinician should review every infographic before patient use.
WHO 5 Moments for Hand Hygiene (AI infographic)
AI-generated from the prompt shown, with the five moments written into the prompt in the WHO order. We checked every label against the WHO poster "Your 5 Moments for Hand Hygiene" (May 2009; checked October 2026) and all five match, in order: before touching a patient, before clean/aseptic procedure, after body fluid exposure risk, after touching a patient, after touching patient surroundings. Known flaws: the labels say "a clean or aseptic procedure" where WHO writes "clean/aseptic procedure"; the picture for moment 3 is an IV-style bag on a pole with yellow fluid, where WHO draws a drain bag, so it looks like an infusion; the cards run to the left and right edges of the image; no hand-rubbing or washing is shown, so the picture does not say what to do at each moment, only when; the syringe card shows a gloved hand, which may suggest gloves replace hand hygiene. The footer source line was rewritten by program, because the AI footer drew "Your" with an extra stroke between the letters; this is the only text in the picture that did not come from the AI. It is a teaching sketch, not a replacement for the official WHO poster.
Adult blood pressure categories (AI infographic)
AI-generated from the prompt shown. Every number was checked against the NHLBI blood pressure table (checked October 2026). The "AHA/ACC" in the footer comes from CDC, which says most health care professionals use the ACC and AHA guidelines to diagnose high blood pressure: normal is under 120 and under 80; elevated is 120 to 129 and under 80; stage 1 is 130 to 139 or 80 to 89; stage 2 is 140 or higher or 90 or higher; above 180 or above 120 needs a provider right away. The numbers were right on every try. The first try printed the source as "NHBBI", a typo for NHLBI, so we changed the footer and generated again, and the third try is the one shown. Known flaws: the footer line runs close to the left and right edges; the gauge and cuff are decorative and the needle position means nothing; the picture does not say that categories need readings taken properly on more than one occasion; "High blood pressure, Stage 1" keeps the AHA wording, so it can read as a diagnosis, which one reading cannot make; it does not say how urgent a very high reading is beyond "contact your provider immediately", while NHLBI says readings above 180/120 require immediate medical attention, so it does not tell anyone whether to call 9-1-1 when symptoms are present.
Stroke warning signs, F.A.S.T. (AI infographic)
AI-generated from the prompt shown. The four panels follow the NHLBI wording for the FAST test (checked October 2026): Face, ask the person to smile; Arms, raise both arms; Speech, repeat a simple phrase; Time, call 9-1-1 right away. All the text came out as written on the first try. Known flaws: the arms icon shows one person with one arm raised and the other lowered, so it does not show both arms being lifted, which is the actual test; the face icon is a plain outline with a single curved line that could be read as a frown, not a drooping side; the clock hands do not mean a time; the sheet lists only the four FAST signs, and some hospitals teach BE-FAST, which adds balance and eyes; it does not say what NHLBI adds, which is not to drive to the hospital or let someone else drive you, and to call an ambulance so that care can begin on the way. It does not diagnose a stroke.
Making an infographic on a non-medical subject? Try the AI Infographic Generator. Need an anatomy figure, not a chart? Use the Medical Illustration Generator, or the Dermatology Patient Education Illustrations page for skin care handouts. Sources, checked October 2026: WHO Your 5 Moments for Hand Hygiene poster, NHLBI blood pressure diagnosis, CDC about high blood pressure, and NHLBI stroke symptoms.
What this page is for
This page is for clinicians, nurses, health educators, medical students, and public health staff who need a medical infographic built from facts they can cite: a hand hygiene reminder, a table of blood pressure categories, a stroke warning sign poster. You paste the facts and the exact wording you want, and the generator drafts the infographic. You then check every figure against the source and have a clinician review it. This is a drafting tool, not a library of approved patient materials, and the examples here are not medical advice.
How this differs from a template site and from the other tools
- Template sites such as Canva, Venngage, and Piktochart give you a layout to fill in. You still supply the facts, and the template does not know whether a number is right. Here you describe the content and the generator lays it out, so the work moves to the part that matters in health: checking the facts.
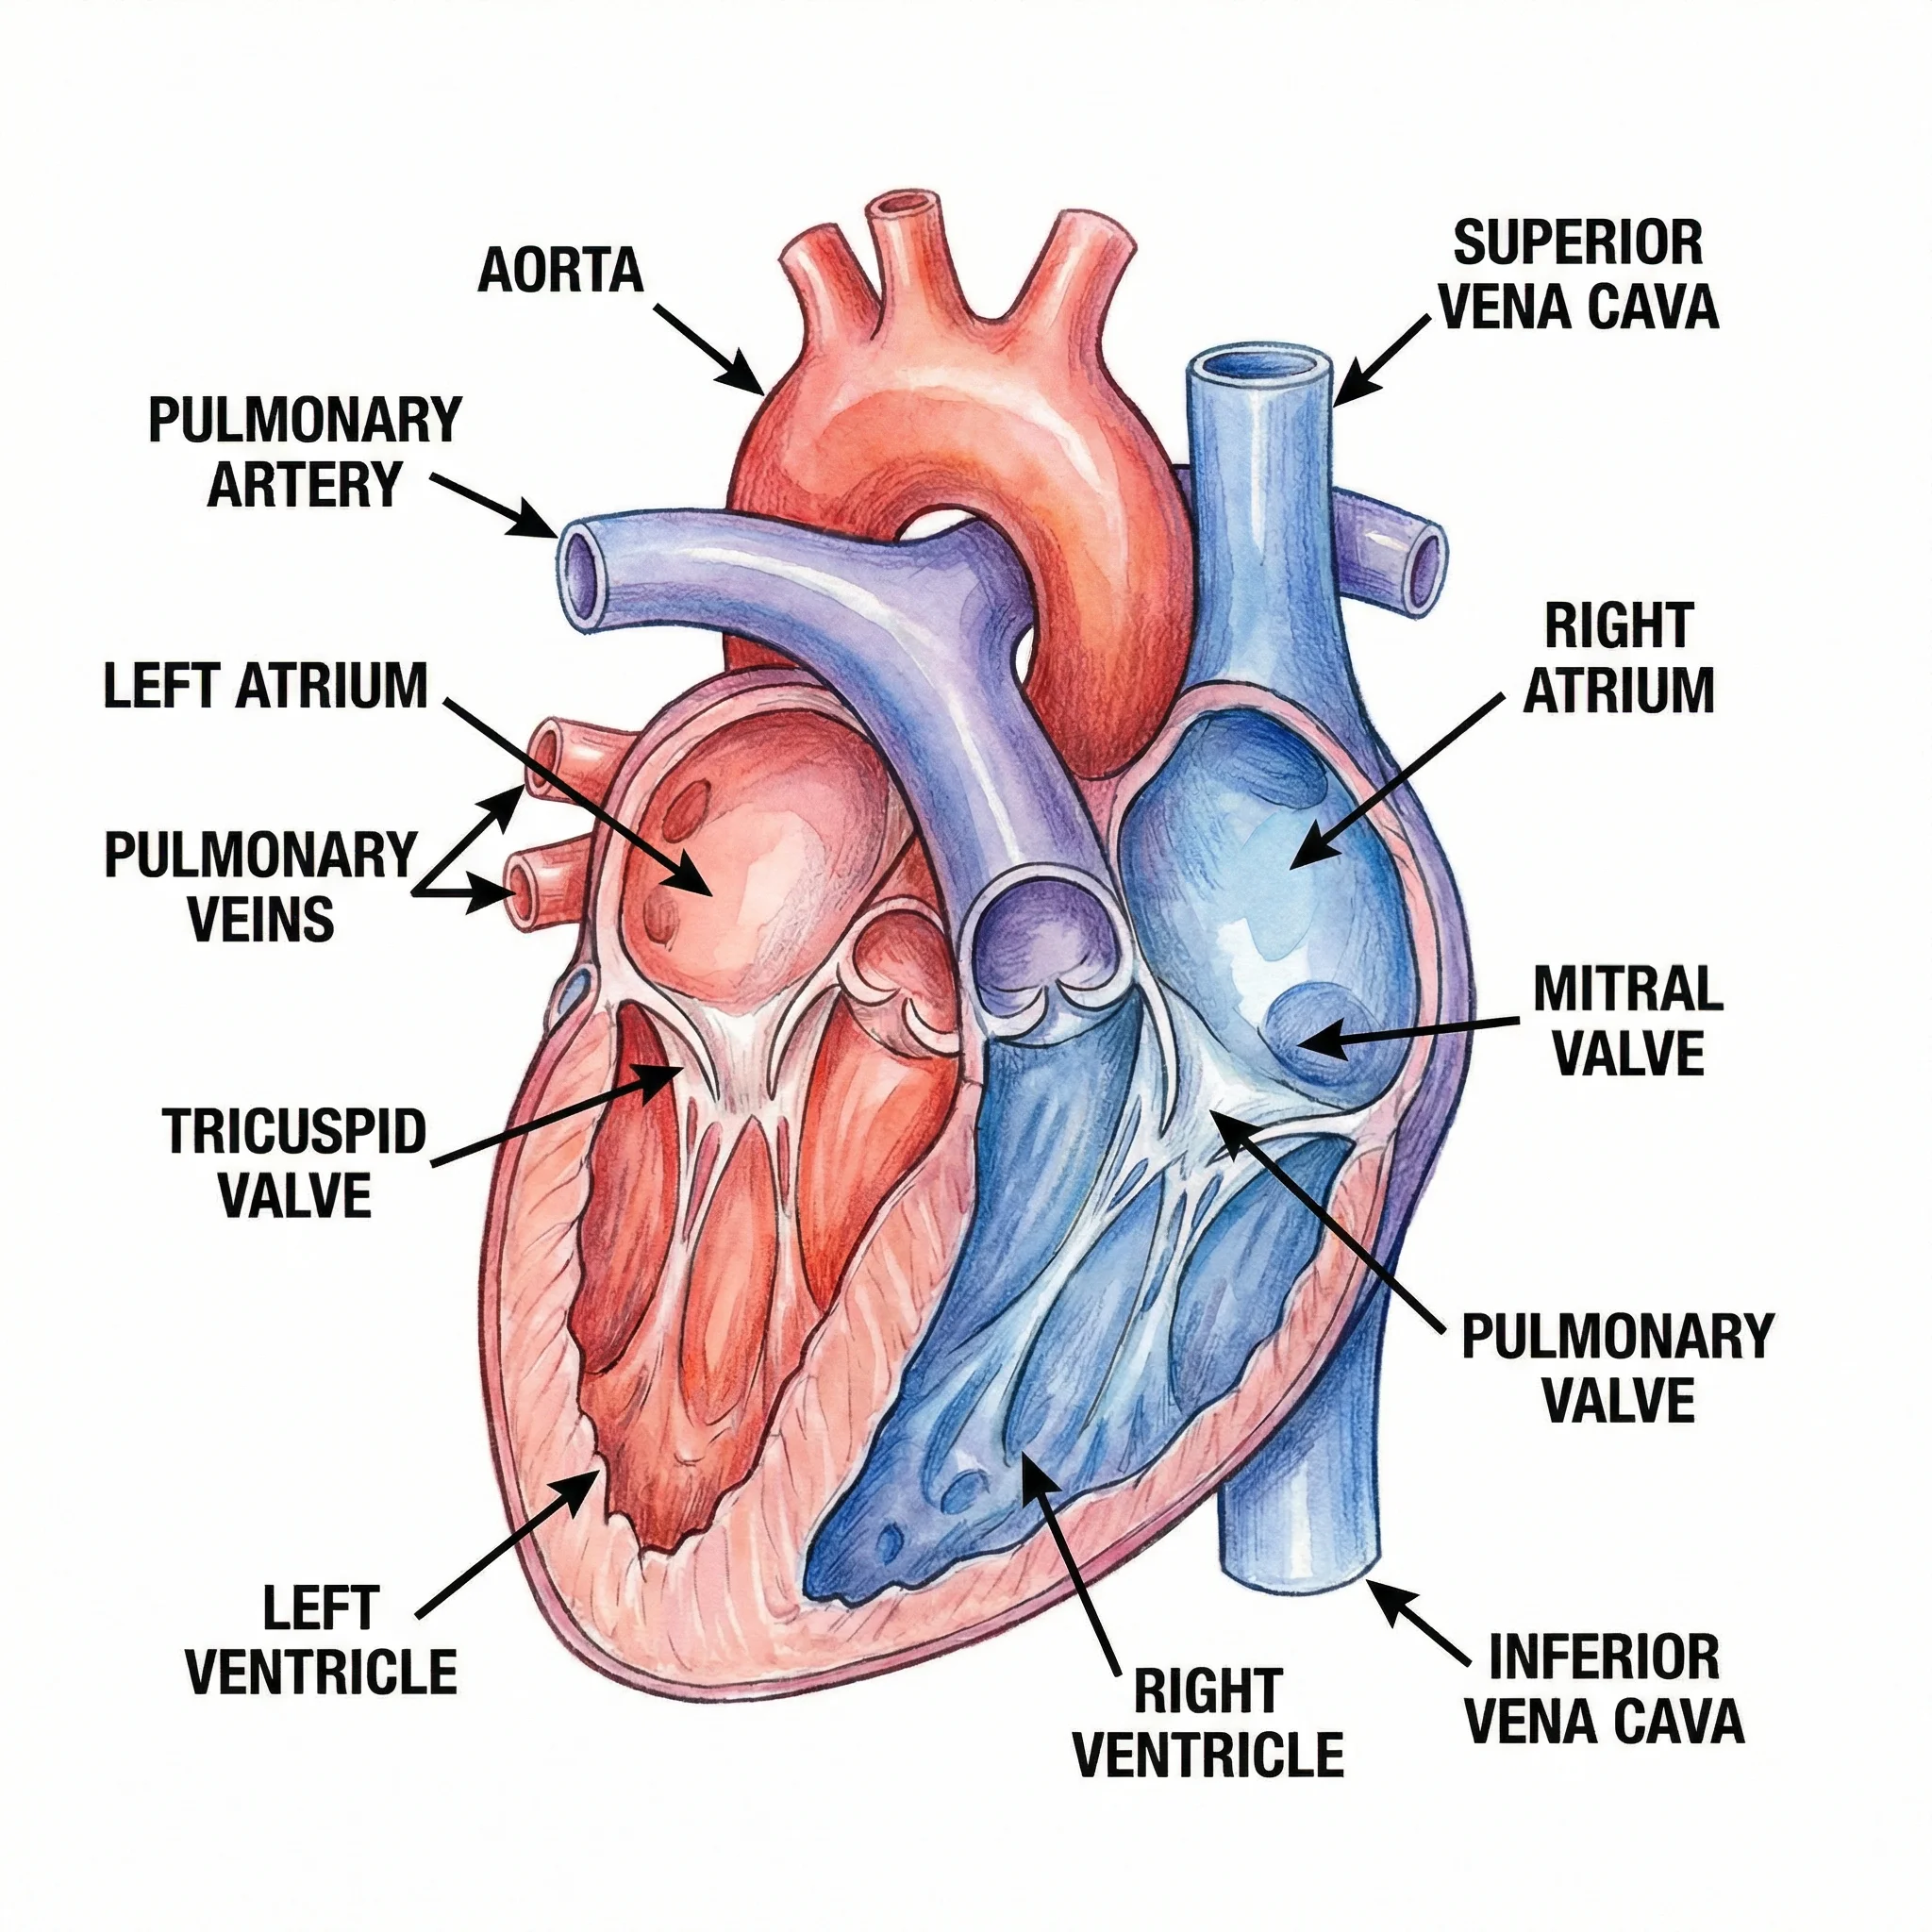
- Our AI Infographic Generator is for any subject, such as business, climate, or marketing. Use it for non-medical topics. Our Medical Illustration Generator draws anatomy and procedures: a labeled heart or a knee cross-section. This page is for the infographic itself: steps, categories, thresholds, and warning signs laid out as a chart or poster, where every number and word has to match a source.
Check the source: what we verified for the three examples
- Hand hygiene: the five moments are before touching a patient; before clean/aseptic procedure; after body fluid exposure risk; after touching a patient; after touching patient surroundings. Source: WHO, "Your 5 Moments for Hand Hygiene" poster, May 2009 (PDF on cdn.who.int, linked below). Checked October 2026.
- Blood pressure: normal is under 120 systolic and under 80 diastolic; elevated is 120 to 129 and under 80; stage 1 is 130 to 139 or 80 to 89; stage 2 is 140 or higher or 90 or higher; above 180 or above 120 is a hypertensive crisis and needs a provider immediately. The numbers were checked against the NHLBI page "High blood pressure: diagnosis" (nhlbi.nih.gov/health/high-blood-pressure/diagnosis). The "AHA/ACC" label comes from CDC, "About high blood pressure" (cdc.gov/high-blood-pressure/about), which says most health care professionals use the ACC and AHA guidelines to diagnose it. Checked October 2026.
- Stroke: the FAST test asks you to check the face for drooping on one side when the person smiles, whether one arm drifts down when both are raised, whether speech is slurred or strange, and to call 9-1-1 right away. Source: NHLBI, "Stroke symptoms" (nhlbi.nih.gov/health/stroke/symptoms). Checked October 2026.
- When you make your own infographic, put the source and the date you checked it in the footer, and keep a copy of the page you used.
How to make a medical infographic you can defend
- Pick one message and one audience, such as "adult patients, blood pressure numbers" or "ward staff, hand hygiene".
- Take the facts from a named, current source: a guideline, a health agency, or your own hospital policy. Write the exact numbers and the exact step order in the prompt, word for word.
- Ask for a plain layout: numbered cards, a table, or a few panels, with large sans-serif text and no extra words.
- Add the source and "For education only" as footer text.
- Generate, then read every word and number against the source. AI infographics often get a word wrong or add one you did not ask for. If one thing is wrong, generate again.
- Have a clinician review the final picture and the wording before it reaches a patient or a classroom.
Accuracy and what AI gets wrong
The three infographics on this page were generated from the prompts shown, and each caption lists the flaws we found. The numbers and steps were right in all three, but the AI footers were not: the first blood pressure try printed "NHBBI" for NHLBI and was generated again, and the hand hygiene footer drew "Your" with an extra stroke and was rewritten by program. The icons were also looser than the words: a bag that looks like an infusion, one arm raised where the test asks for both. Common problems with AI infographics are misspelled words, numbers that change, steps out of order, and icons that suggest something different from the text. Treat each one as a draft. It does not diagnose, it does not give medical advice, and it must be reviewed by a qualified clinician before use with patients.
Guidelines change: date your infographic
Thresholds and recommendations are revised. Guidelines are updated from time to time. Put the source and the date in the footer, and check the current version of the guideline each time you reuse a picture.
Privacy and use with patients
Do not enter patient names, dates of birth, record numbers, or real patient results. Use general facts. Check your organization's policy on AI tools and on what may go into patient materials, and follow its review and sign-off rules.
Free trial and downloads
Start free with 2 image credits, valid for 7 days, no card required. Free accounts download PNG or JPG.
Frequently Asked Questions
Related Medical Tools
 Infographic
AI Infographic Generator
Turn any topic or data points into an infographic, for business, education, and more.
 Medical
Medical Illustration Generator
Create labeled medical and anatomy illustrations for teaching and patient education.
 Medical
Dermatology Patient Education Illustrations
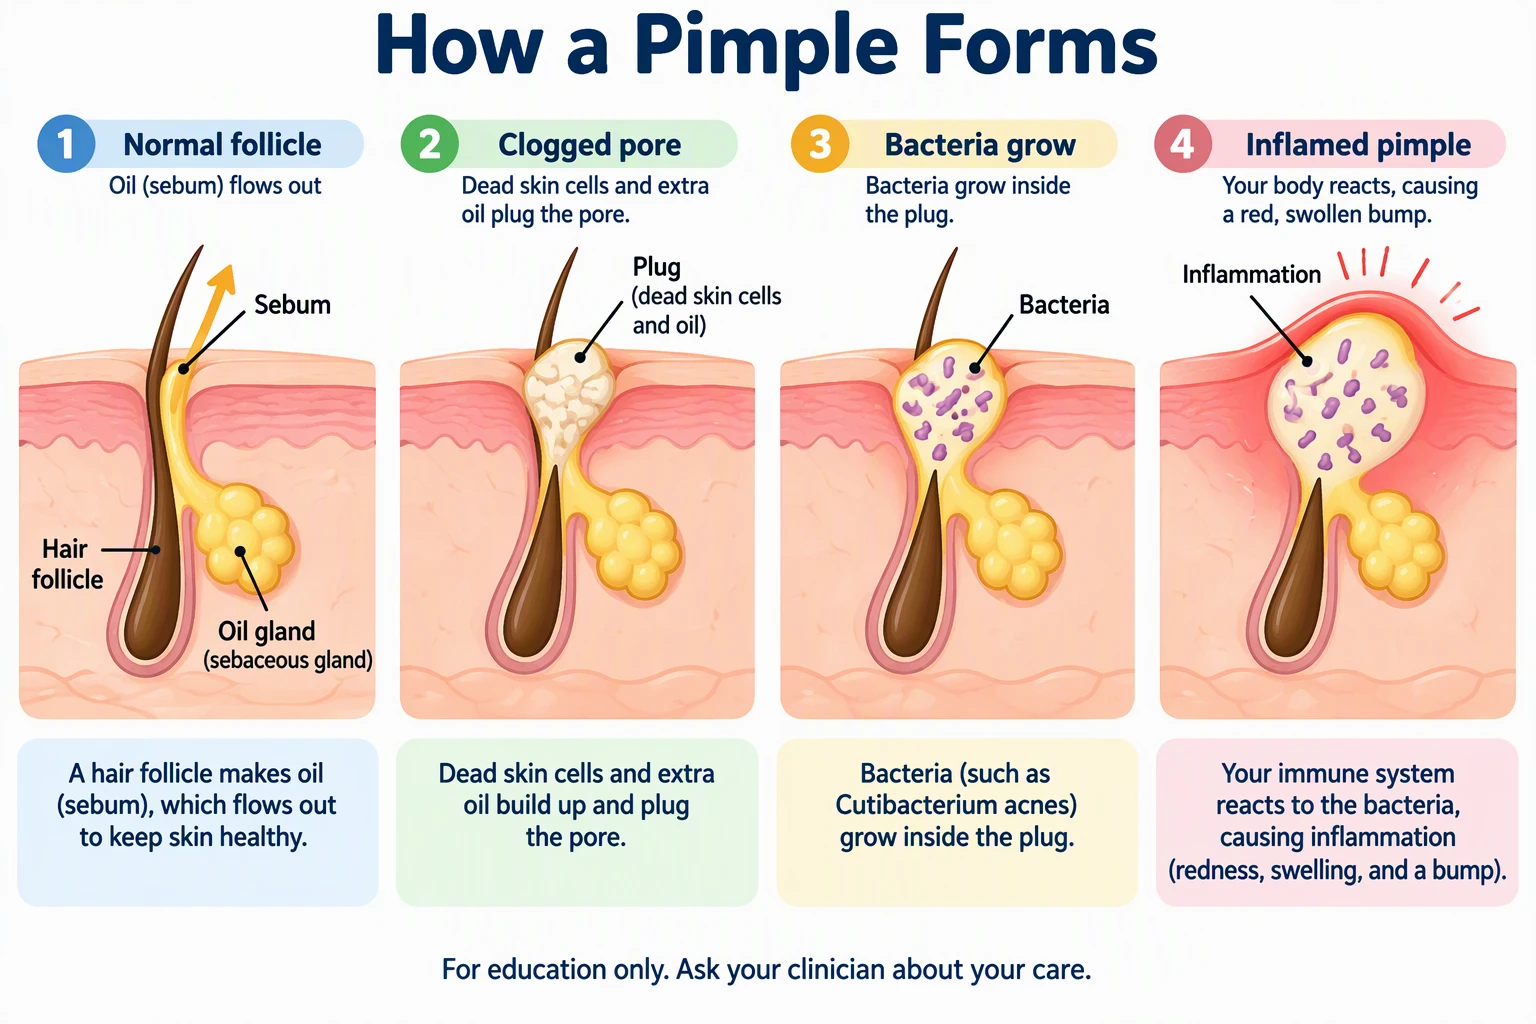
Make skin condition and skin care illustrations for patient handouts, with diverse skin tones and plain-language labels.