Visual Abstract vs Graphical Abstract: What the Journal Wants
Visual abstract and graphical abstract are not always the same file. Check format, pixels, and the journal AI rule before you submit the wrong panel file.
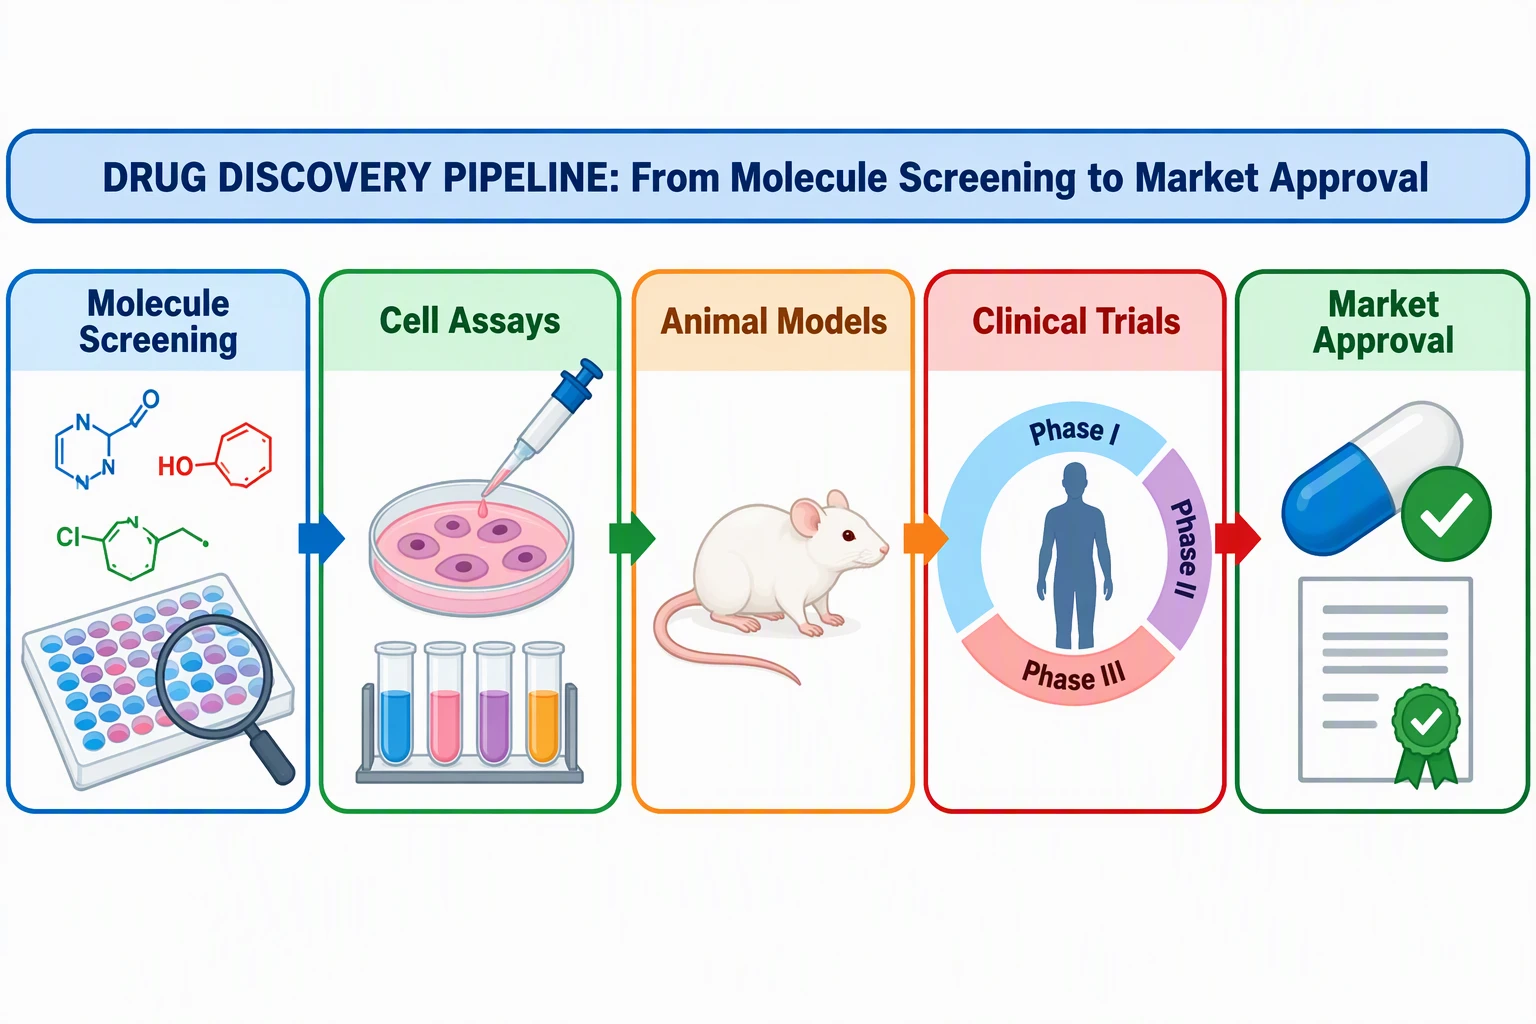
Draft the Elsevier / Cell-style single panel — mechanism or study arc, not a three-number tweet card.
Start with this diagram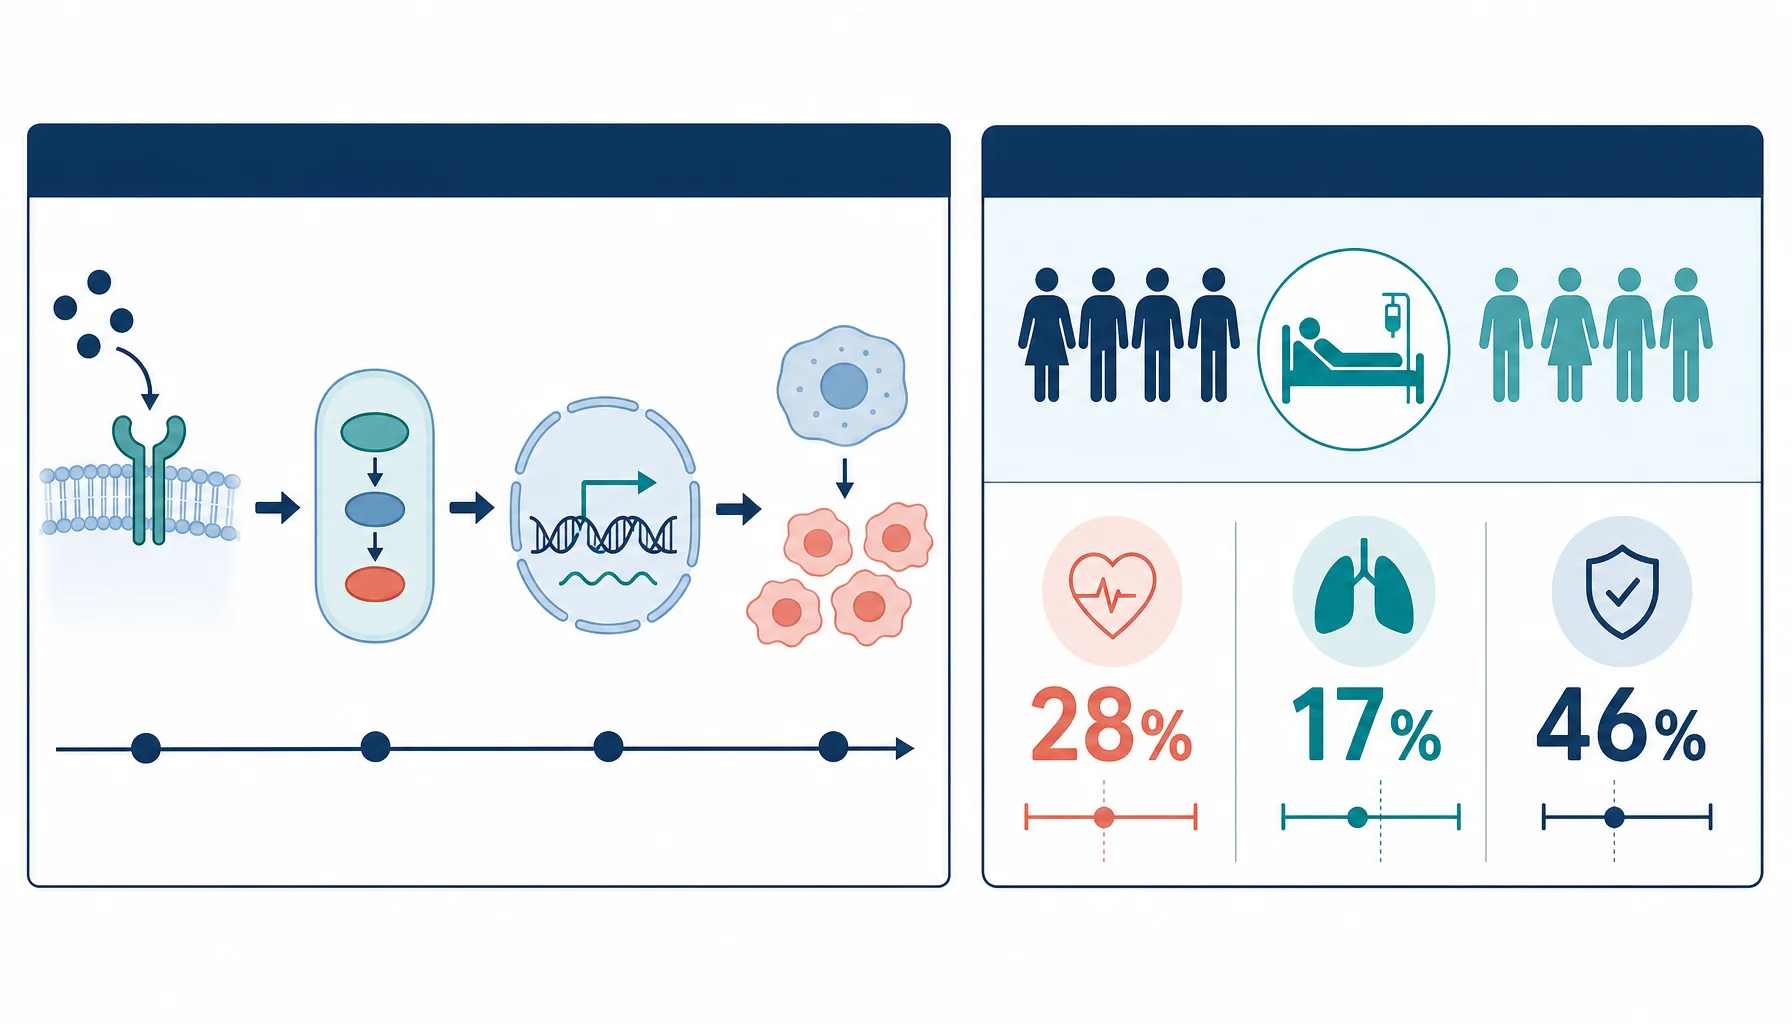
Your journal email said visual abstract. The author guide says graphical abstract. A colleague forwarded an Ibrahim-style template with three outcome numbers. Those are not automatically the same file.
Elsevier’s own author page uses the two phrases in the same sentence — journals request a “graphical” or “visual abstract” — and then gives one ScienceDirect slot: a landscape image that appears in search results and the online contents list, not in the PDF. That is one object. Surgery journals and many clinical titles use visual abstract for a different object: a templated, often multi-cell graphic built for social posts and journal Twitter/X, popularized by Andrew Ibrahim’s Visual Abstract Primer. If you send the wrong object, production sends it back or the social editor ignores it.
This page is the decision, not another seven-step how-to. For the pixel table and a left-to-right build, use How to Make a Graphical Abstract. For layouts by field, use Graphical Abstract Examples.
The three files people collapse into one word
| Name you were given | What it usually is | Where it lives | Typical shape |
|---|---|---|---|
| Graphical abstract (Elsevier, many Cell Press titles) | One original panel that states the take-home of the paper | ScienceDirect / article landing page / TOC thumbnail | Landscape ~1328 × 531 px (Elsevier); often square on Cell Press |
| Visual abstract (clinical / surgery social) | Templated card: question, design, 1–3 numeric results, one conclusion | Journal social accounts, email blasts, sometimes a companion file | Portrait or square slides; Ibrahim primer formats |
| TOC graphic (ACS, RSC, some chem titles) | Small original artwork for the table of contents | Issue TOC, not always the article PDF | Often square; “unpublished original art” rules are strict |
Editage’s comparison table treats visual abstract as a synonym for graphical abstract at most publishers, and splits TOC graphic as the ACS/RSC cousin. CASRAI and several how-to sites do the opposite: they reserve visual abstract for the heavier, template-driven clinical card. Both readings are in the wild. The journal’s PDF of author instructions wins, not a glossary on a blog — including this one.
Elsevier is the reason the synonym exists. Their guide literally writes “graphical / visual abstract,” specifies 1328 × 531 px at ≥300 dpi, Times/Arial/Courier/Symbol, and says the image is scaled to a 200-pixel-high window. They also link Ibrahim’s primer in the same resource list. So one publisher uses both words for the ScienceDirect panel and points authors at the clinical social format. You still have to see which file the submission system is asking for.
A 60-second check before you open PowerPoint
- Copy the exact heading in the guide for authors: Graphical abstract, Visual abstract, TOC graphic, or Highlight / eTOC image.
- Copy the pixel box. If you see 1328 × 531 or “500 × 200 ratio,” you are in the Elsevier ScienceDirect slot. If you see 1200 × 1200, you are closer to Cell Press / social square. If you see a three-column slide template, you are in the Ibrahim family.
- Copy the AI sentence. Elsevier’s current graphical-abstract page says generative AI in that image must follow their journal generative-AI policy: some explanatory schematics can be disclosed; primary data images cannot; some titles want a dedicated illustration tool named in the caption. Cell, JAMA Network, and society journals each write their own line. Do not reuse a rule from a different publisher.
- Decide whether a manuscript figure is allowed. Elsevier notes that some authors reuse a concluding figure; ACS-style TOC graphics usually forbid previously published art. If the guide says original, do not crop Figure 4.
If step 2 is a landscape 2.5:1 panel, keep reading here and generate on the graphical-abstract tool. If step 2 is a three-outcome card, download Ibrahim’s templates from SurgeryRedesign and fill numbers by hand. ConceptViz will not invent your hazard ratio.
A single-panel study arc — molecule, model, outcome — is what most Elsevier / Cell “graphical abstract” slots want. It is not a tweet card with three big numbers.
When the words are the same job
In chemistry, molecular biology, and most Elsevier life-science titles, visual abstract in an email is usually the graphical abstract. The job is:
- one take-home, readable at thumbnail height
- left-to-right or top-to-bottom flow
- labels inside the image, no extra caption file pretending to be the figure
- no heading that says “Graphical abstract” inside the artwork (Elsevier says this explicitly)
That panel is a cousin of a scientific figure, not of a conference poster. If your draft looks like Figure 3 with the legend deleted, it will fail the thumbnail test. Elsevier states the average annual use of an article can double with a visual/graphical abstract; treat that as their marketing claim, not a guarantee for your paper.
AI Scientific Image Generator
When the journal wants a mechanism or methods panel instead of a TOC banner.
When the words are a different job
Clinical journals that adopted Ibrahim’s format want scannable outcomes, not a pretty pathway. Typical cells:
- population / intervention
- primary outcome with N and a number
- one secondary result
- one sentence conclusion
Annals of Surgery and several society journals have published audits of whether those cards match the paper. Guidolin et al. (Ann Surg, 2022) found design and accuracy problems in academic surgical visual abstracts — enough that Ibrahim’s later primer editions added misuse safeguards. If you generate a colorful organ illustration and drop three numbers on top in a different font, you have neither object.
Do not run that card through an image generator and hope the journal social editor accepts it. Use the official template, type the numbers from the abstract, and have a co-author check every statistic against the results table.
TOC graphic is the third trap
American Chemical Society and Royal Society of Chemistry issues often want a TOC graphic: original, unpublished art sized for a tiny issue grid (ACS: no larger than 3.25 × 1.75 in; ChemComm: max 8 × 4 cm; Angewandte: 5.5 × 5.0 cm or a thin 11 × 2.5 cm strip). It is closer to a journal cover sketch than to a methods figure. Reusing a manuscript scheme, a BioRender icon collage, or a generated panel that still contains a readable paragraph will bounce. If your guide says TOC graphic and never says graphical abstract, do not upload an Elsevier 1328 × 531 banner as is; rebuild it for the journal's box. Our TOC graphic requirements by journal table lists each size with its official source.
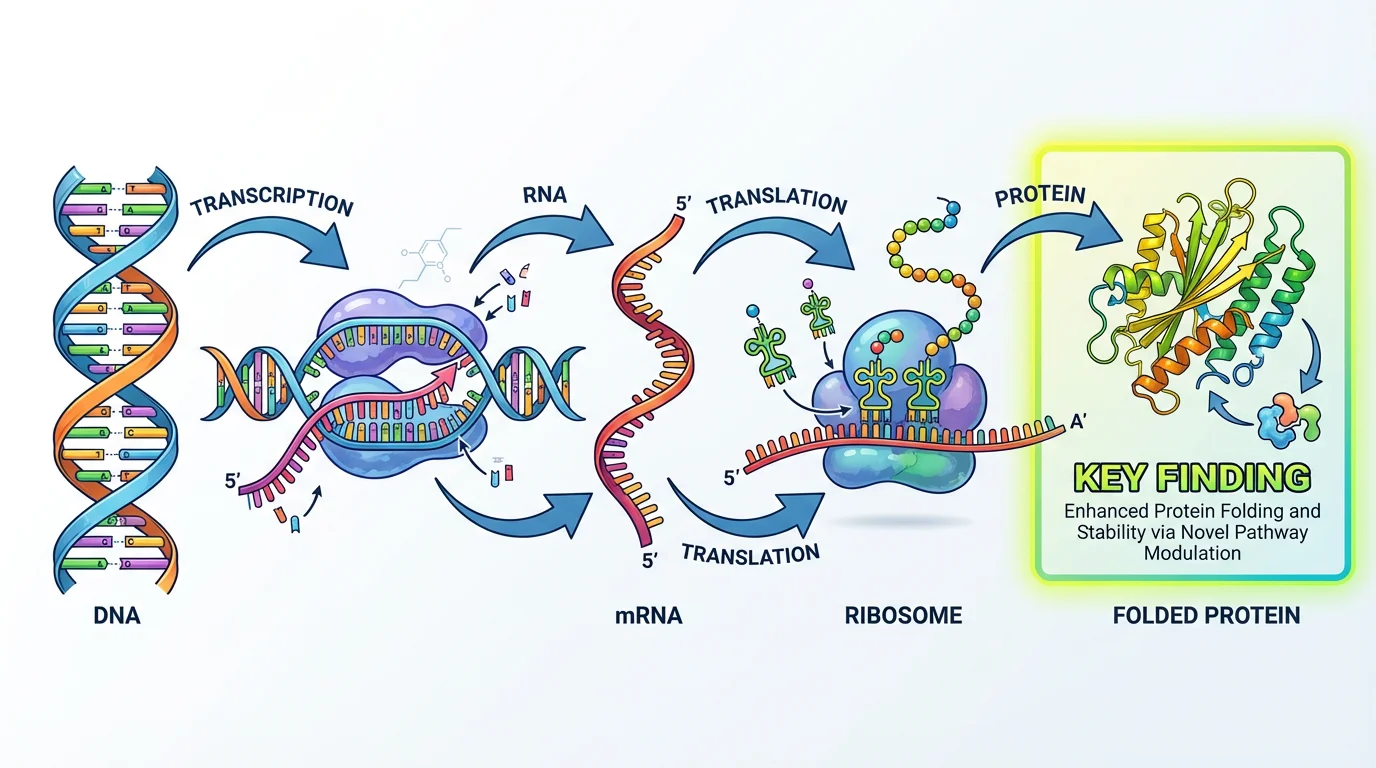
A mechanism panel can become a TOC graphic only after you rebuild it to the journal’s box and strip the paragraph labels. Cropping a landscape Elsevier file is how you fail the thumbnail.
What to generate, and what to leave as type
| You were asked for | Generate? | Type by hand? |
|---|---|---|
| Elsevier / Cell graphical abstract of a mechanism or study arc | Yes — one panel, then crop to the pixel box | Axis numbers, gene names, doses you must not hallucinate |
| Ibrahim-style visual abstract | No | Every N, %, HR, CI |
| ACS / RSC TOC graphic | Maybe a draft composition | Chemical identity; many titles want a human-drawn scheme |
| Reused Results figure | No | — |
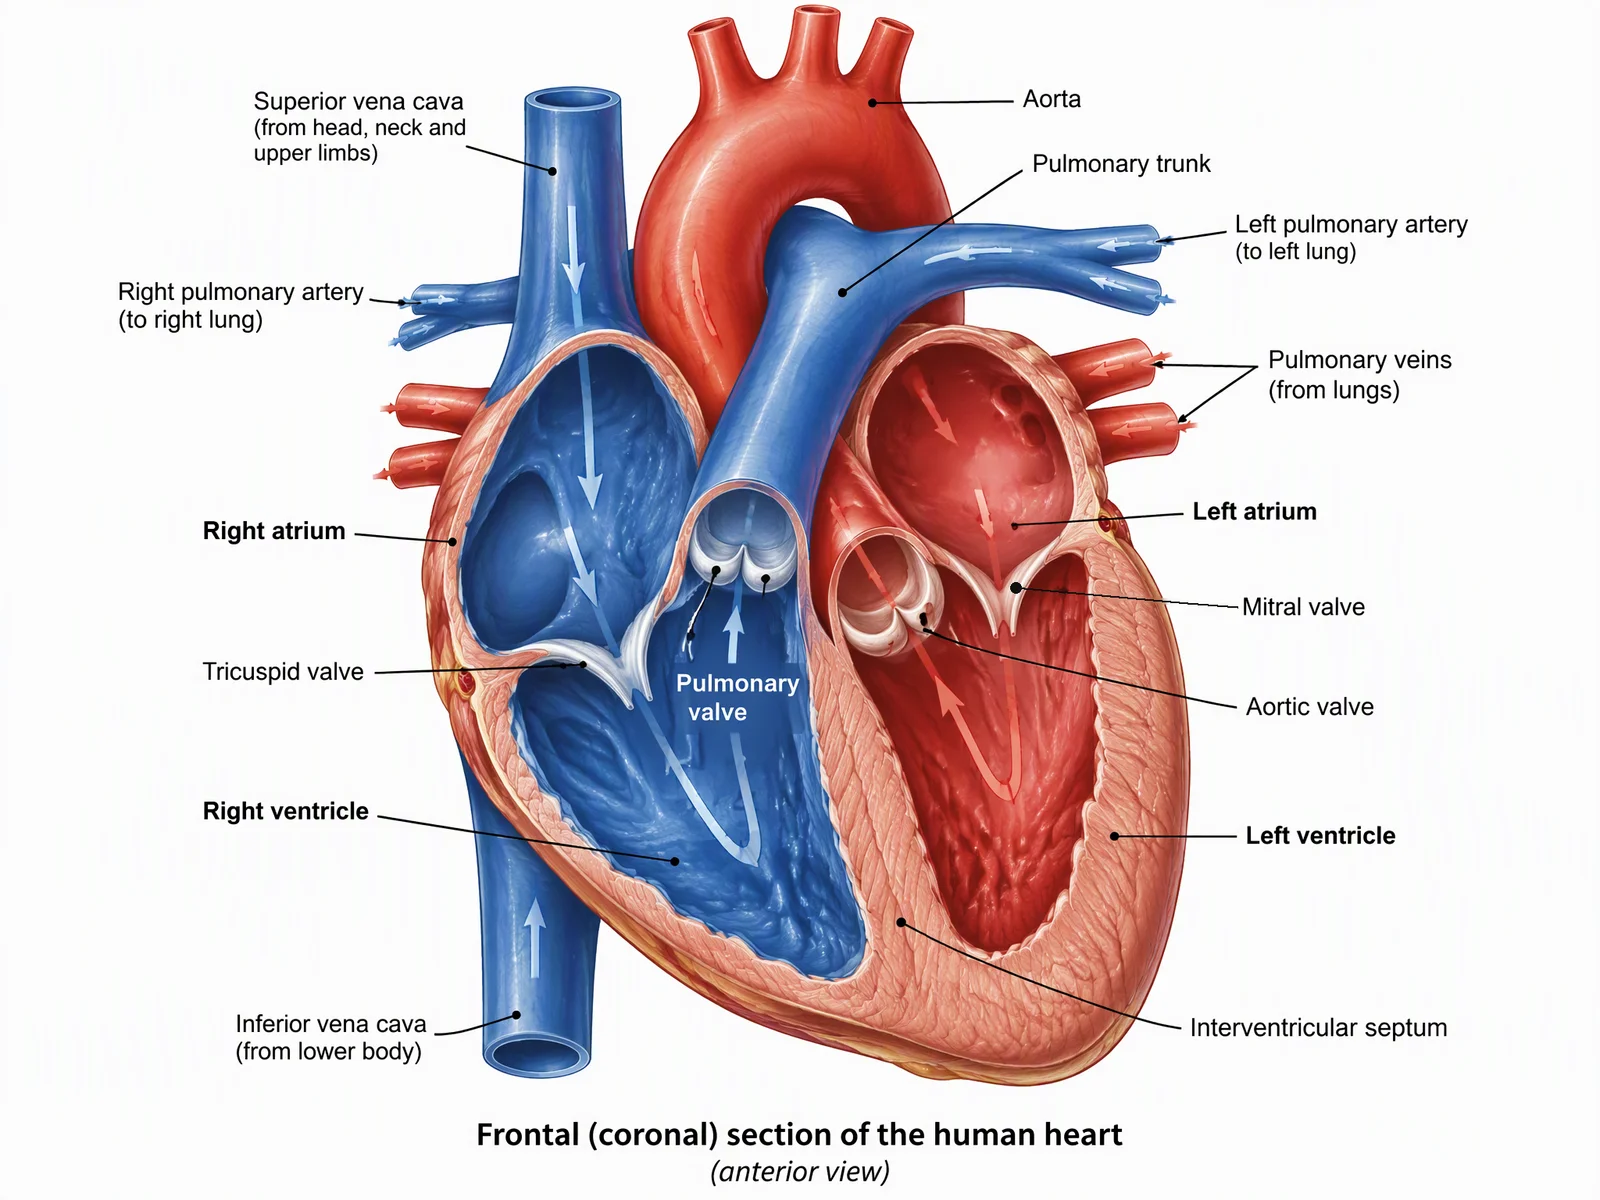
Medical Illustration Generator
Custom anatomy for a graphical abstract when the icon library does not have your view.
A generated draft is a first picture you can reject. It is not “journal-ready.” Journals that allow AI on explanatory figures still want the tool named in the caption or the disclosure statement. ConceptViz paid users can download an AI Use & Commercial License Statement for that paper trail; the journal still decides.
How to pick the tool without starting over
- Single-panel study arc or mechanism for Elsevier / Cell → graphical abstract maker. Set 16:9 for Elsevier’s ratio, then crop to 1328 × 531. Set 1:1 if the guide is square.
- Custom organ or surgical view inside that panel → medical illustration, then composite.
- Icon biology the lab already draws in BioRender → keep the seat; see BioRender vs ConceptViz.
- Clinical three-number card → Ibrahim primer, not a generator.
For fonts that survive a 200-pixel-high thumbnail, use the same advice as posters: best fonts for scientific figures. For color that stays readable in grayscale, use a scientific palette.
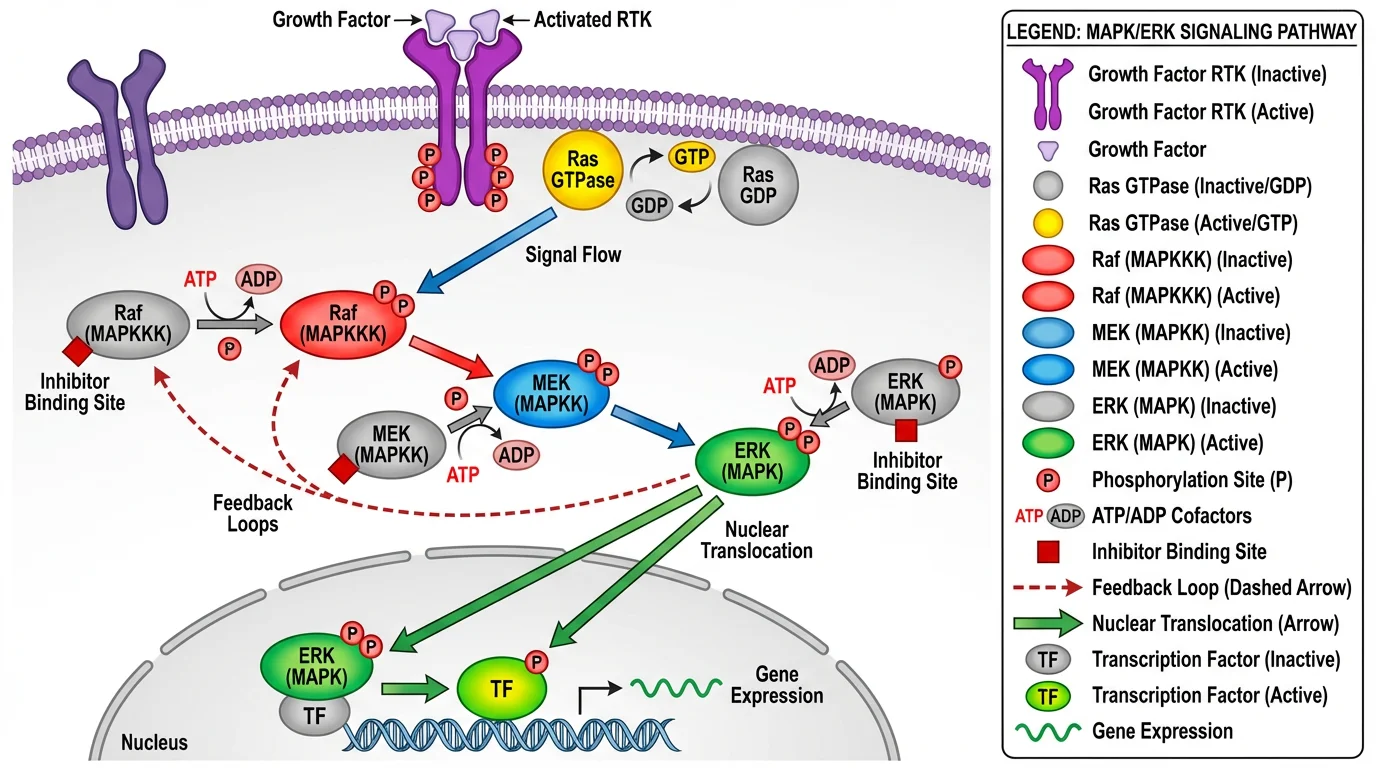
A pathway can be the graphical abstract only if it carries one claim. If a reader needs the legend of Figure 2 to decode it, it is still a results figure.
Common rejections (and which file they belong to)
“Please resubmit at 1328 × 531.” You sent a square social card to Elsevier. Rebuild landscape; do not letterbox a tweet image.
“Remove the heading Graphical Abstract from the artwork.” Elsevier’s instructions. The filename can say it; the pixels cannot.
“This looks like Figure 3.” You reused a results panel. The TOC / GA slot wants a synthesis, not a cropped blot.
“Numbers do not match the abstract.” You are in visual-abstract-as-social-card territory. Fix the type. Do not regenerate the picture.
“AI policy.” Read that journal. Elsevier allows some disclosed explanatory schematics and bans AI on microscopy, blots, and patient photos. A dedicated illustration tool is not a general image app in their wording — name what you used.
Frequently Asked Questions
Is a visual abstract the same as a graphical abstract?
Sometimes. Elsevier uses both words for the ScienceDirect landscape panel. Many clinical journals use visual abstract for a templated social card with numeric outcomes. Read the pixel box in your guide for authors.
What size is an Elsevier graphical abstract?
Elsevier asks for at least 1328 × 531 pixels (same 500 × 200 ratio) at a minimum of 300 dpi, with text large enough to survive a 200-pixel-high thumbnail. Preferred files include TIFF, EPS, PDF, or Office formats. Confirm the live guide; titles can add rules.
What is Andrew Ibrahim’s visual abstract?
A standardized clinical dissemination card — question, design, key numbers, conclusion — described in the Visual Abstract Primer at surgeryredesign.com. More than a hundred journals adopted versions of it. It is not Elsevier’s 1328 × 531 mechanism panel.
Can I reuse a figure from the paper?
Only if that journal says so. Elsevier notes some authors use a concluding figure. ACS-style TOC graphics usually require original, unpublished art. When in doubt, draw a new panel.
Can I use AI for a graphical abstract?
Only if your target journal allows it for that figure type and you disclose the tool. Elsevier bans AI on primary research images. Do not put generated content on a blot, micrograph, or patient photograph.
Should I make a visual abstract in PowerPoint or in a generator?
Ibrahim-style cards: PowerPoint or the journal’s template, because the numbers must be typed. Elsevier/Cell mechanism panels: a dedicated graphical-abstract tool, then crop to the official pixels.
Is a TOC graphic a graphical abstract?
No. A TOC graphic is the small original artwork in an issue grid, common at ACS and RSC. It often has a different aspect ratio and a stricter originality rule.
Where should I start on ConceptViz?
If the guide shows a single-panel study arc or mechanism, use the graphical abstract maker. If you need custom anatomy inside that panel, use medical illustration. If you need a three-number clinical card, do not start here — use the journal template.
Bottom line
Read the pixel box, not the synonym. Same words, two (sometimes three) files. Send Elsevier a landscape synthesis. Send a surgery social editor a numbered template. Send ACS a TOC graphic that has never appeared as Figure 2.
When the file is the single-panel synthesis, draft it on the graphical abstract maker. When the other tab is still BioRender or FigureLabs, use the 1:1 posts — BioRender vs ConceptViz and FigureLabs vs ConceptViz — instead of another alternatives list.
Categories
More Posts
How to Create a Vector Image: A Complete Guide for Beginners and Researchers
Learn how to create vector images using Inkscape, Illustrator, and AI tools. Covers the SVG format, tracing raster images, and best practices for illustration.

Definition of Terms in Research: Thesis Examples, Format & Chapter 1 Guide
What definition of terms means in research and thesis Chapter 1, with examples, format rules, alphabetical order guidance, and common mistakes.
Free Printable Cell Diagram Worksheets: Unlabeled & Labeled (2026)
Download free printable cell diagram worksheets. Includes unlabeled plant cell, animal cell, and comparison diagrams for classroom quizzes and study guides.