Blog
Teaching tips, tool comparisons, and science diagram guides for STEM educators. Create better classroom materials with AI-powered diagram generation.
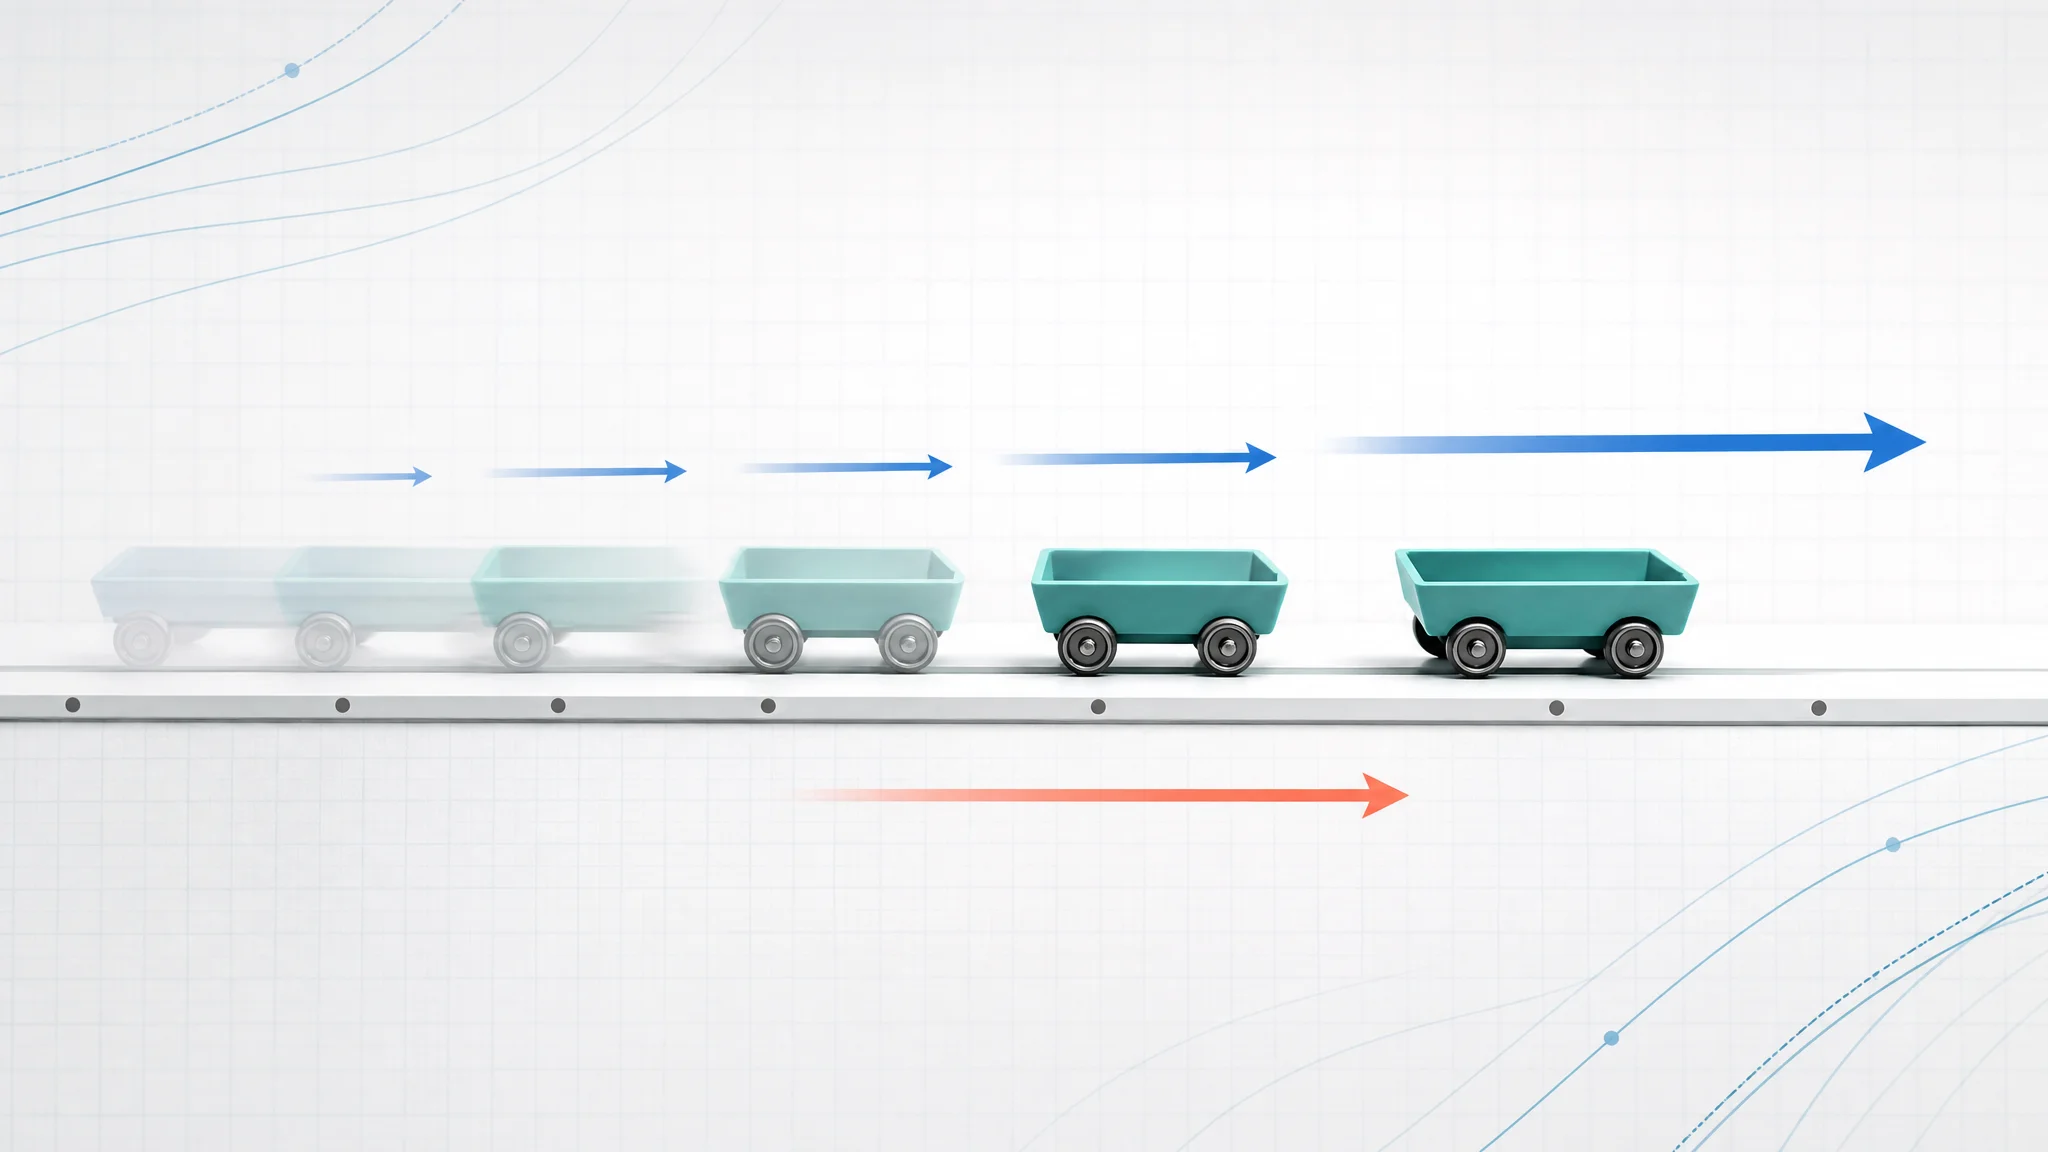
Motion Diagrams in Physics: How to Draw and Read Them
Learn how to draw motion diagrams in physics, read dot spacing, velocity arrows, acceleration direction, and connect diagrams to graphs.
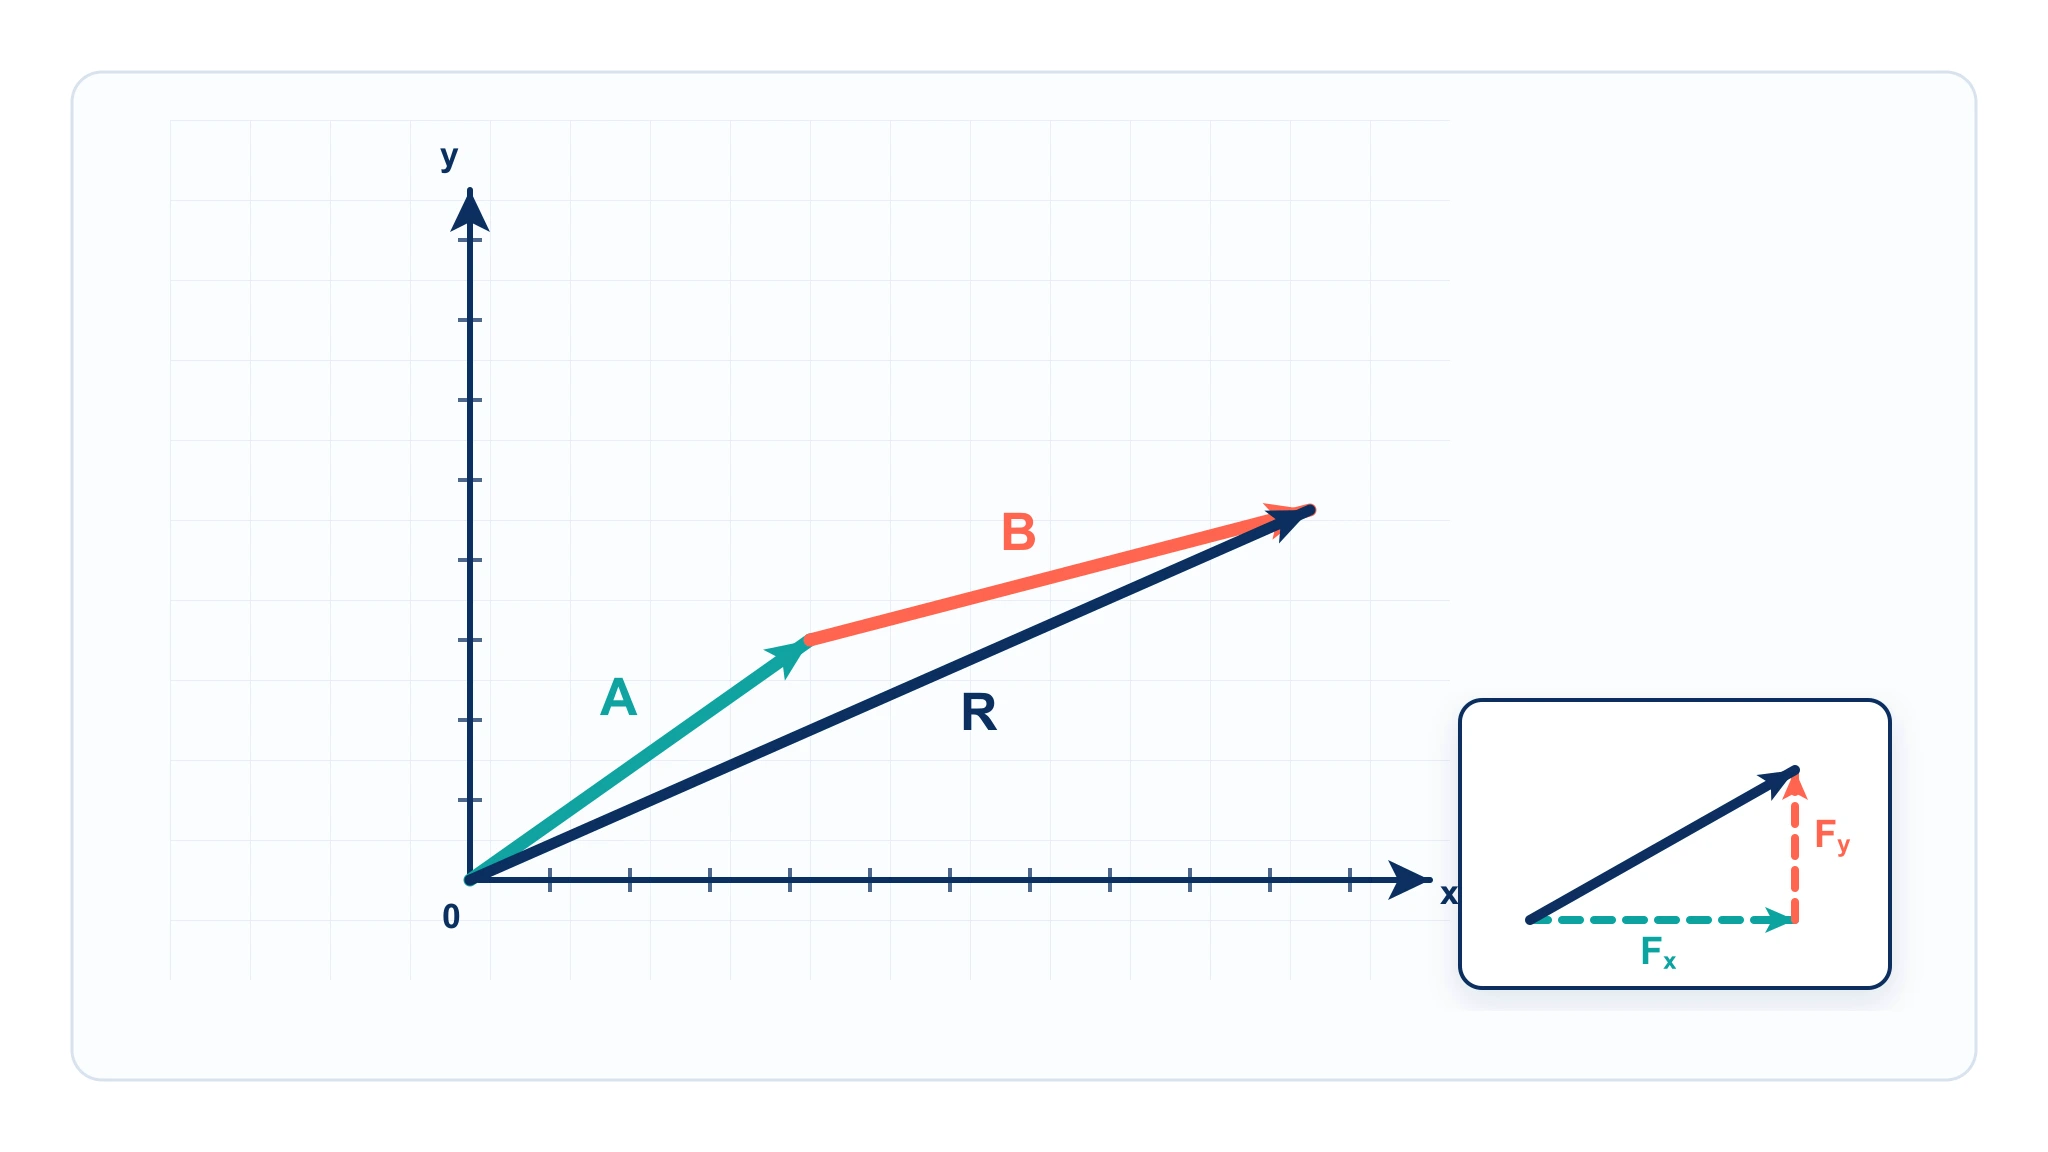
Vector Diagrams in Physics: How to Draw and Read Them
Learn how to draw vector diagrams in physics, add vectors head-to-tail, resolve components, find resultants, and avoid common diagram mistakes.

AI Conceptual Framework for Thesis: Prompts, Examples, and Chapter 1 Workflow
Create an AI conceptual framework for thesis work with prompts, examples, variable tables, Chapter 1 writing tips, and validation checks.
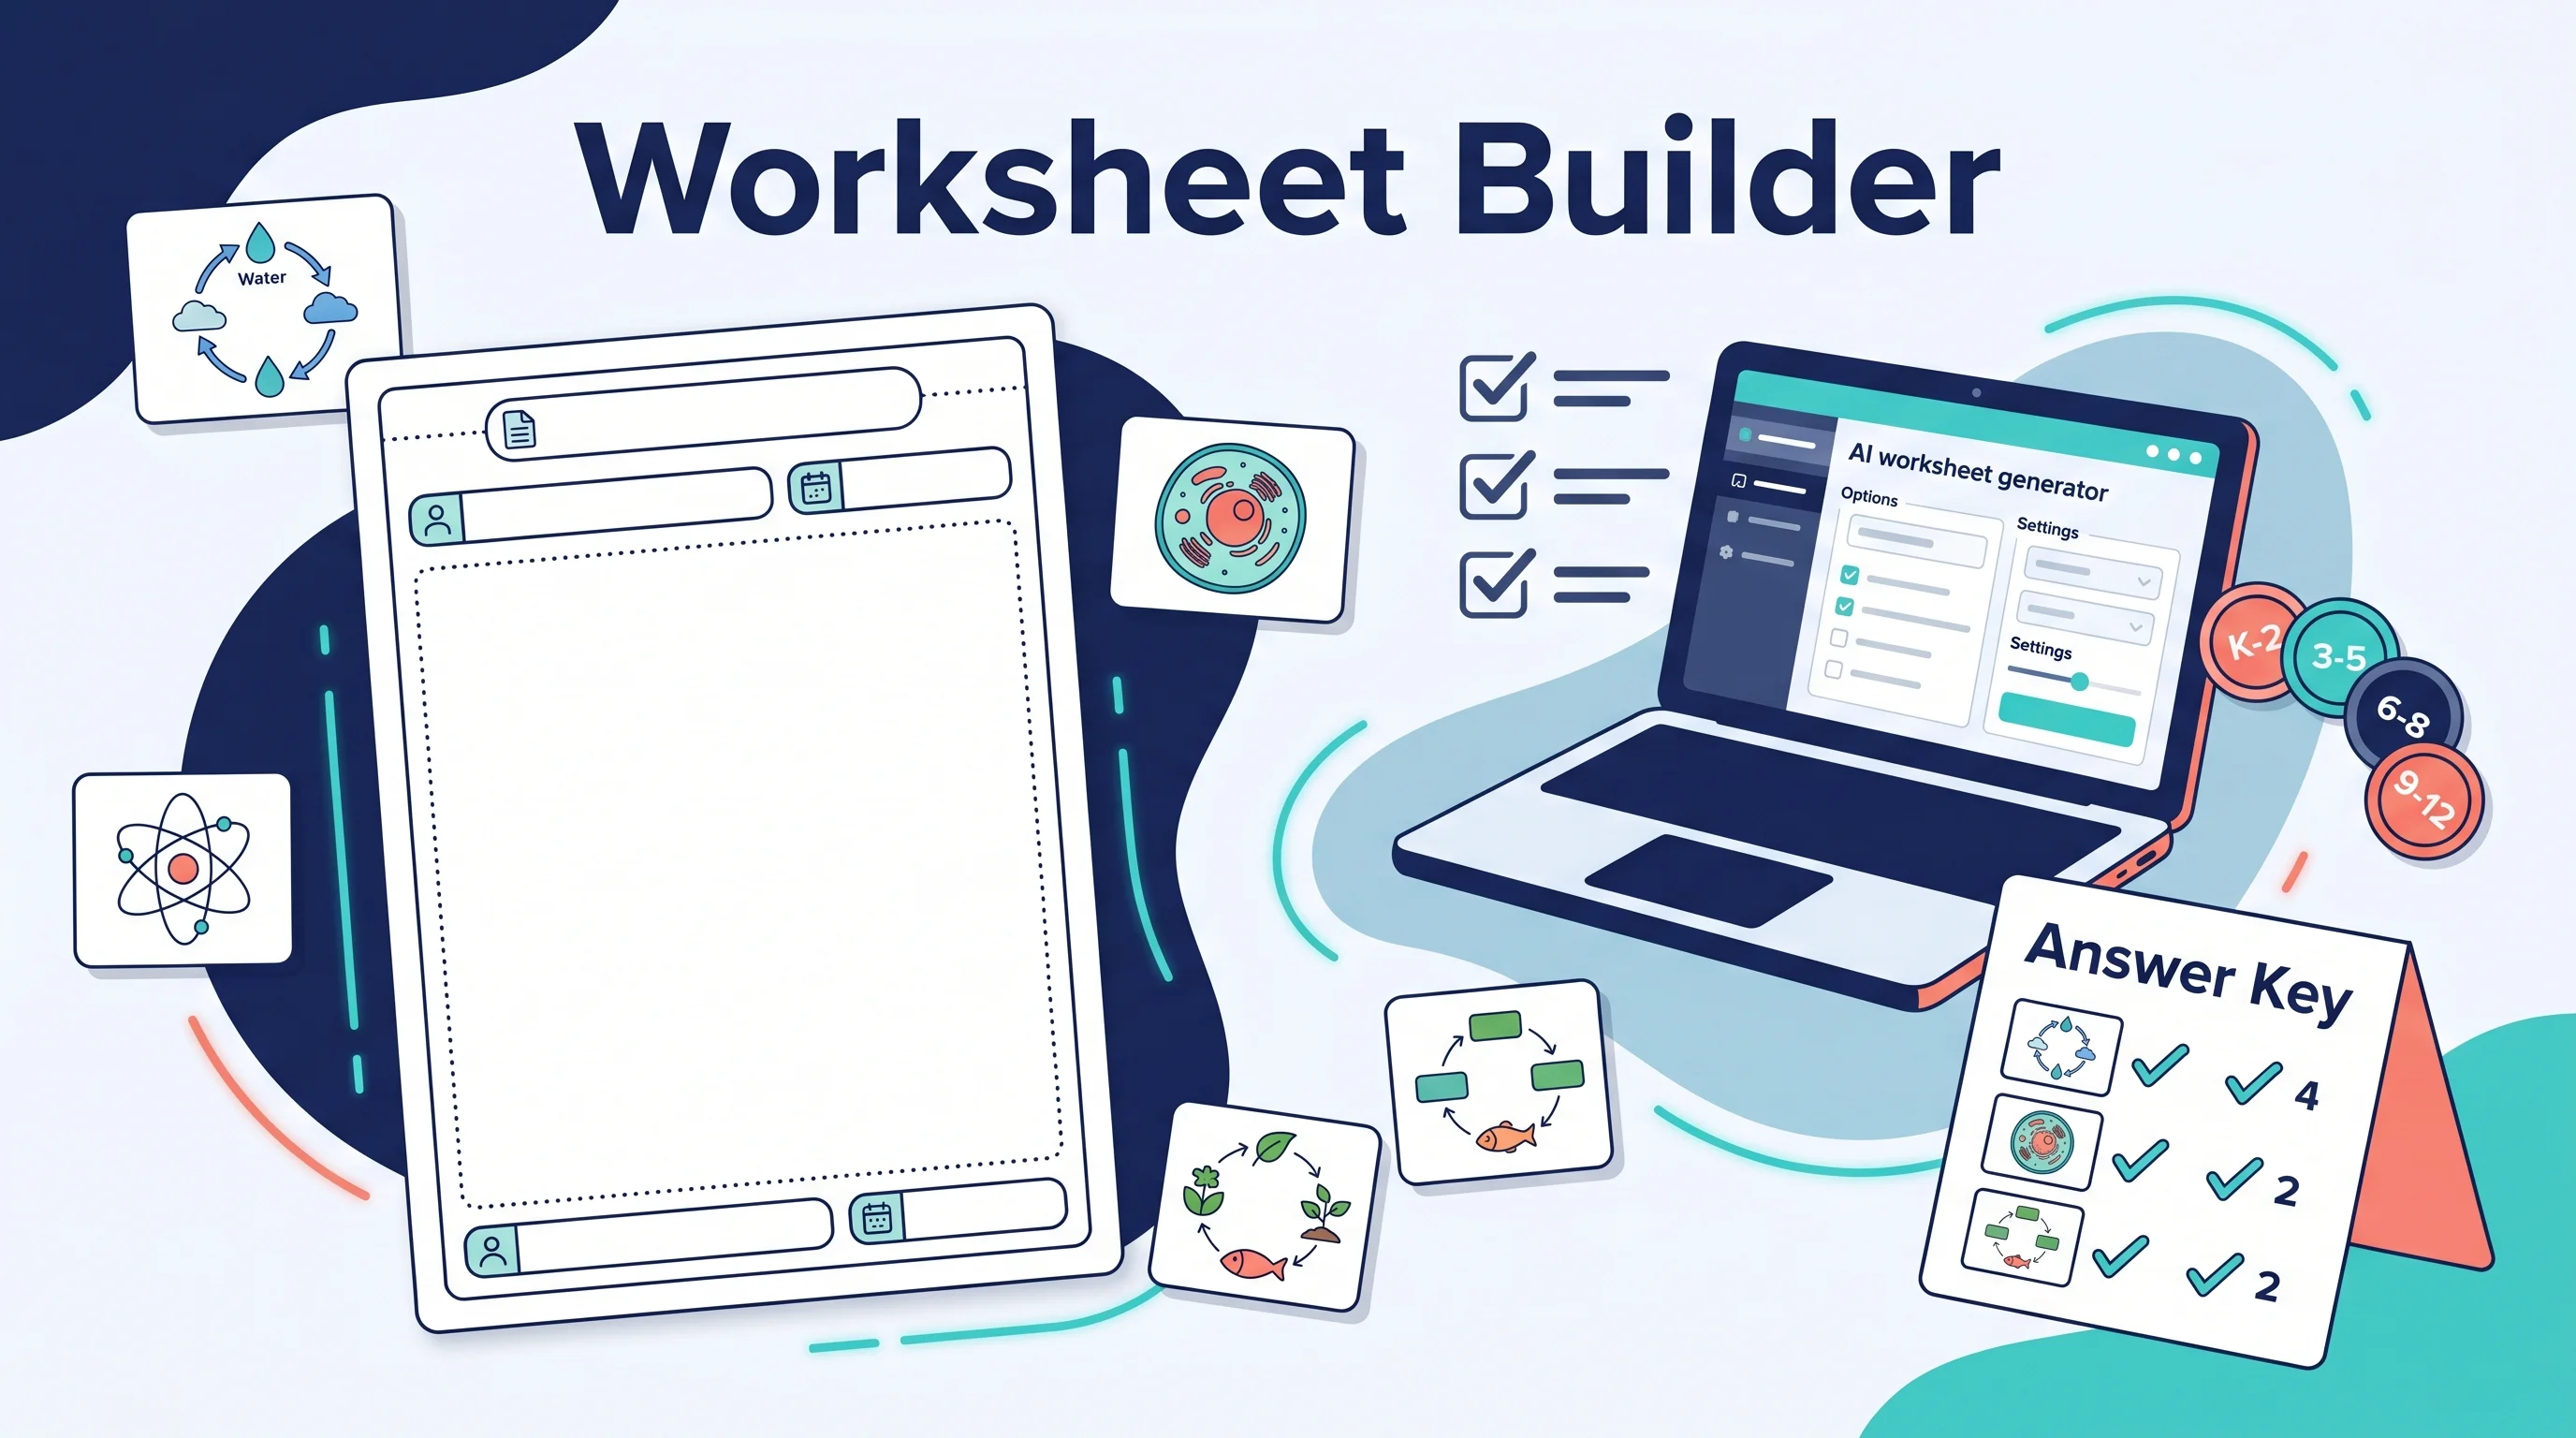
AI Worksheet Generator Guide: Printable Worksheets
Learn how to use an AI worksheet generator for printable classroom worksheets, answer keys, differentiation, diagrams, and teacher review workflows.
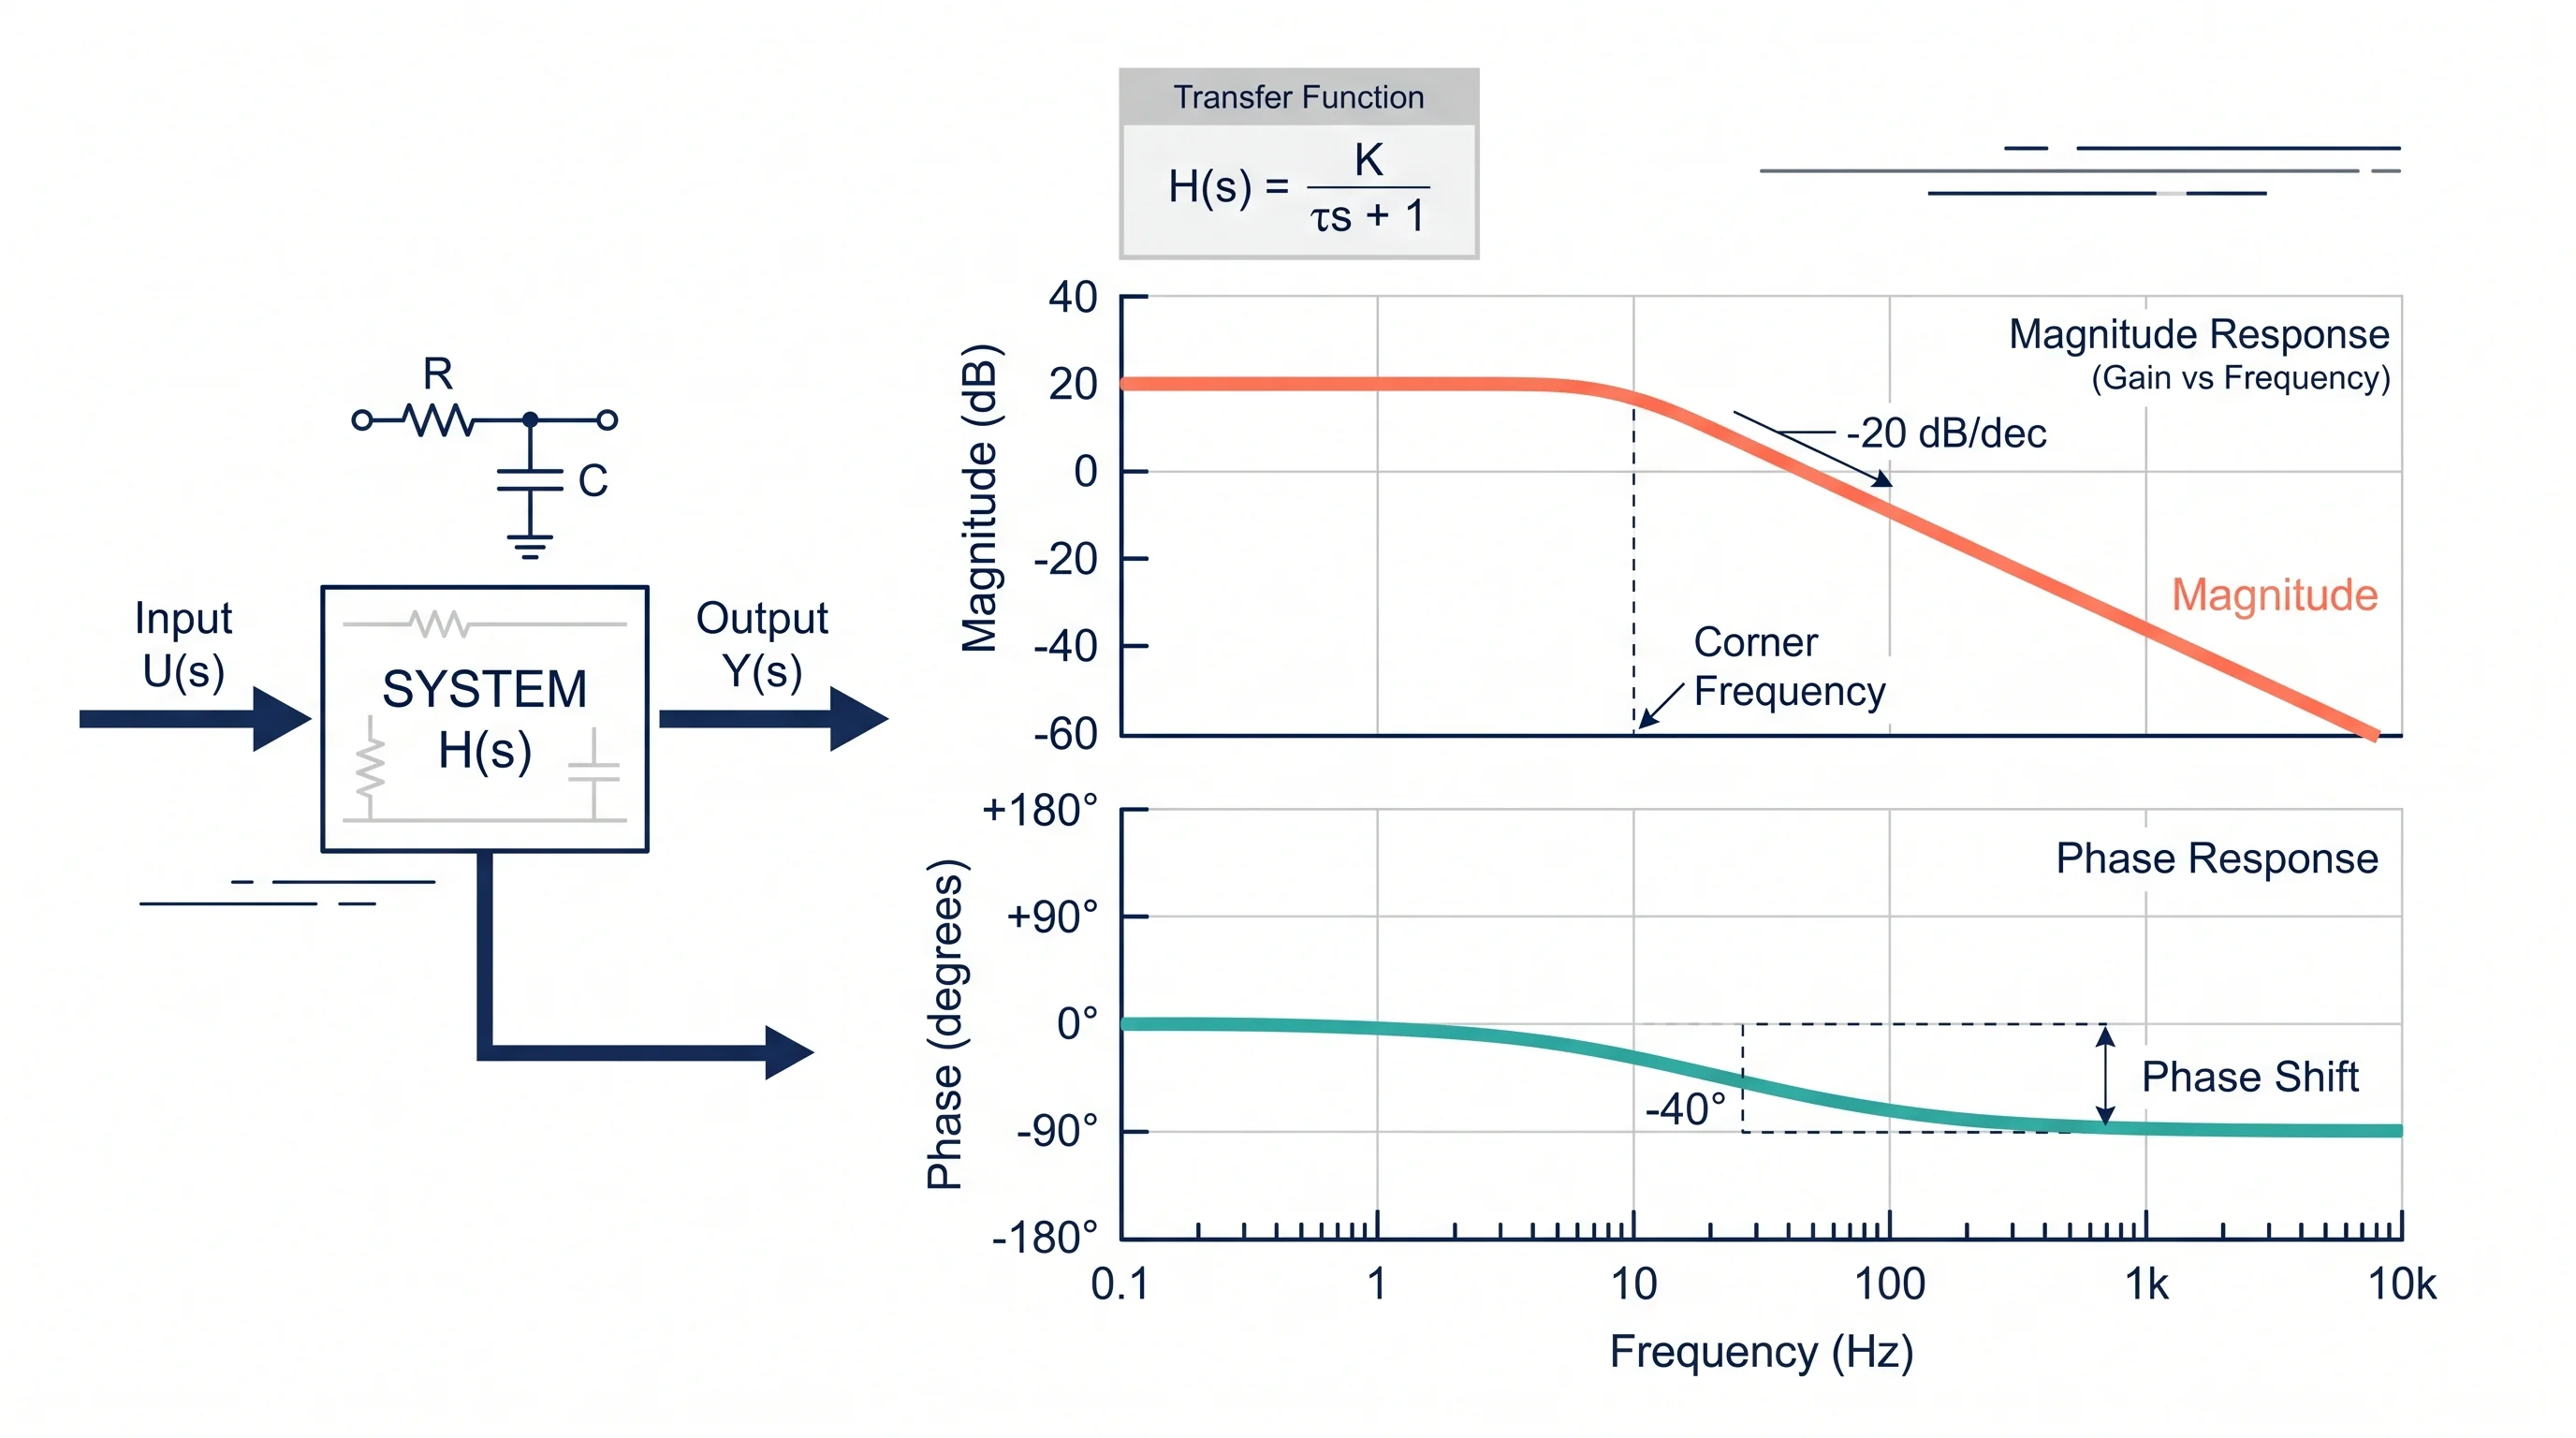
Bode Plot Generator Guide: Magnitude and Phase Plots
Learn how to use a Bode plot generator, enter transfer functions correctly, read magnitude and phase plots, and avoid common frequency-response mistakes.
How to Make a Histogram in Google Sheets: Step-by-Step
Learn how to make a histogram in Google Sheets, change bucket size, use frequency tables, fix common chart issues, and format a readable distribution chart.