Z-Score Calculator
Get a z-score from a raw score, mean and SD, or from a data set. See the percentile, the shaded bell curve and an APA sentence. Free, no sign-up.
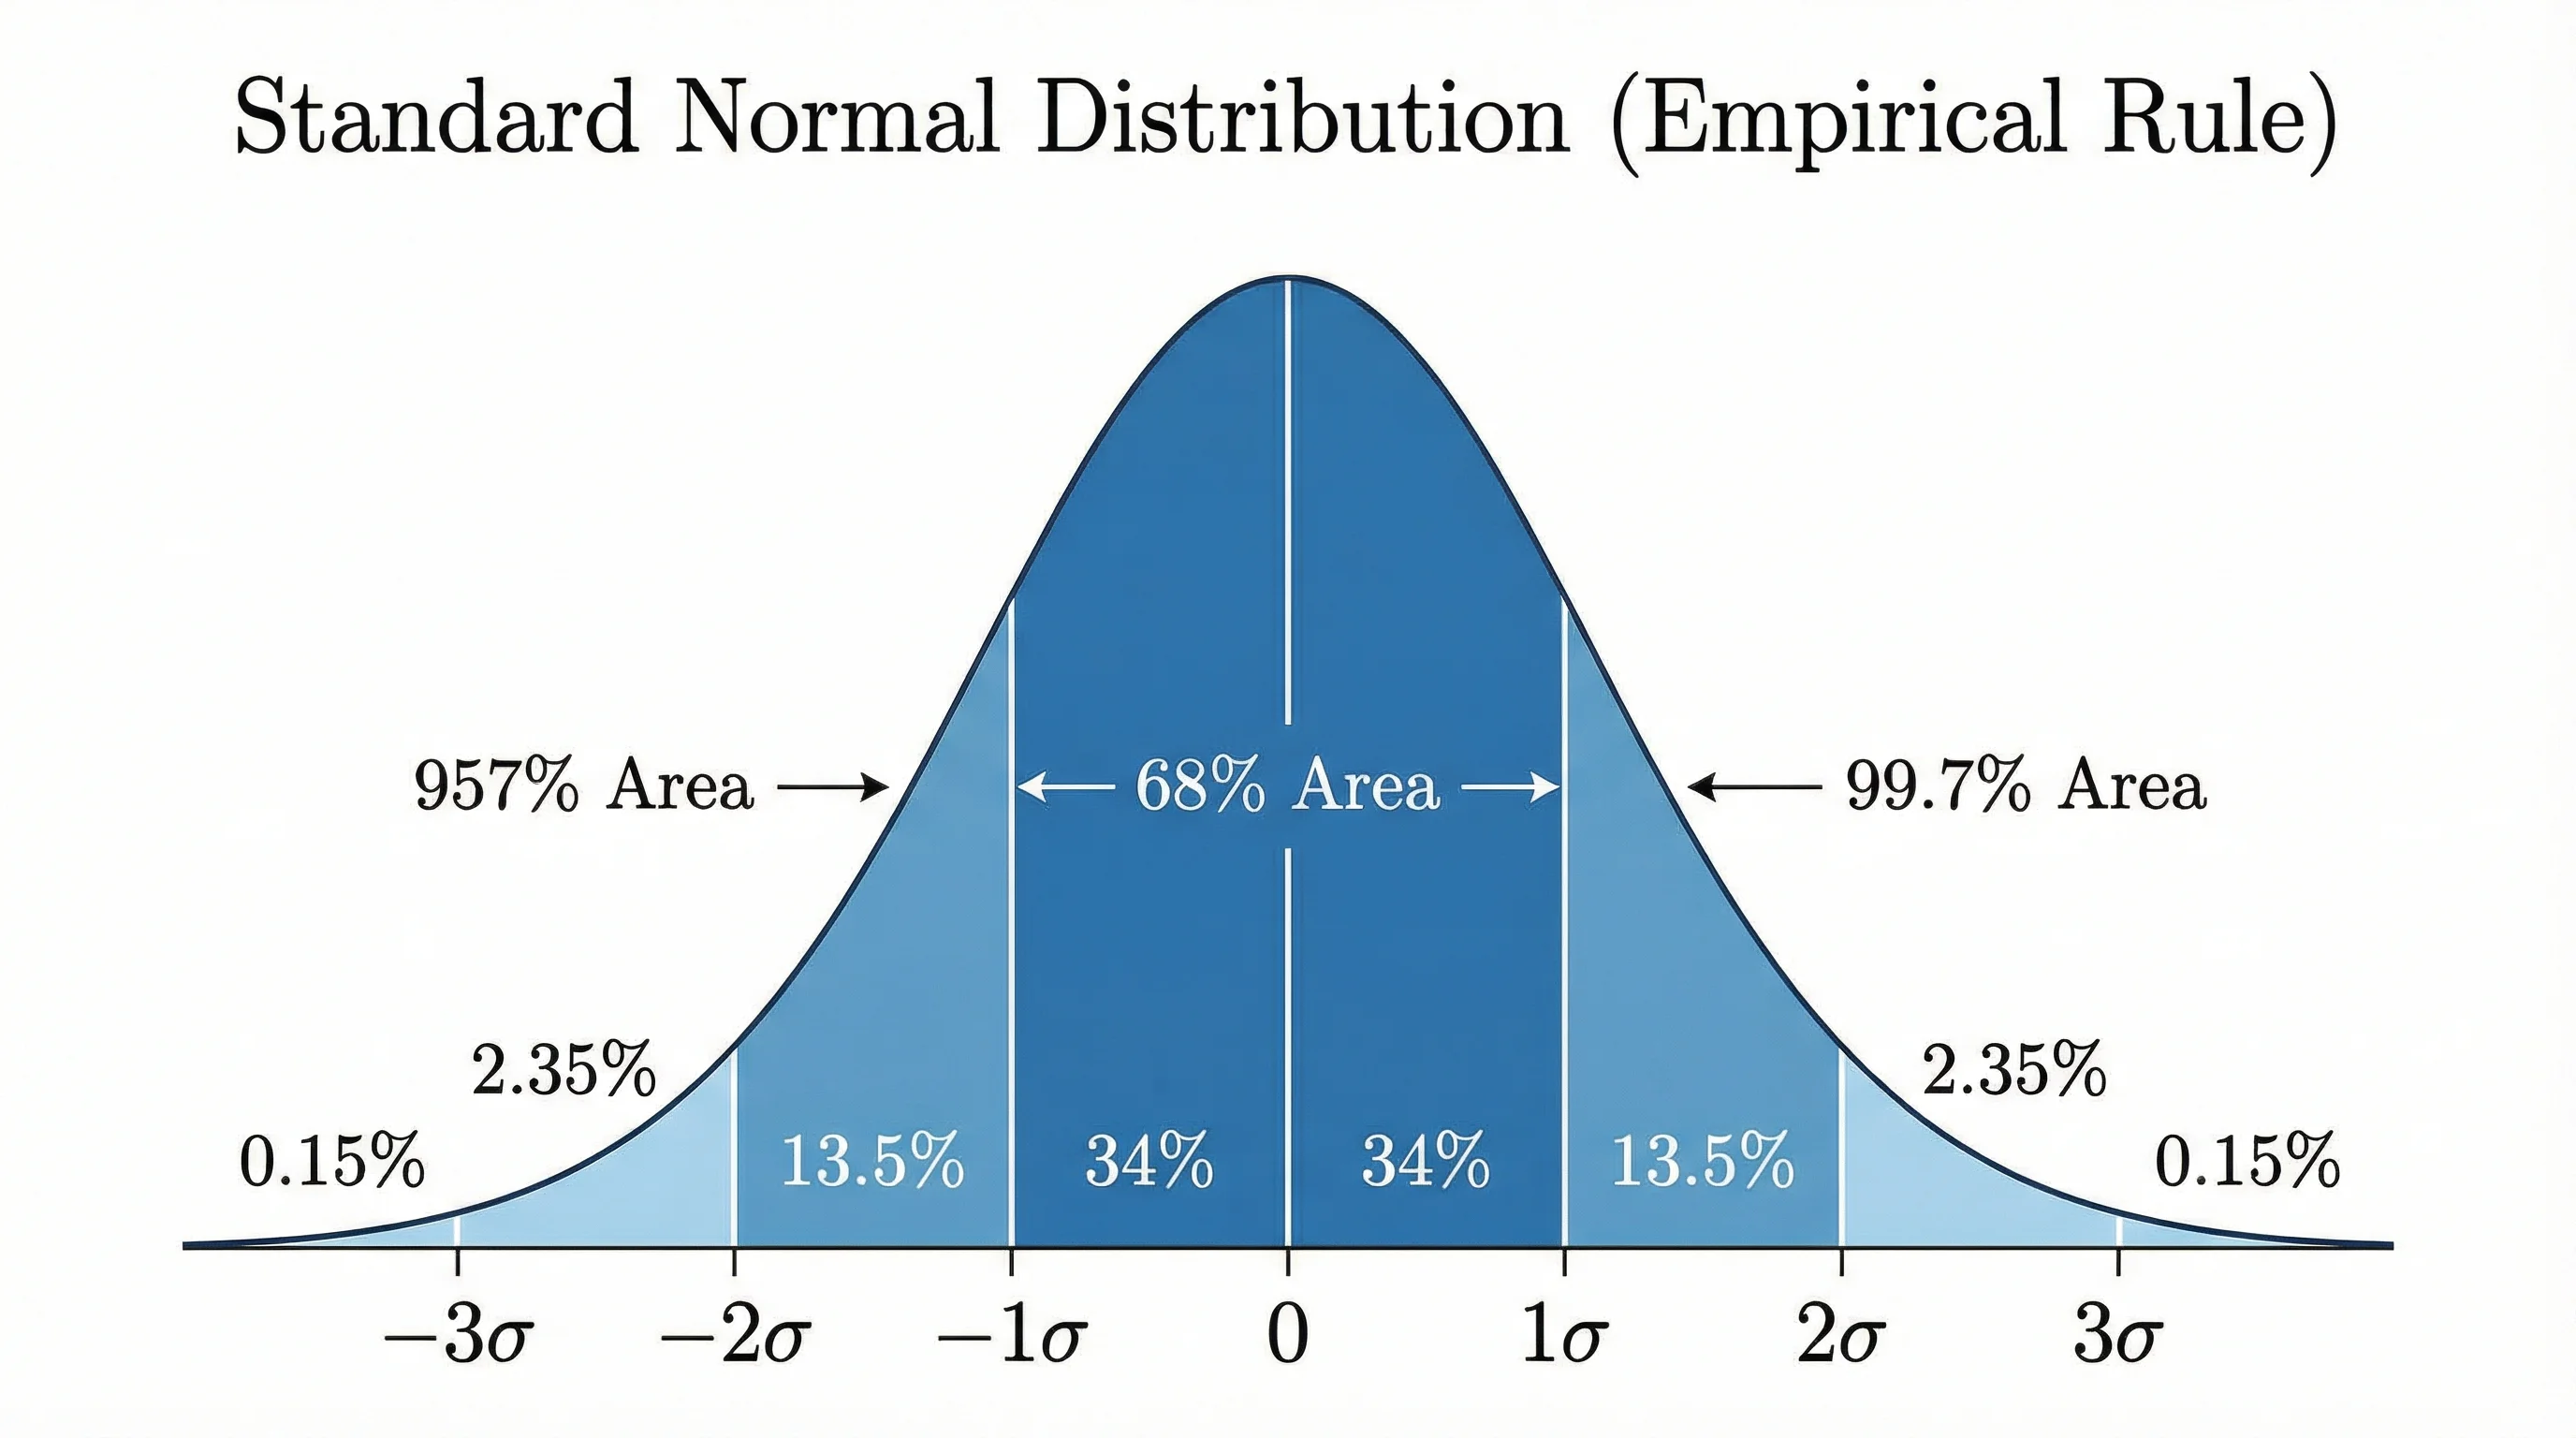 Need a bell curve with your own mean and SD?Open the Bell Curve Generator and shade the area you care about.
z-score
1.5000
Percentile (left tail)
93.3193%
Click a row to shade that area on the curve.
APA-style sentence
A score of 85 was 1.50 standard deviations above the mean (M = 70, SD = 10), z = 1.50, which falls at percentile 93.32.
What is a z-score?
A z-score, also called a standard score, says how many standard deviations a value lies above or below the mean. A z-score of 0 is exactly average, +1 is one standard deviation above the mean, and −2 is two below. Because it removes the original units, you can compare a test score with a height, or one exam with another, on the same scale. If the data are roughly normal, the z-score also tells you the percentile.
The z-score formula: population and sample
The formula is z = (x − μ) / σ, where x is the raw score, μ the mean and σ the standard deviation. When the numbers are the whole group, μ and σ are population values and σ divides by n. When the numbers are a sample, write x̄ and s, and s divides by n − 1. For the data 2, 4, 4, 4, 5, 5, 7, 9 the mean is 5, the population SD is 2.0000 and the sample SD is 2.1381, so the value 9 has z = 2.0000 with the population SD and 1.8708 with the sample SD. The Data set tab lets you switch between the two; the default is the sample SD.
Worked example: from raw score to percentile
A class has a mean of 70 and a standard deviation of 10, and you scored 85. Then z = (85 − 70) / 10 = 1.50. The area to the left of z = 1.50 is 0.9332, so you scored higher than about 93.32 percent of the class, percentile 93.32. The right tail, 0.0668, is the share who scored higher, and the two-tailed area 0.1336 is the share at least this far from the mean in either direction.
How to interpret a z-score
The sign tells you the direction and the size tells you the distance. Between −1 and 1 lies about 68.27 percent of a normal distribution, between −2 and 2 about 95.45 percent, and between −3 and 3 about 99.73 percent. An IQ of 130 on a scale with mean 100 and SD 15 has z = 2.00, which leaves 2.28 percent of people above it. A score of 650 on a scale with mean 500 and SD 100 has z = 1.50, percentile 93.32. Those scale parameters are illustrative; check the current norms for any real test.
Z-scores and percentiles
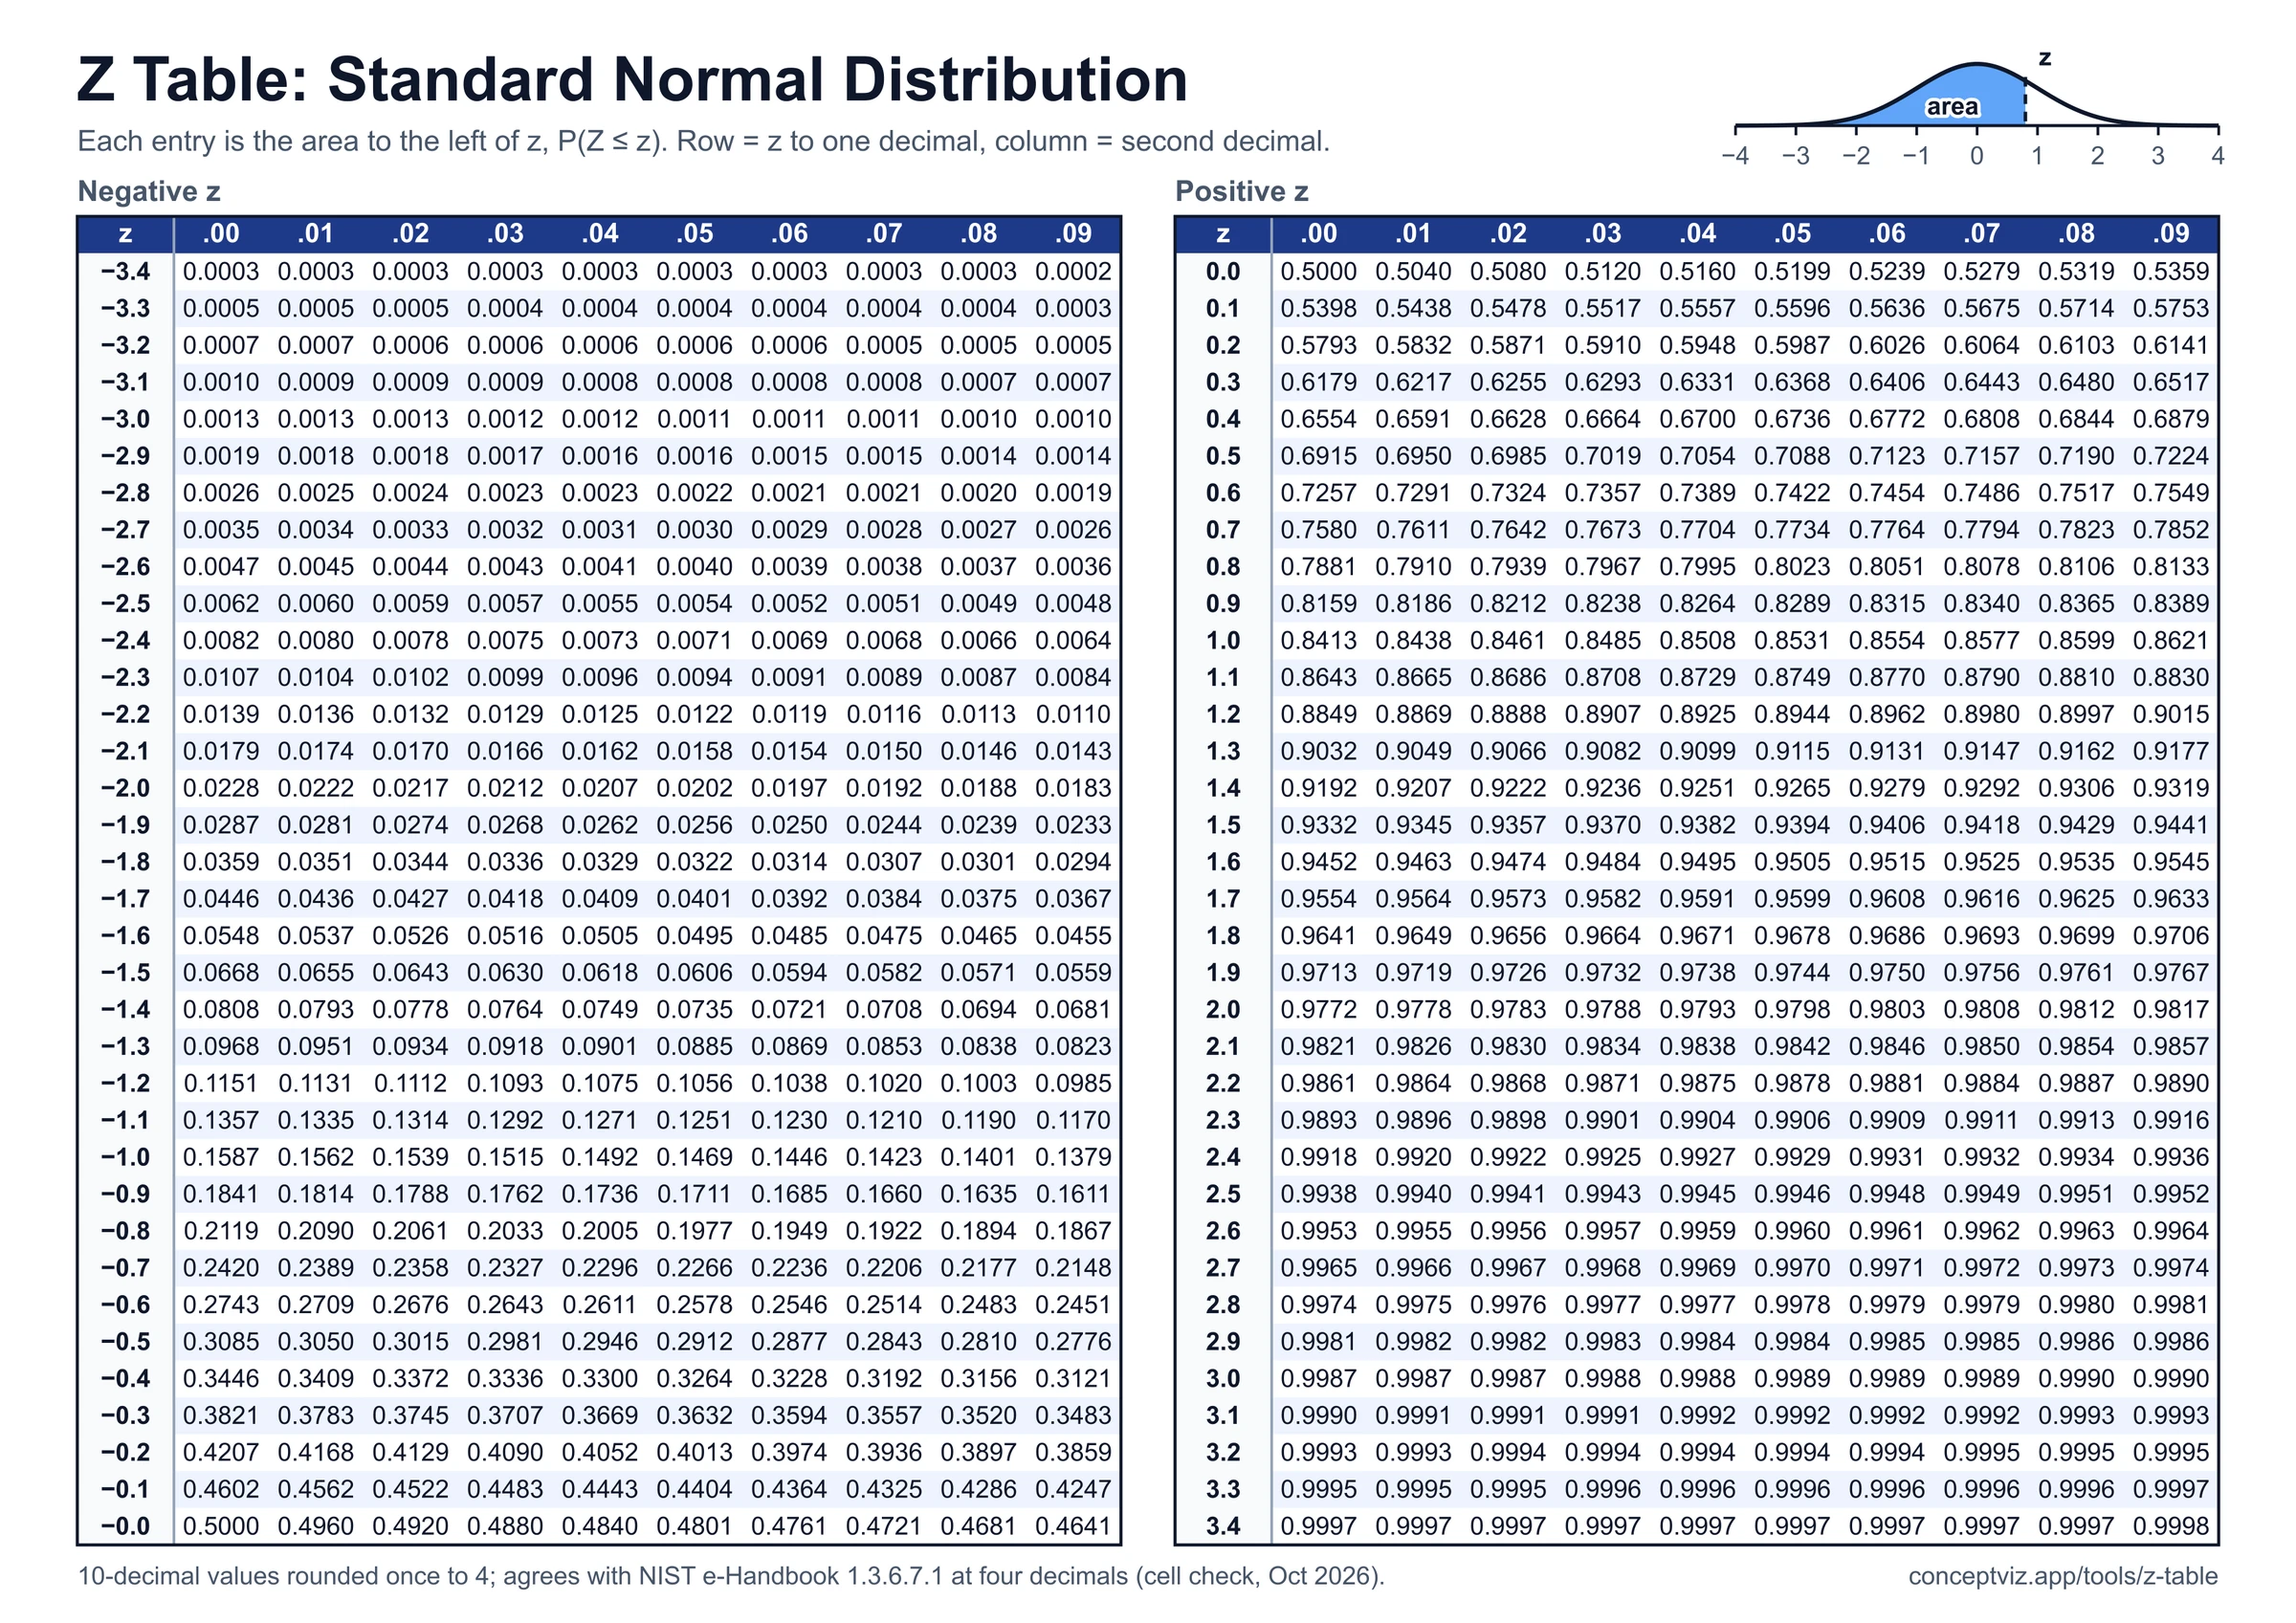
The percentile is the area to the left of z under the standard normal curve. Going the other way, the 90th percentile has z = 1.2816, so on a scale with mean 100 and SD 15 it is a score of 119.22. The middle 95 percent of a normal distribution runs from −1.960 to 1.960. For a full table of z values and areas to four decimals, use the z table; this page is built for turning your own numbers into a z-score and an area.
Outliers, and when a z-score does not apply
A common rule flags values with |z| above 2 as unusual and above 3 as rare. In a normal distribution about 4.55 percent of values fall beyond ±2 and 0.27 percent beyond ±3. The Data set tab marks both cut-offs. Two cautions: a single extreme value inflates the mean and the SD, which can hide itself, and the percentile reading only holds for roughly normal data. For skewed data, counts or proportions, the z-score still measures distance from the mean, but the normal curve is the wrong model for the percentile. Check a histogram first.
Frequently Asked Questions
Z-Score Examples and Reference Charts
Every chart below is drawn by the same code as the calculator. View, download and print them free, no sign-up.
Z-Score Worked Example: Exam Score
A raw score becomes a z score and a percentile, with the left-tail area shaded.
Worked examples
Reference charts
Need exact areas for a z value to four decimals? The z table lists them for z from −3.49 to 3.49, with a z to p and p to z calculator. For small samples with an estimated SD, use the t table instead. To compare spread between groups, see the coefficient of variation calculator.
Not sure which table matches your test? The statistics tables guide picks the right z, t, chi-square or F table, and the histogram maker shows whether your data look normal.
Related Statistics Tools
 Research
Z Table
Z table with positive and negative z-scores, left-tail cumulative area, z to p and p to z calculator, shaded curve and printable A4 and Letter sheets.
ResearchBell Curve Generator
Draw a normal distribution with your own mean and standard deviation and shade the area you care about.
 Research
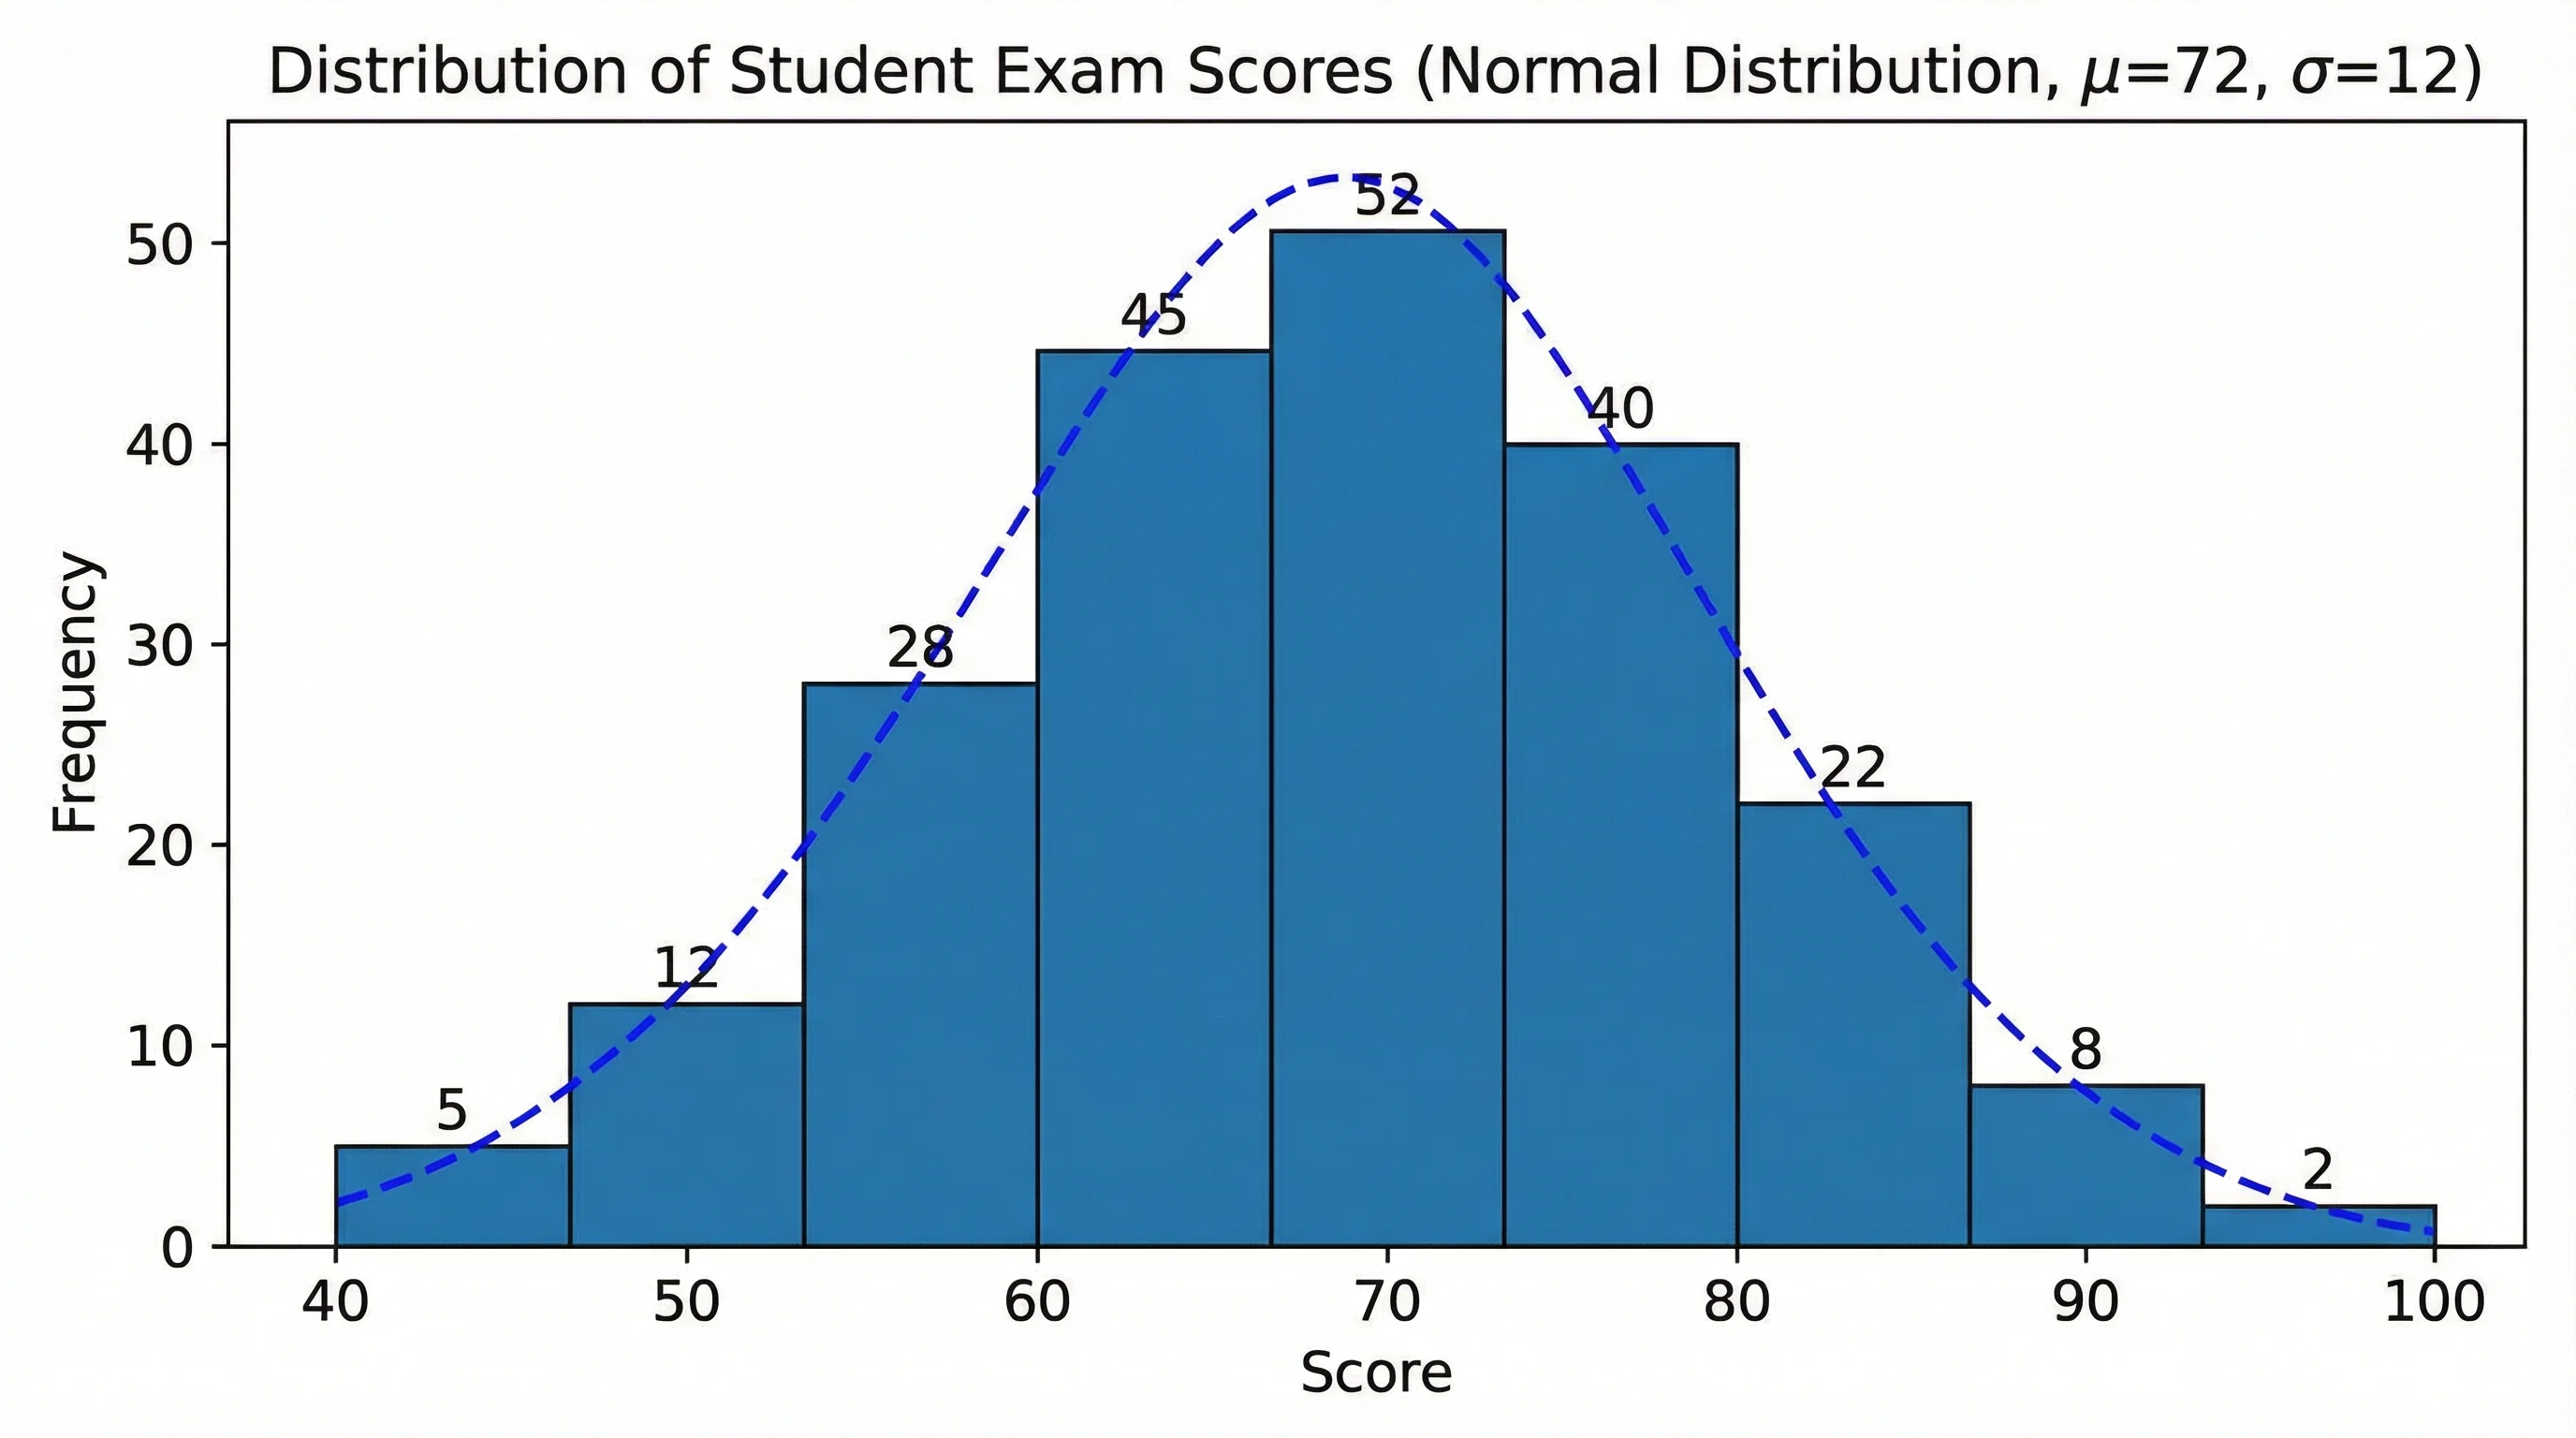
AI Histogram Maker
Turn your data into a histogram and check whether it looks normal before you trust a percentile.
 Research
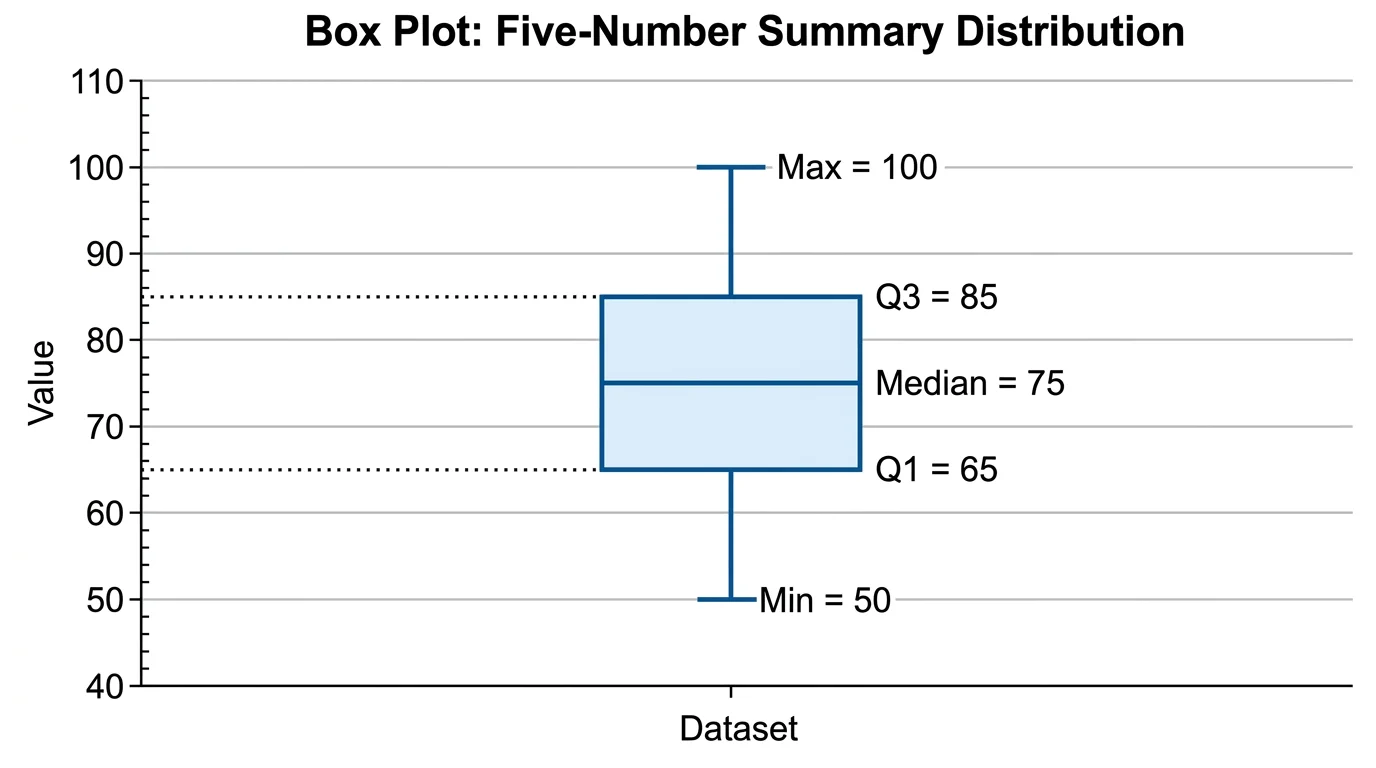
Box Plot Generator
Compare groups with quartiles and outliers in a clean box-and-whisker diagram.
 Research
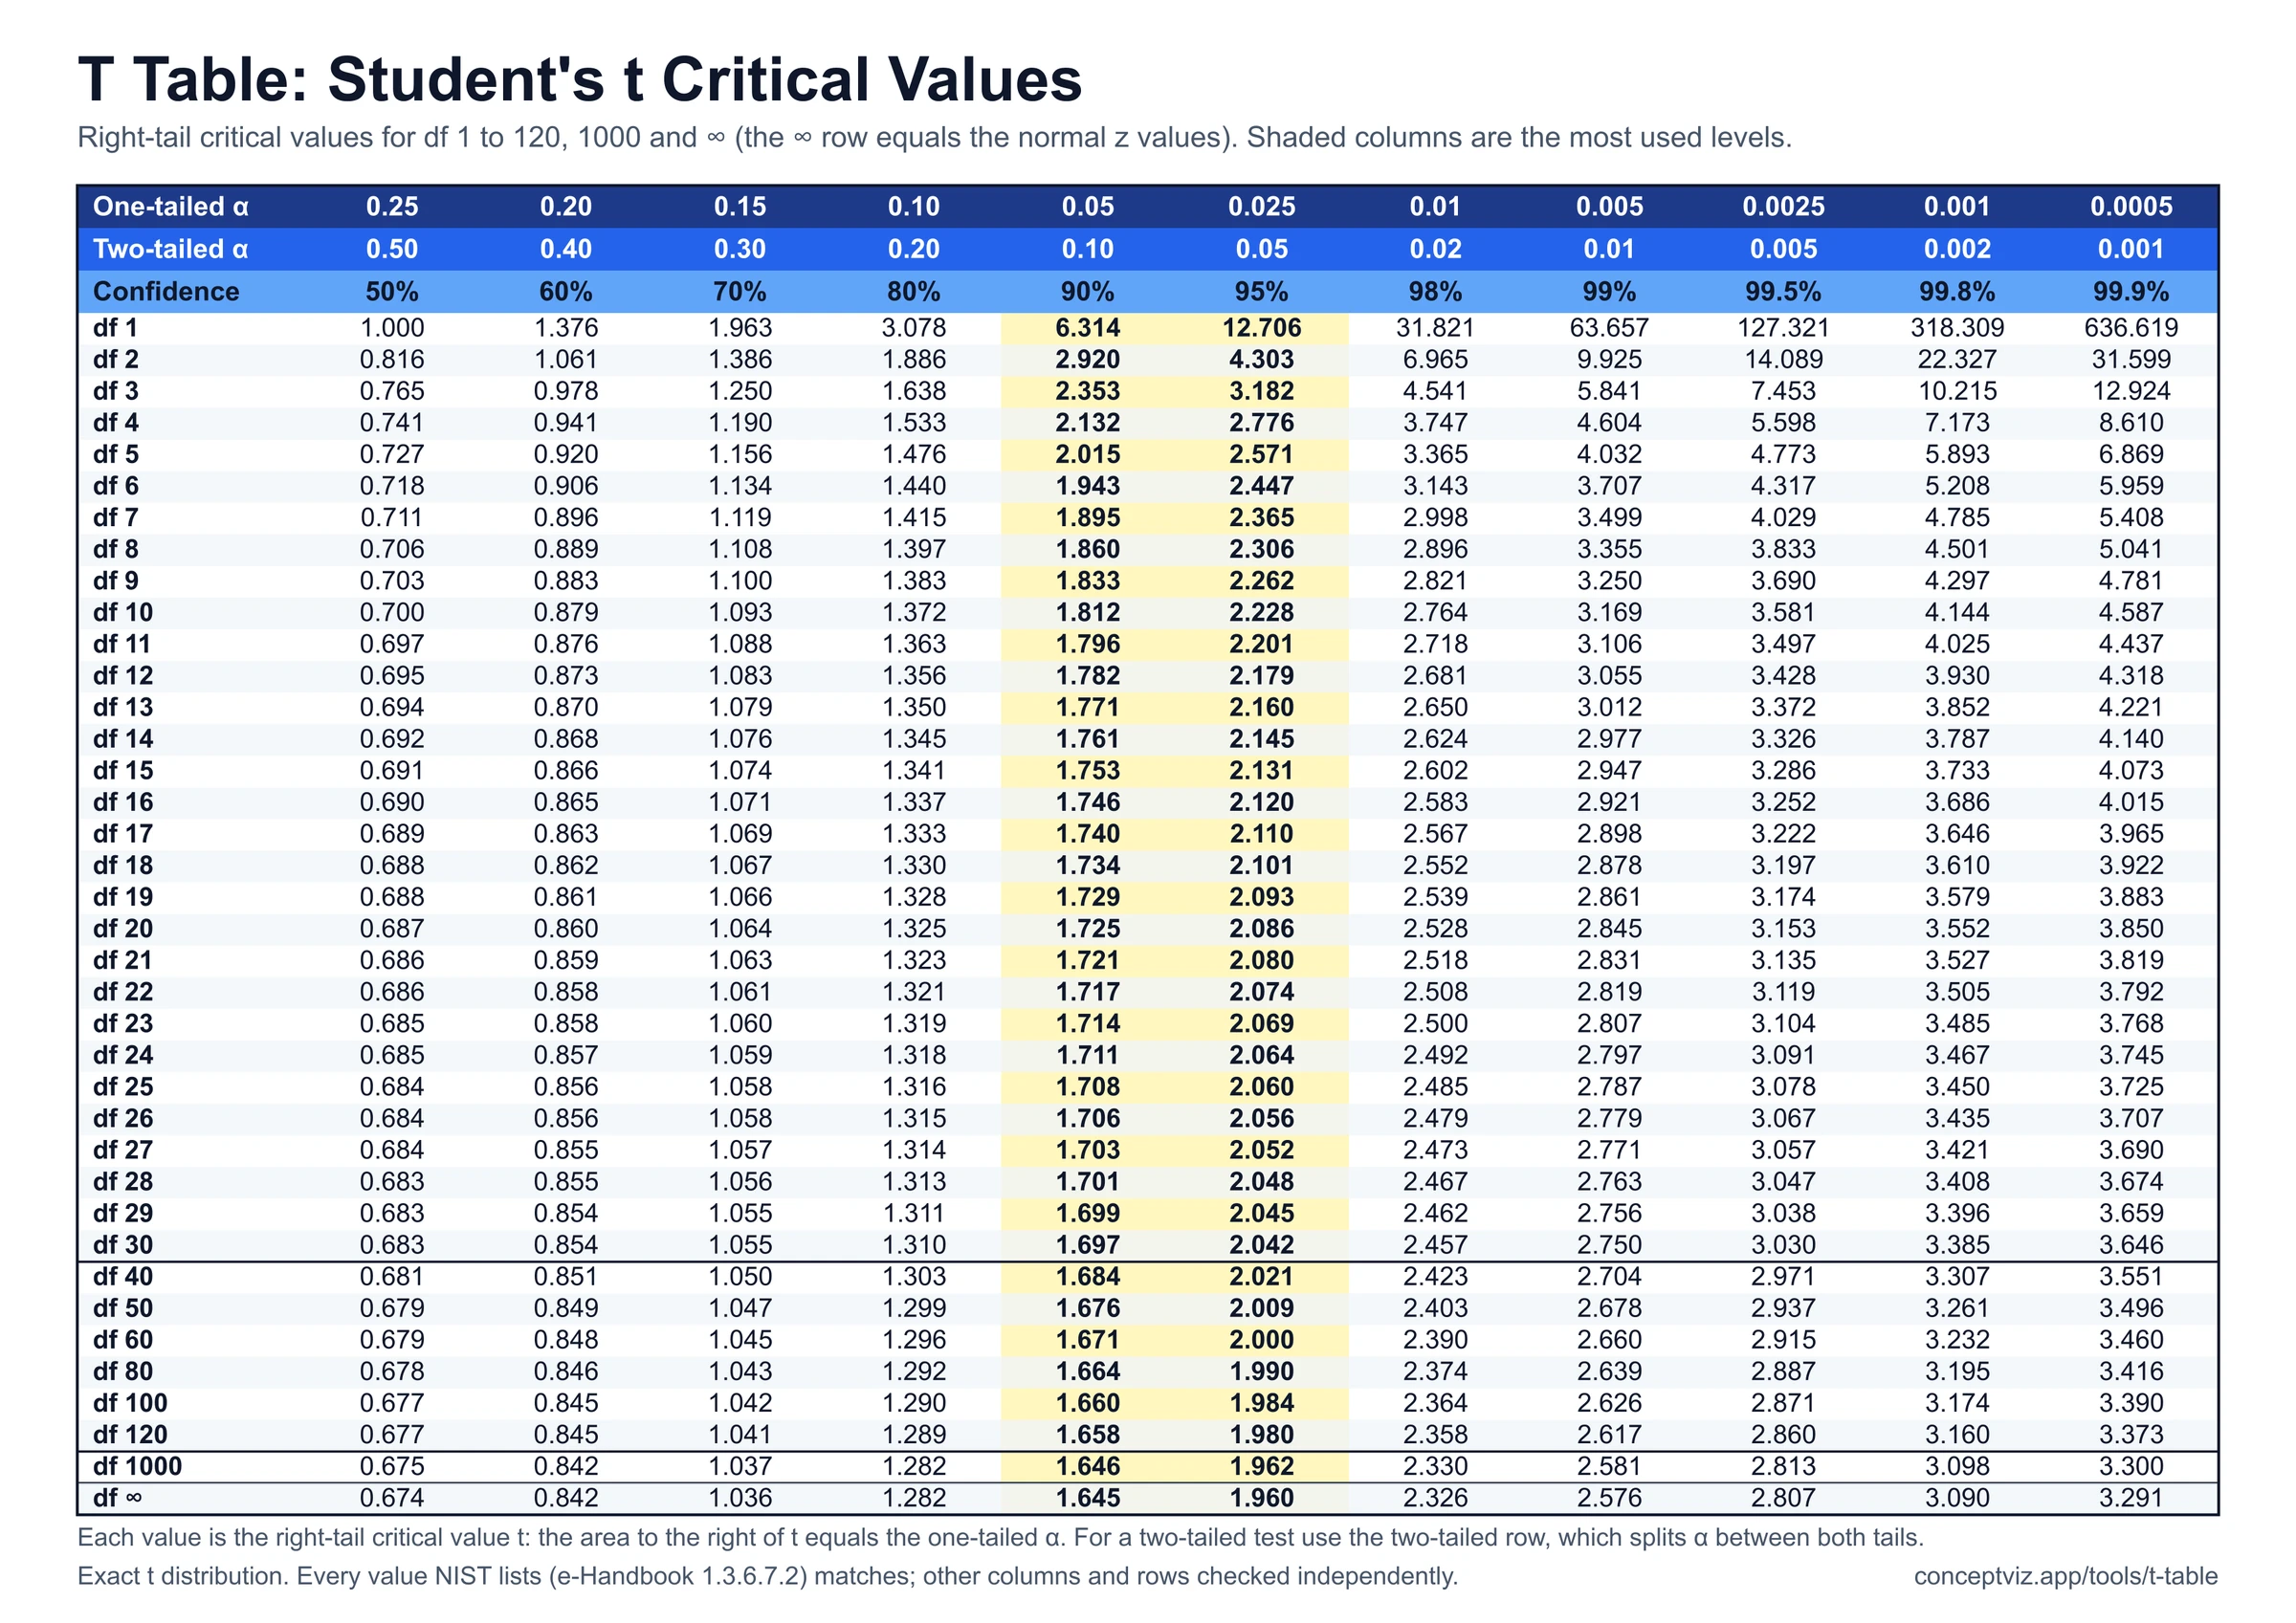
T Table
T table with one-tailed and two-tailed critical values for df 1 to 120 and infinity, a critical value and p-value calculator, and printable sheets.
 Research
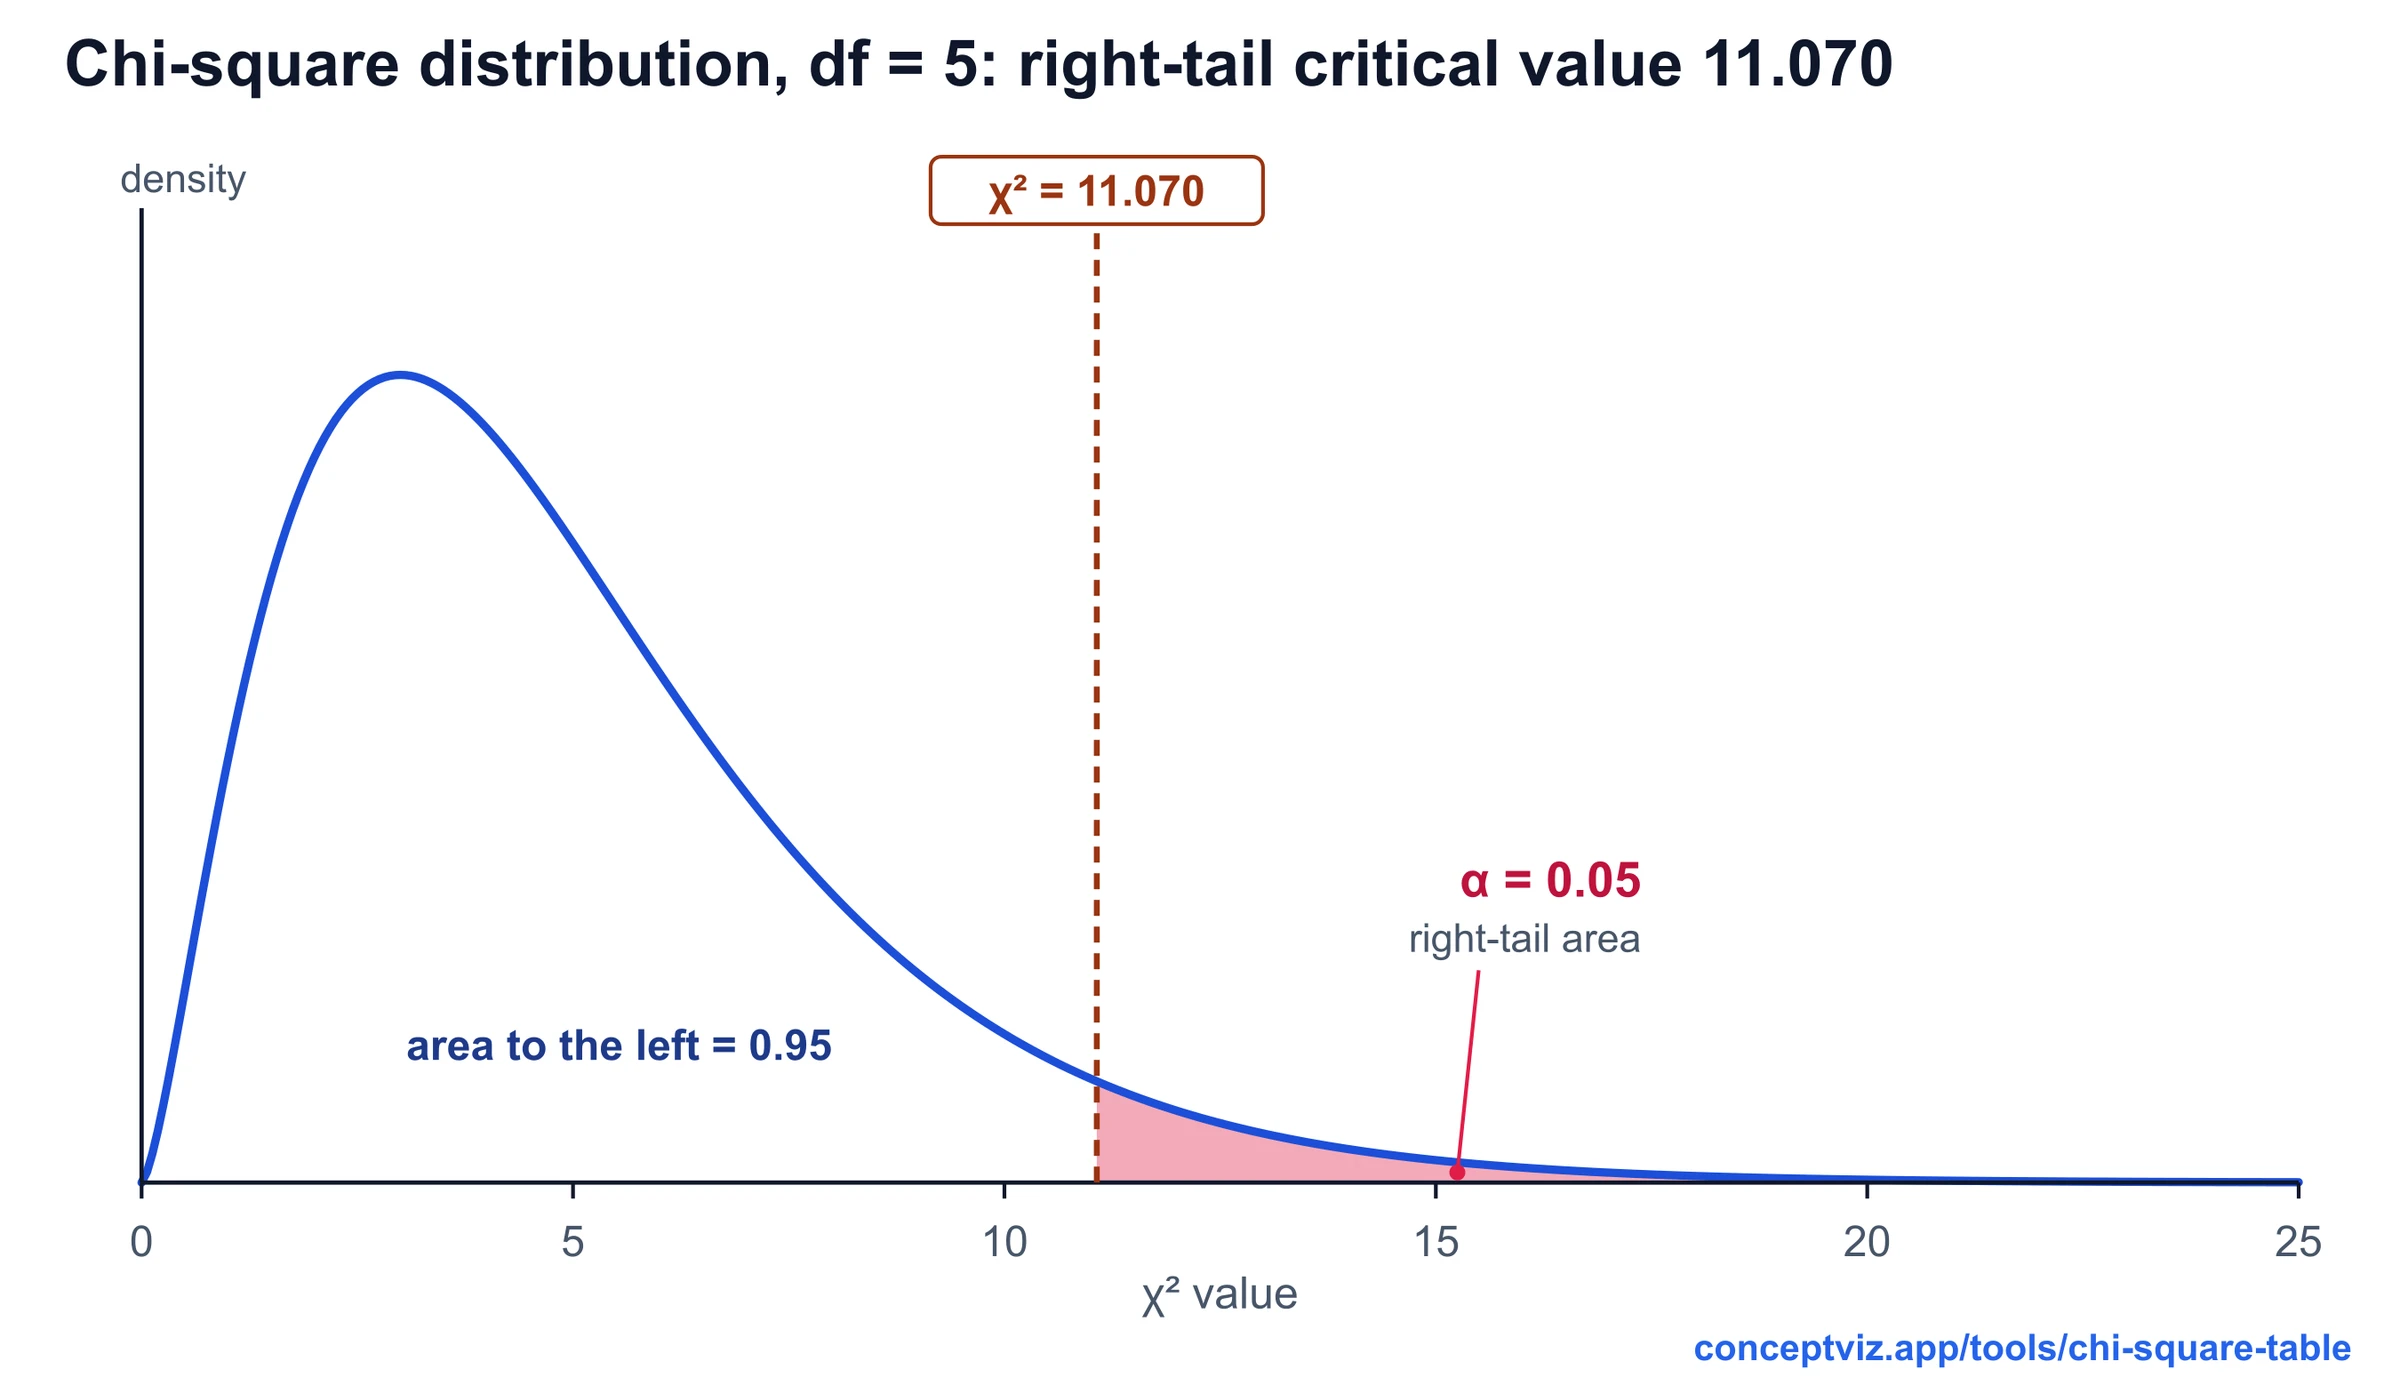
Chi-Square Table
Chi-square table with right-tail critical values for df 1 to 100, a p-value calculator with shaded area and lower-tail columns. Print or download.