T Table (Student's t Distribution)
T table with one-tailed and two-tailed critical values for df 1 to 120 and infinity, a critical value and p-value calculator, and printable sheets.
Every value is the right-tail critical value: the area under the t curve to the right of the value equals the one-tailed α in the first header row. For a two-tailed test, read the second header row, which splits α between both tails.
| One-tailed α | 0.25 | 0.20 | 0.15 | 0.10 | 0.05 | 0.025 | 0.01 | 0.005 | 0.0025 | 0.001 | 0.0005 |
|---|---|---|---|---|---|---|---|---|---|---|---|
| Two-tailed α | 0.50 | 0.40 | 0.30 | 0.20 | 0.10 | 0.05 | 0.02 | 0.01 | 0.005 | 0.002 | 0.001 |
| Confidence | 50% | 60% | 70% | 80% | 90% | 95% | 98% | 99% | 99.5% | 99.8% | 99.9% |
| df 1 | |||||||||||
| df 2 | |||||||||||
| df 3 | |||||||||||
| df 4 | |||||||||||
| df 5 | |||||||||||
| df 6 | |||||||||||
| df 7 | |||||||||||
| df 8 | |||||||||||
| df 9 | |||||||||||
| df 10 | |||||||||||
| df 11 | |||||||||||
| df 12 | |||||||||||
| df 13 | |||||||||||
| df 14 | |||||||||||
| df 15 | |||||||||||
| df 16 | |||||||||||
| df 17 | |||||||||||
| df 18 | |||||||||||
| df 19 | |||||||||||
| df 20 | |||||||||||
| df 21 | |||||||||||
| df 22 | |||||||||||
| df 23 | |||||||||||
| df 24 | |||||||||||
| df 25 | |||||||||||
| df 26 | |||||||||||
| df 27 | |||||||||||
| df 28 | |||||||||||
| df 29 | |||||||||||
| df 30 | |||||||||||
| df 40 | |||||||||||
| df 50 | |||||||||||
| df 60 | |||||||||||
| df 80 | |||||||||||
| df 100 | |||||||||||
| df 120 | |||||||||||
| df 1000 | |||||||||||
| df ∞ |
Click any value to see its area. The ∞ row equals the normal (z) critical values. For a df that is not listed, use the next smaller df or .
Selected value
2.228
With df = 10, a one-tailed test at α = 0.025 (or a two-tailed test at α = 0.05, a 95% confidence interval) rejects the null hypothesis when t is beyond 2.228.
Free T Tables and Study Sheets
Every sheet below is drawn by the same code as the table above, with values computed from the exact t distribution. View, download and print them free, no sign-up.
T Table: Student's t Critical Values, df 1 to ∞
All 38 rows and 11 levels on one landscape page, with the most used columns shaded.
Reference tables
Printer friendly
Study aids
What is a t table?
A t table lists critical values of Student's t distribution. The t distribution describes the standardized sample mean (the t statistic) when the population standard deviation is unknown and has to be estimated from the data, which is the usual situation in a lab report or a statistics course. Its shape depends on the degrees of freedom (df). With few degrees of freedom the curve has heavy tails, so you need a larger t to reach the same significance. The table gives the value t* that cuts off a chosen area in the right tail, computed here from the exact distribution function. Every value that the NIST e-Handbook table lists matches, and the other columns and rows were checked independently.
How to read the t table
- Find the row for your degrees of freedom. If your df is not listed, use the next smaller row, which is slightly conservative, or use the calculator above for the exact value.
- Choose the header row that matches your test. One-tailed α is for a directional hypothesis (greater than or less than). Two-tailed α is for "different from". The two rows sit in the same column, so one-tailed 0.05 and two-tailed 0.10 give the same number, 1.812 for df = 10, while two-tailed 0.05 gives 2.228.
- Compare the absolute value of your t statistic with the table value. If |t| is larger, the result is significant at that level. The bottom row, ∞, is the standard normal distribution, so it equals the familiar z values 1.645, 1.960 and 2.576.
One-tailed or two-tailed?
Use a two-tailed test unless you decided before collecting data that only one direction matters, for example testing whether a new method is faster, not just different. A two-tailed test at α = 0.05 puts 0.025 in each tail, so it needs a larger |t| than a one-tailed test at the same α. Picking the tail after seeing the data inflates the false positive rate, so choose it from the research question and state it in the methods section.
How to find the degrees of freedom
- One sample t test: df = n − 1, where n is the sample size.
- Paired samples t test: df = n − 1, where n is the number of pairs, because the test works on the differences.
- Independent samples with equal variances: df = n1 + n2 − 2. With unequal variances, Welch’s approximation gives a non-integer df that software reports. Round it down to use the table, or use software for the exact value.
- Simple linear regression slope: df = n − 2.
Worked example: a 95% confidence interval
A sample of 25 measurements has mean 52.4 and standard deviation 6.8. The standard error is 6.8 ÷ √25 = 1.360 and df = 24. For 95% confidence, read two-tailed α = 0.05 in the df = 24 row: t* = 2.064. The margin of error is 2.064 × 1.360 = 2.807, so the interval is 49.59 to 55.21. To test whether the true mean is 50, t = (52.4 − 50) ÷ 1.360 = 1.765. Because 1.765 is smaller than 2.064, the result is not significant at 0.05, and the calculator gives a two-tailed p-value of 0.0903.
t versus z: when the table becomes the normal table
As df grows, the t distribution approaches the standard normal distribution. For a 95% two-tailed test the critical value falls from 12.706 at df = 1 to 2.228 at df = 10, 1.980 at df = 120 and 1.960 at ∞. Use z only when the population standard deviation is known, or when the sample is so large that the difference does not matter. Whenever the standard deviation is estimated from the sample, the t table is the correct choice, whatever the sample size.
Frequently Asked Questions
Working with the normal distribution? Z table. Testing counts in categories? Chi-square table. Want to draw the normal curve that the ∞ row describes? Use the bell curve generator.
Related Statistics Tools
 Research
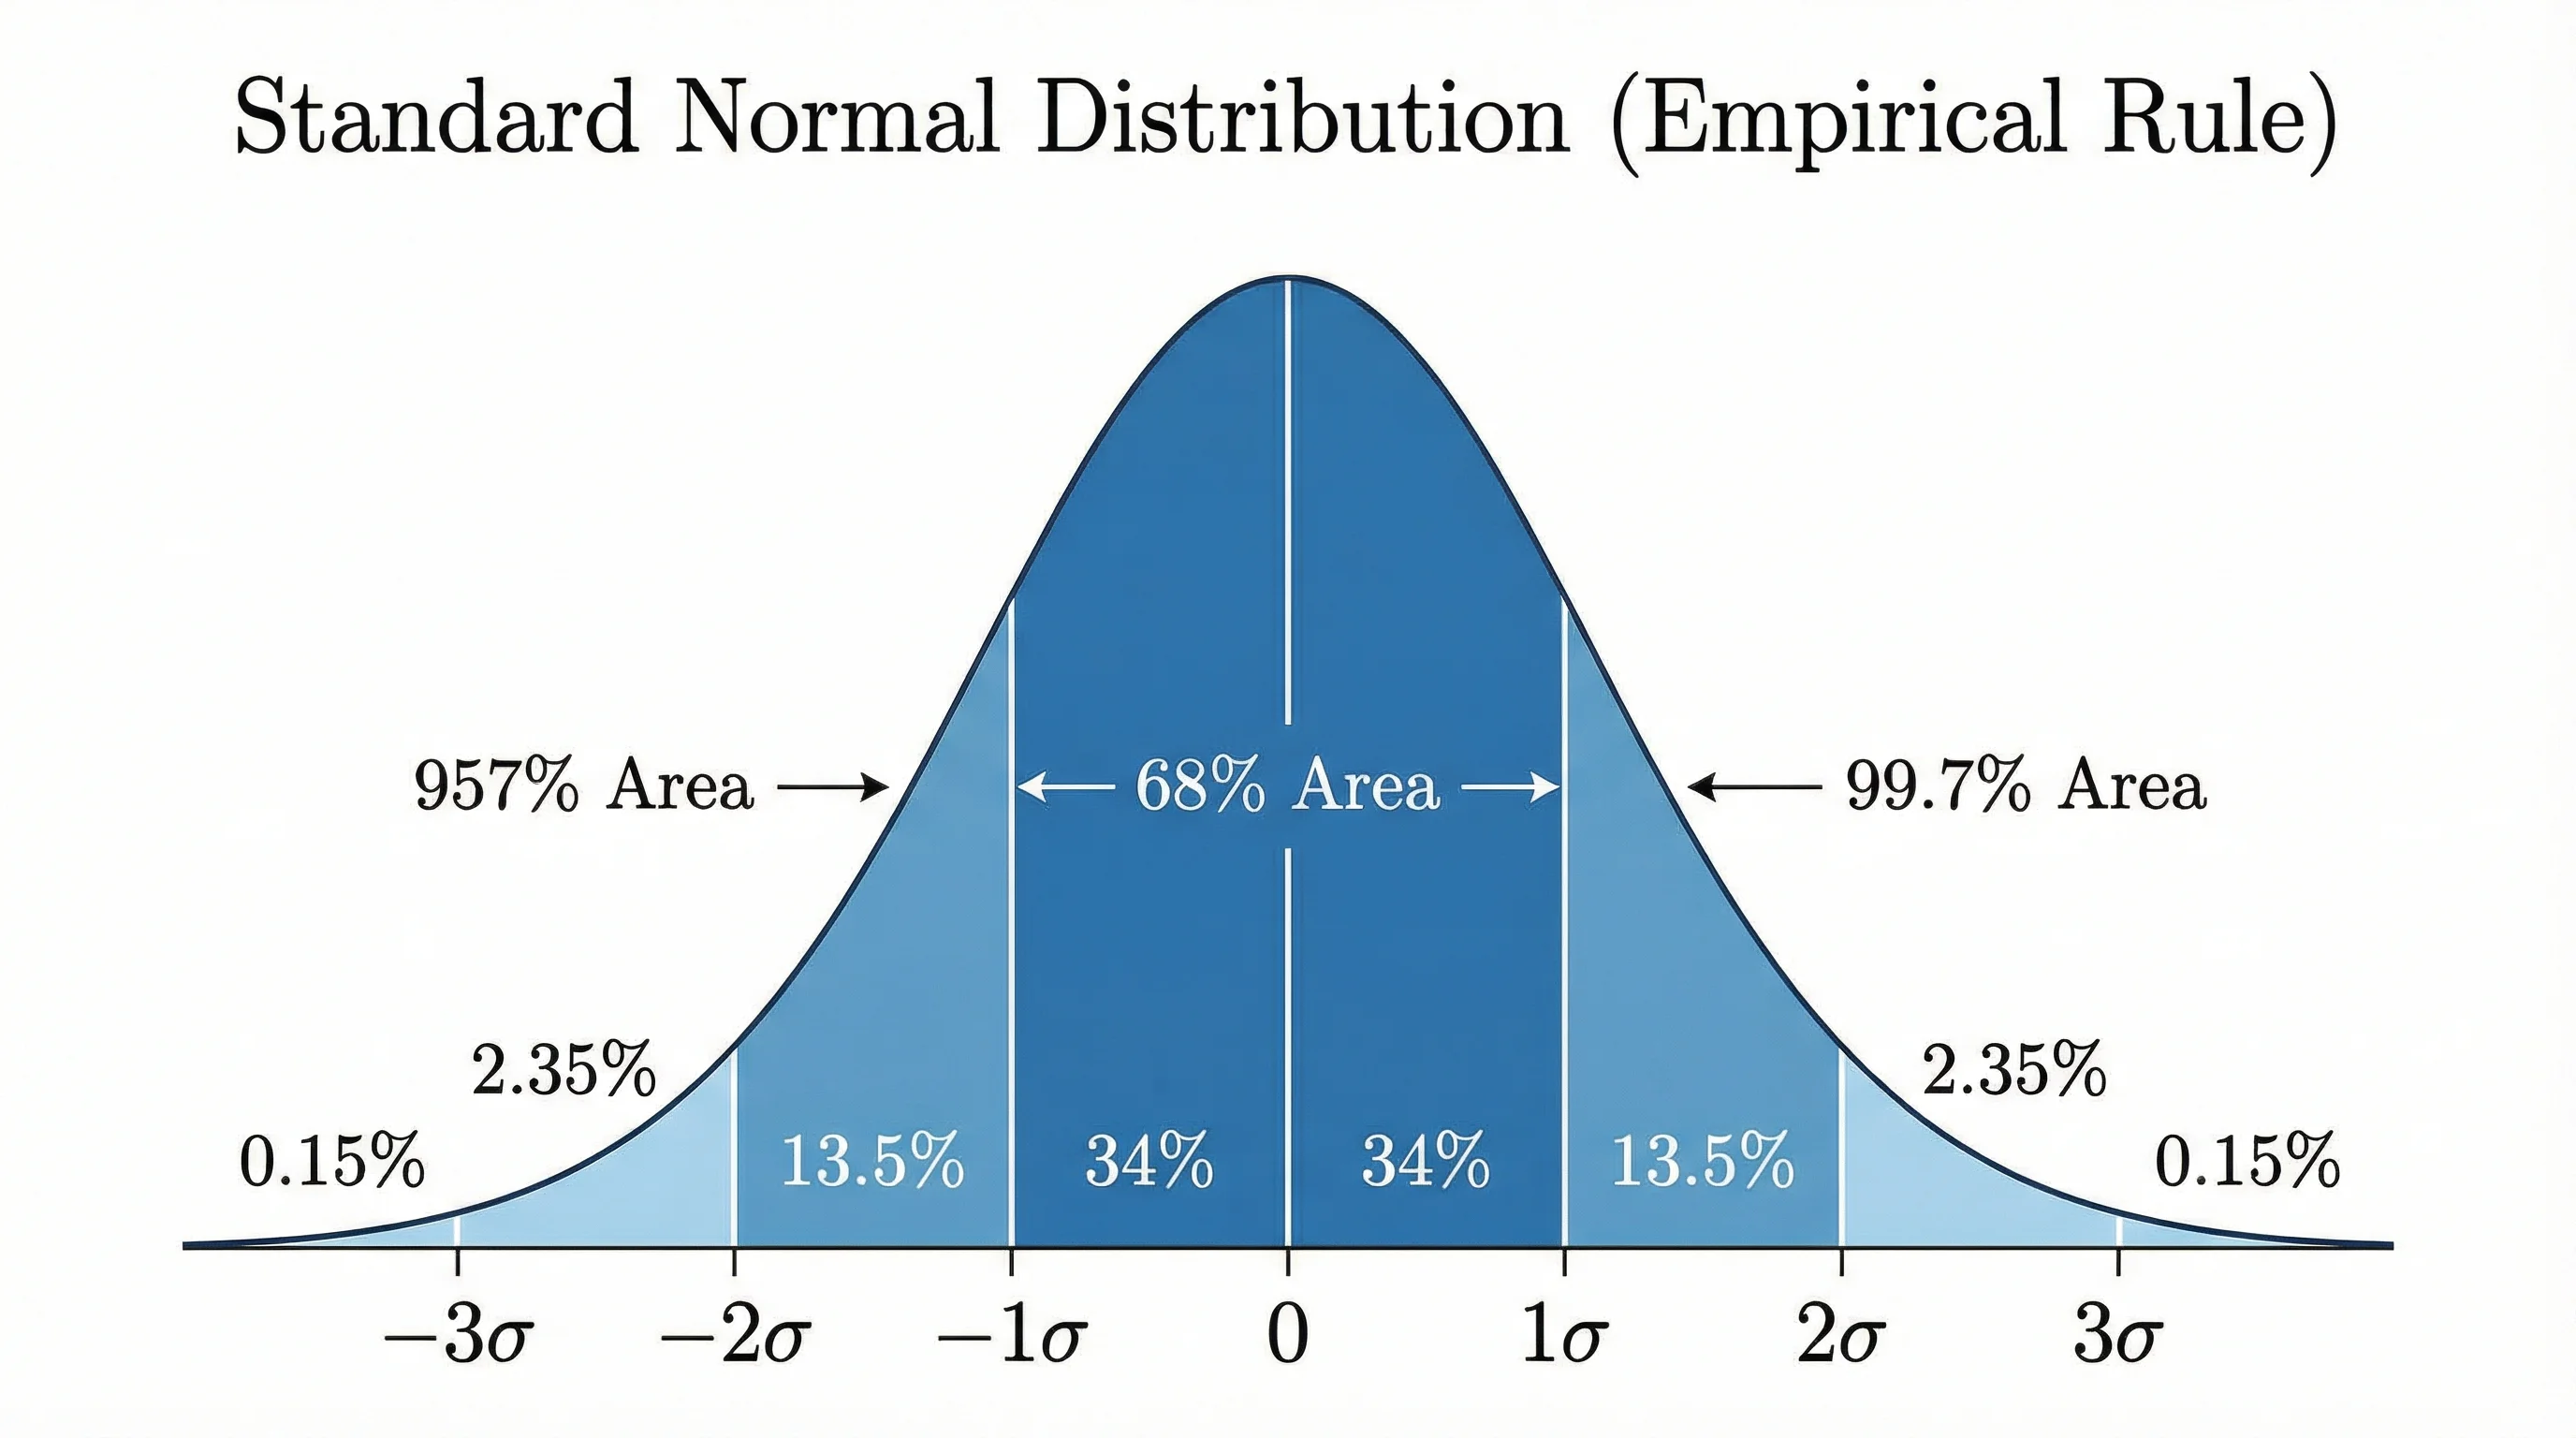
Bell Curve Generator
Draw a normal distribution curve with shaded areas and custom mean and standard deviation.
 Research
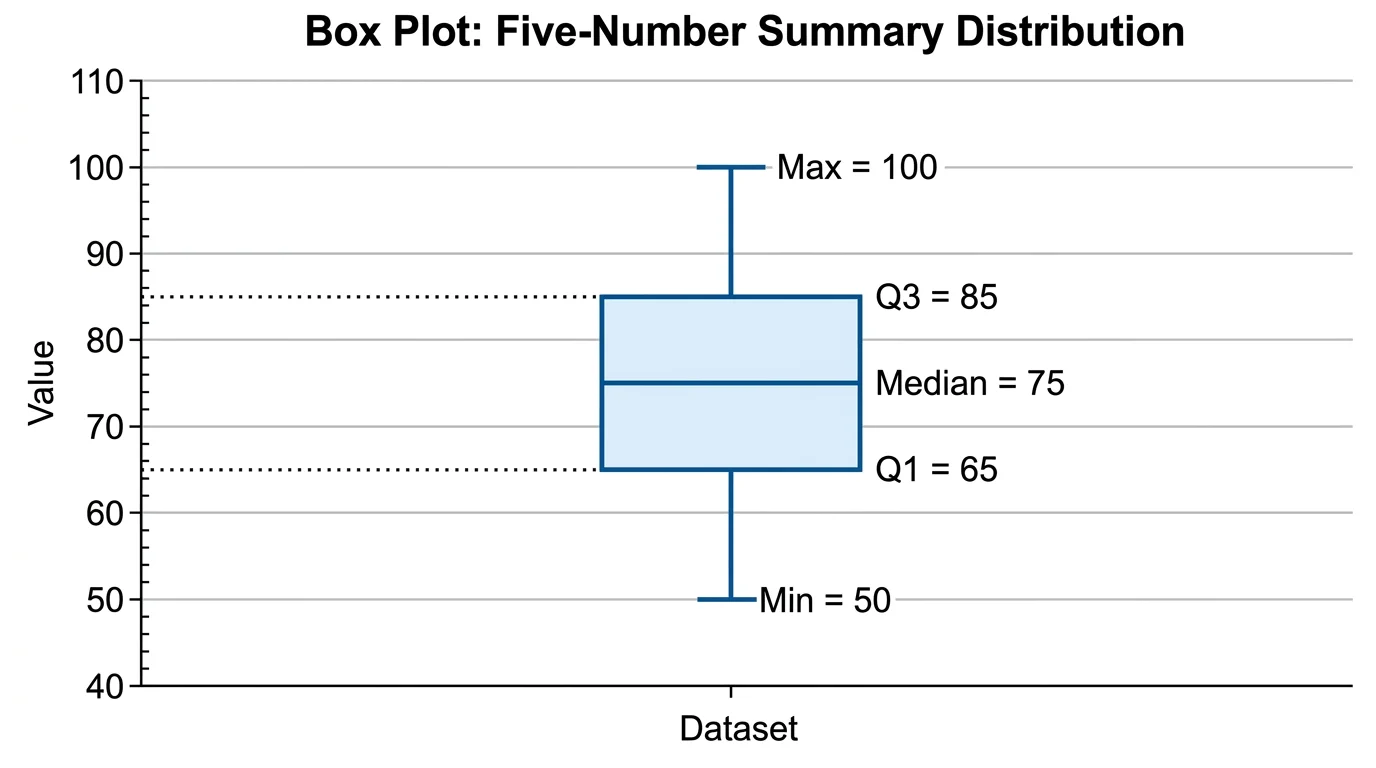
Box Plot Generator
Make box plots from your data to compare groups before you run a t test.
 Research
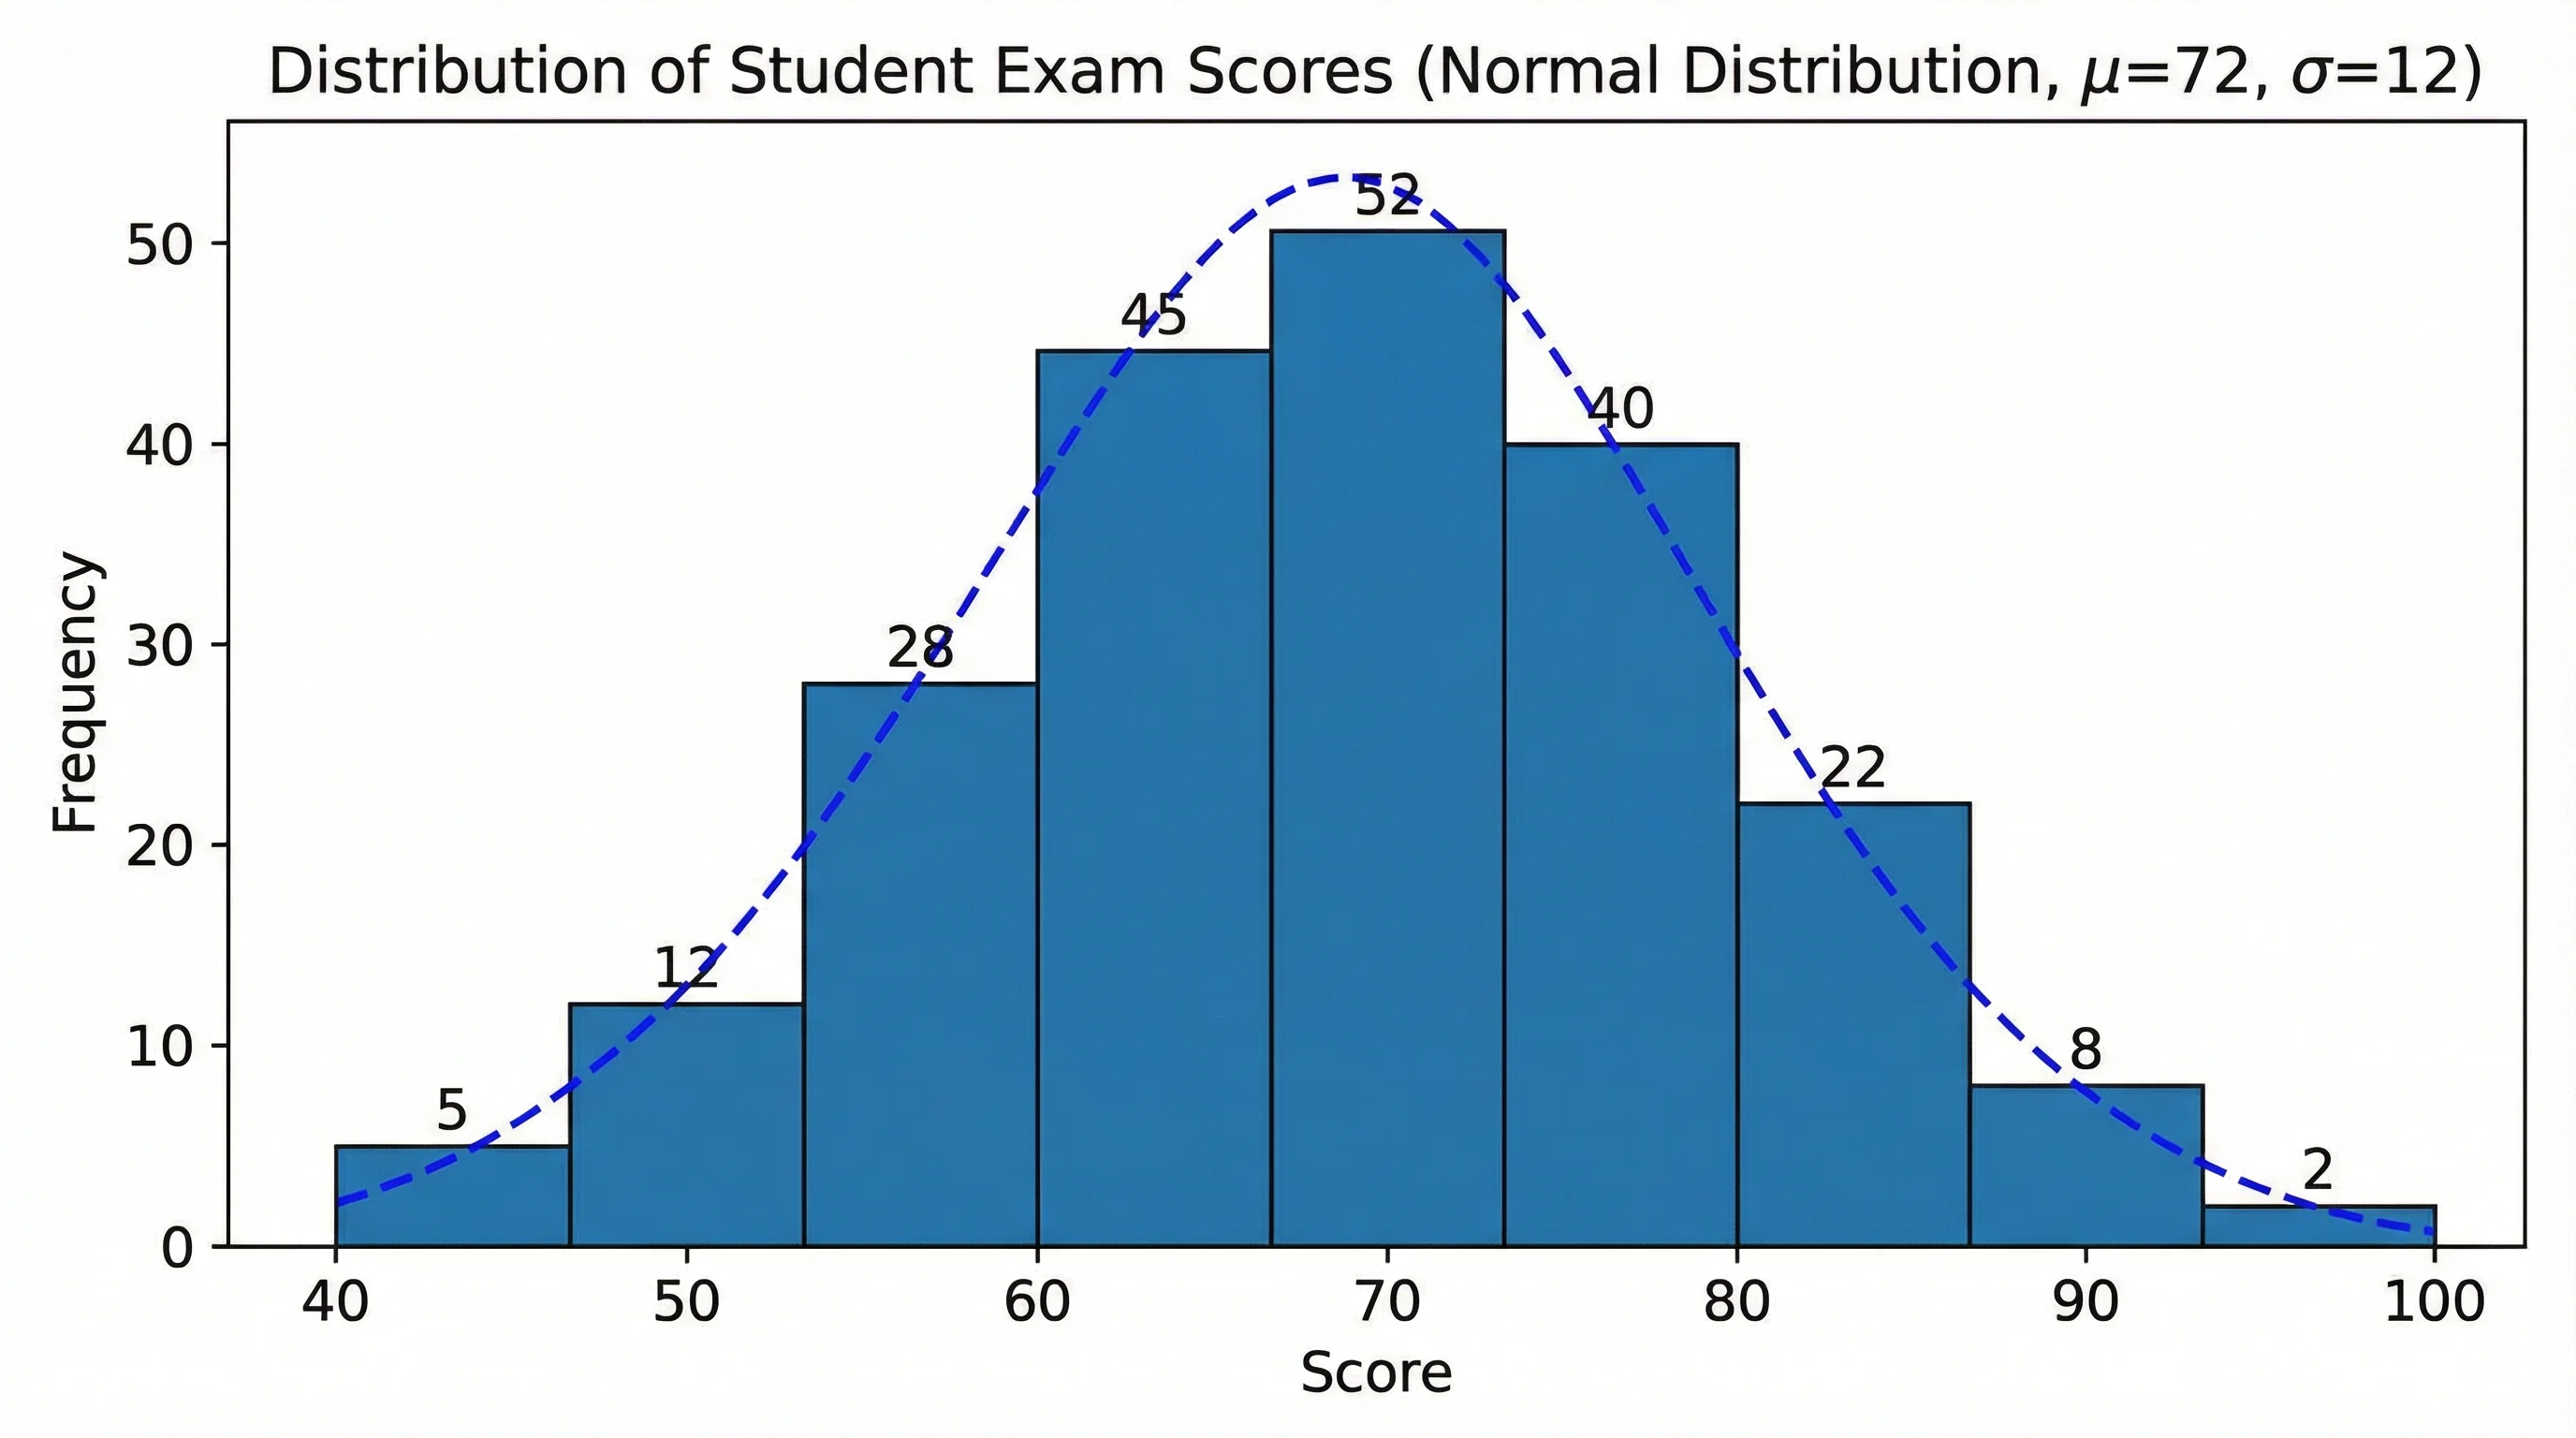
Histogram Maker
Turn a list of numbers into a histogram to check the shape of your data.