Random Number Table
Random number table with 5-digit blocks, a seed for repeatable results, and steps to draw a random sample or assign groups. Print it or copy it. Free.
Random Number Table
Seed 1955, 20 rows of 10 blocks of 5 digits. Read across a row, then on to the next. Pseudo-random digits from the mulberry32 generator: not the RAND table, not for cryptography or lotteries. conceptviz.app/tools/random-number-table
Pseudo-random digits (mulberry32, seed 1955), not the RAND table and not for cryptography or lotteries.
Number your population 1 to N, then read the table above. The reader takes as many digits at a time as N has, runs straight on across block gaps and into the next row, and skips 0, anything above N, and numbers already chosen. You can also click any digit in the table to start there.
| Step | Row, digit | Read | Result |
|---|---|---|---|
| Press “Read next” to take the first number. | |||
Chosen so far (0 of 8)
None yet
Free Random Number Table Charts
Every chart below is drawn from the same code as the tool above. View, download and print them free, no sign-up.
Random Number Table: 5-Digit Blocks, Seed 1955
The default table: 20 rows, ten blocks of five digits each, generated from seed 1955. The same seed always gives the same table.
Tables
How to read
Checks
Randomization
To look up the cutoff for the digit check, use the chi-square table. Have your own numbers to chart? Paste them into the histogram maker. Not sure which table fits your test? The statistics tables guide sorts z, t, chi-square and F tables by test.
History source: RAND Corporation, A Million Random Digits with 100,000 Normal Deviates (online edition, including the description of how the digits were produced).
What a random number table is
- A random number table is a page of digits in which every digit from 0 to 9 is equally likely at every position, independent of the digits around it. Before computers were common it was the standard way to pick a random sample or assign people to treatment groups: you number your population, enter the table at an arbitrary point, and let the digits decide.
- The digits above come from a seeded pseudo-random generator (mulberry32), not from physical noise. Type a seed and you get the same table every time, on any device, which is what makes a sample or an allocation list reproducible and auditable. The default seed is 1955. Change it with the New seed button, or share the link, which carries the seed and the table size.
How to read the table for a random sample
- Number the members of your population 1 to N. Read as many digits at a time as N has: two for N = 80, three for N = 250. Start at a row and digit you did not choose by looking (or press Random start), read left to right across the row, and carry on into the next row. The gaps between blocks are only there to help your eye, so ignore them.
- Skip 0, skip anything larger than N, and skip any number you already have. Stop when you have n different members. If the table ends first, the reader stops and says so instead of wrapping around, because wrapping would repeat the same digits.
- Worked example: choose 8 of 80 members starting at row 1, digit 1. Reading two digits at a time gives 14, 13, 75, 70, 05, 97 (skip), 08, 74, 15. The sample is members 14, 13, 75, 70, 5, 8, 74, 15.
Random assignment to groups
- Simple random assignment gives each participant an independent random group, like flipping a coin per person. It is unbiased, but with small samples the groups can end up unequal.
- Blocked (permuted block) randomization fixes this. Participants are cut into blocks of 4 or 6, and each block contains every group equally often in a random order, so group sizes never drift far apart: with two groups they differ by at most half a block at any point. With seed 1955 and groups A and B in blocks of 4, the first block is A B B A. One caveat: if staff know the block length they can predict the last assignments in a block, so trials that must stay masked often vary the block length.
Are the digits really uniform?
- The Digit check tab counts how often each digit appears and runs a chi-square goodness-of-fit test against equal frequencies, with 9 degrees of freedom. For the default table the counts give χ² = 7.92 and p = 0.5422, so there is no sign of unevenness. A single low p-value is not a defect: about 1 table in 20 falls below 0.05 by chance alone. If you want a different table, change the seed rather than searching for a seed that looks good, which defeats the purpose.
The RAND table and why this one is different
- The best-known printed table is A Million Random Digits with 100,000 Normal Deviates, published by the RAND Corporation in 1955. RAND generated its digits in 1947 with an electronic roulette wheel built from a random pulse source, then rerandomized them by adding digits modulo 10 because the raw output showed slight departures from randomness.
- This page does not reproduce that table. Its digits are pseudo-random: computed from a seed by an algorithm, so anyone with the seed can regenerate them exactly. That is useful for teaching and for documenting a classroom or lab allocation, but it is not suitable for cryptography, security tokens, or regulated lotteries and draws, which need a certified or cryptographically secure source.
Frequently Asked Questions
Related Statistics Tools
 Research
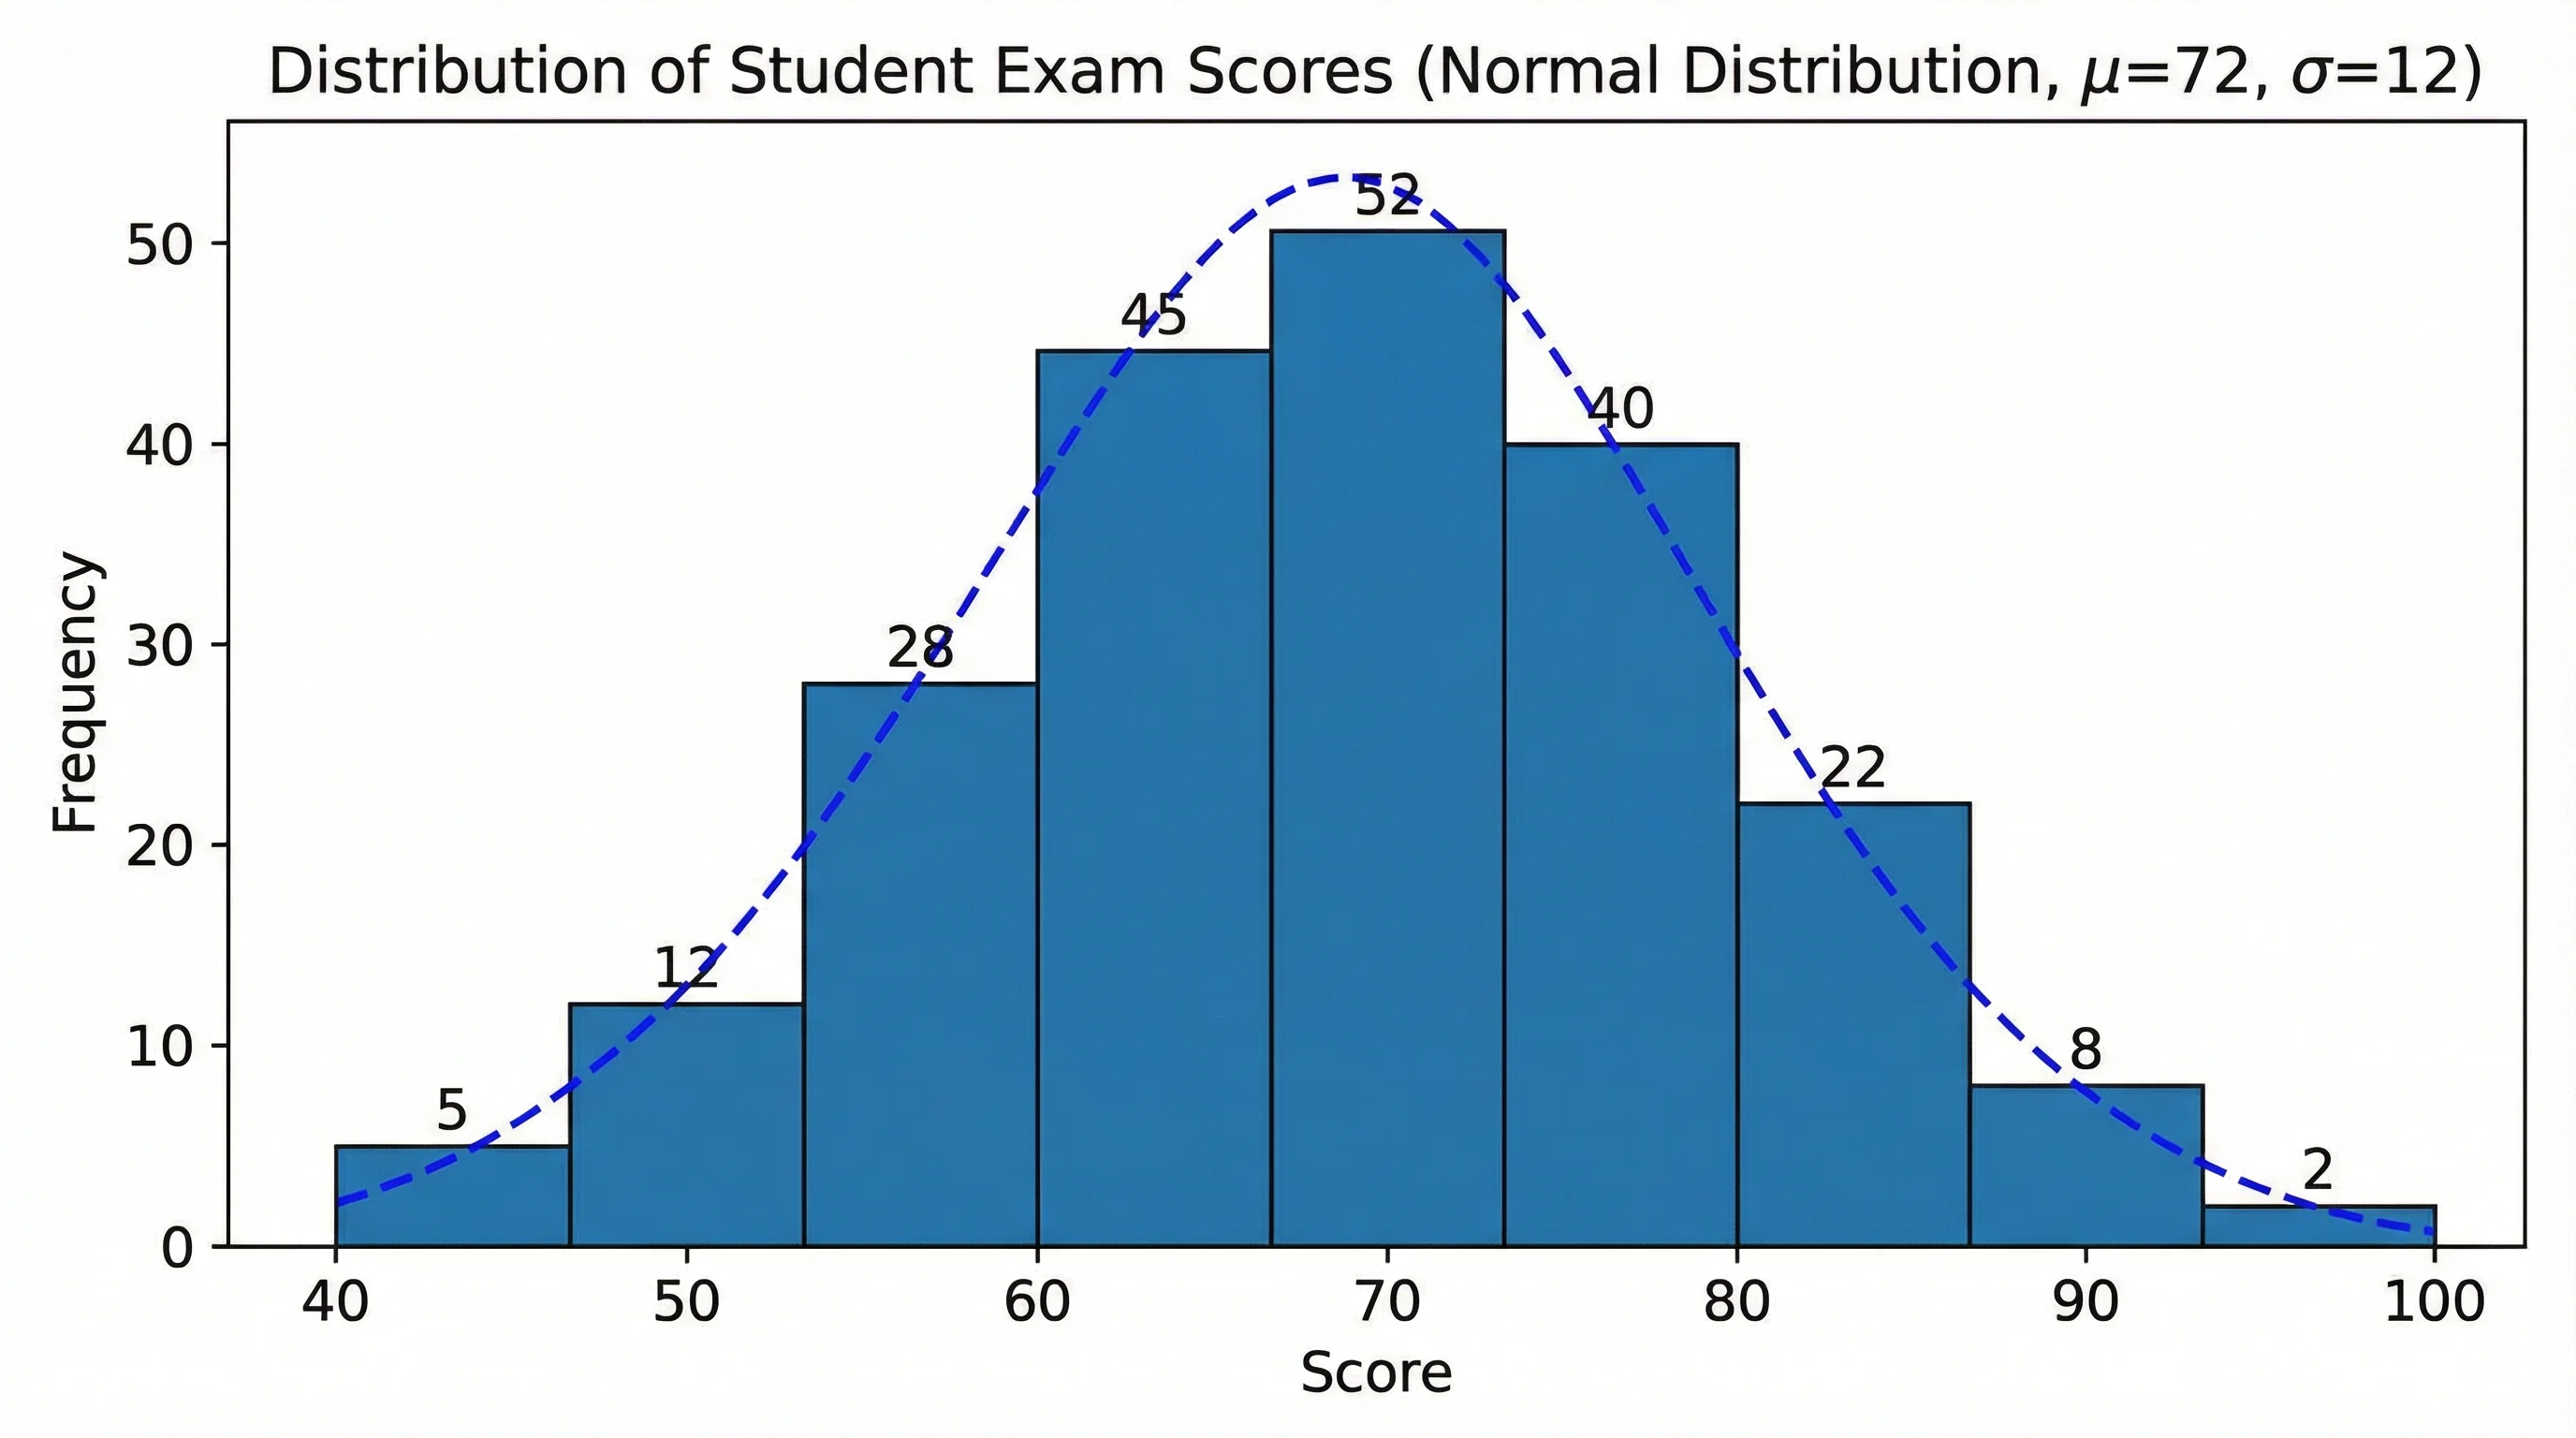
AI Histogram Maker
Create professional histograms and frequency distribution charts for statistics, data analysis, and STEM education.
 Research
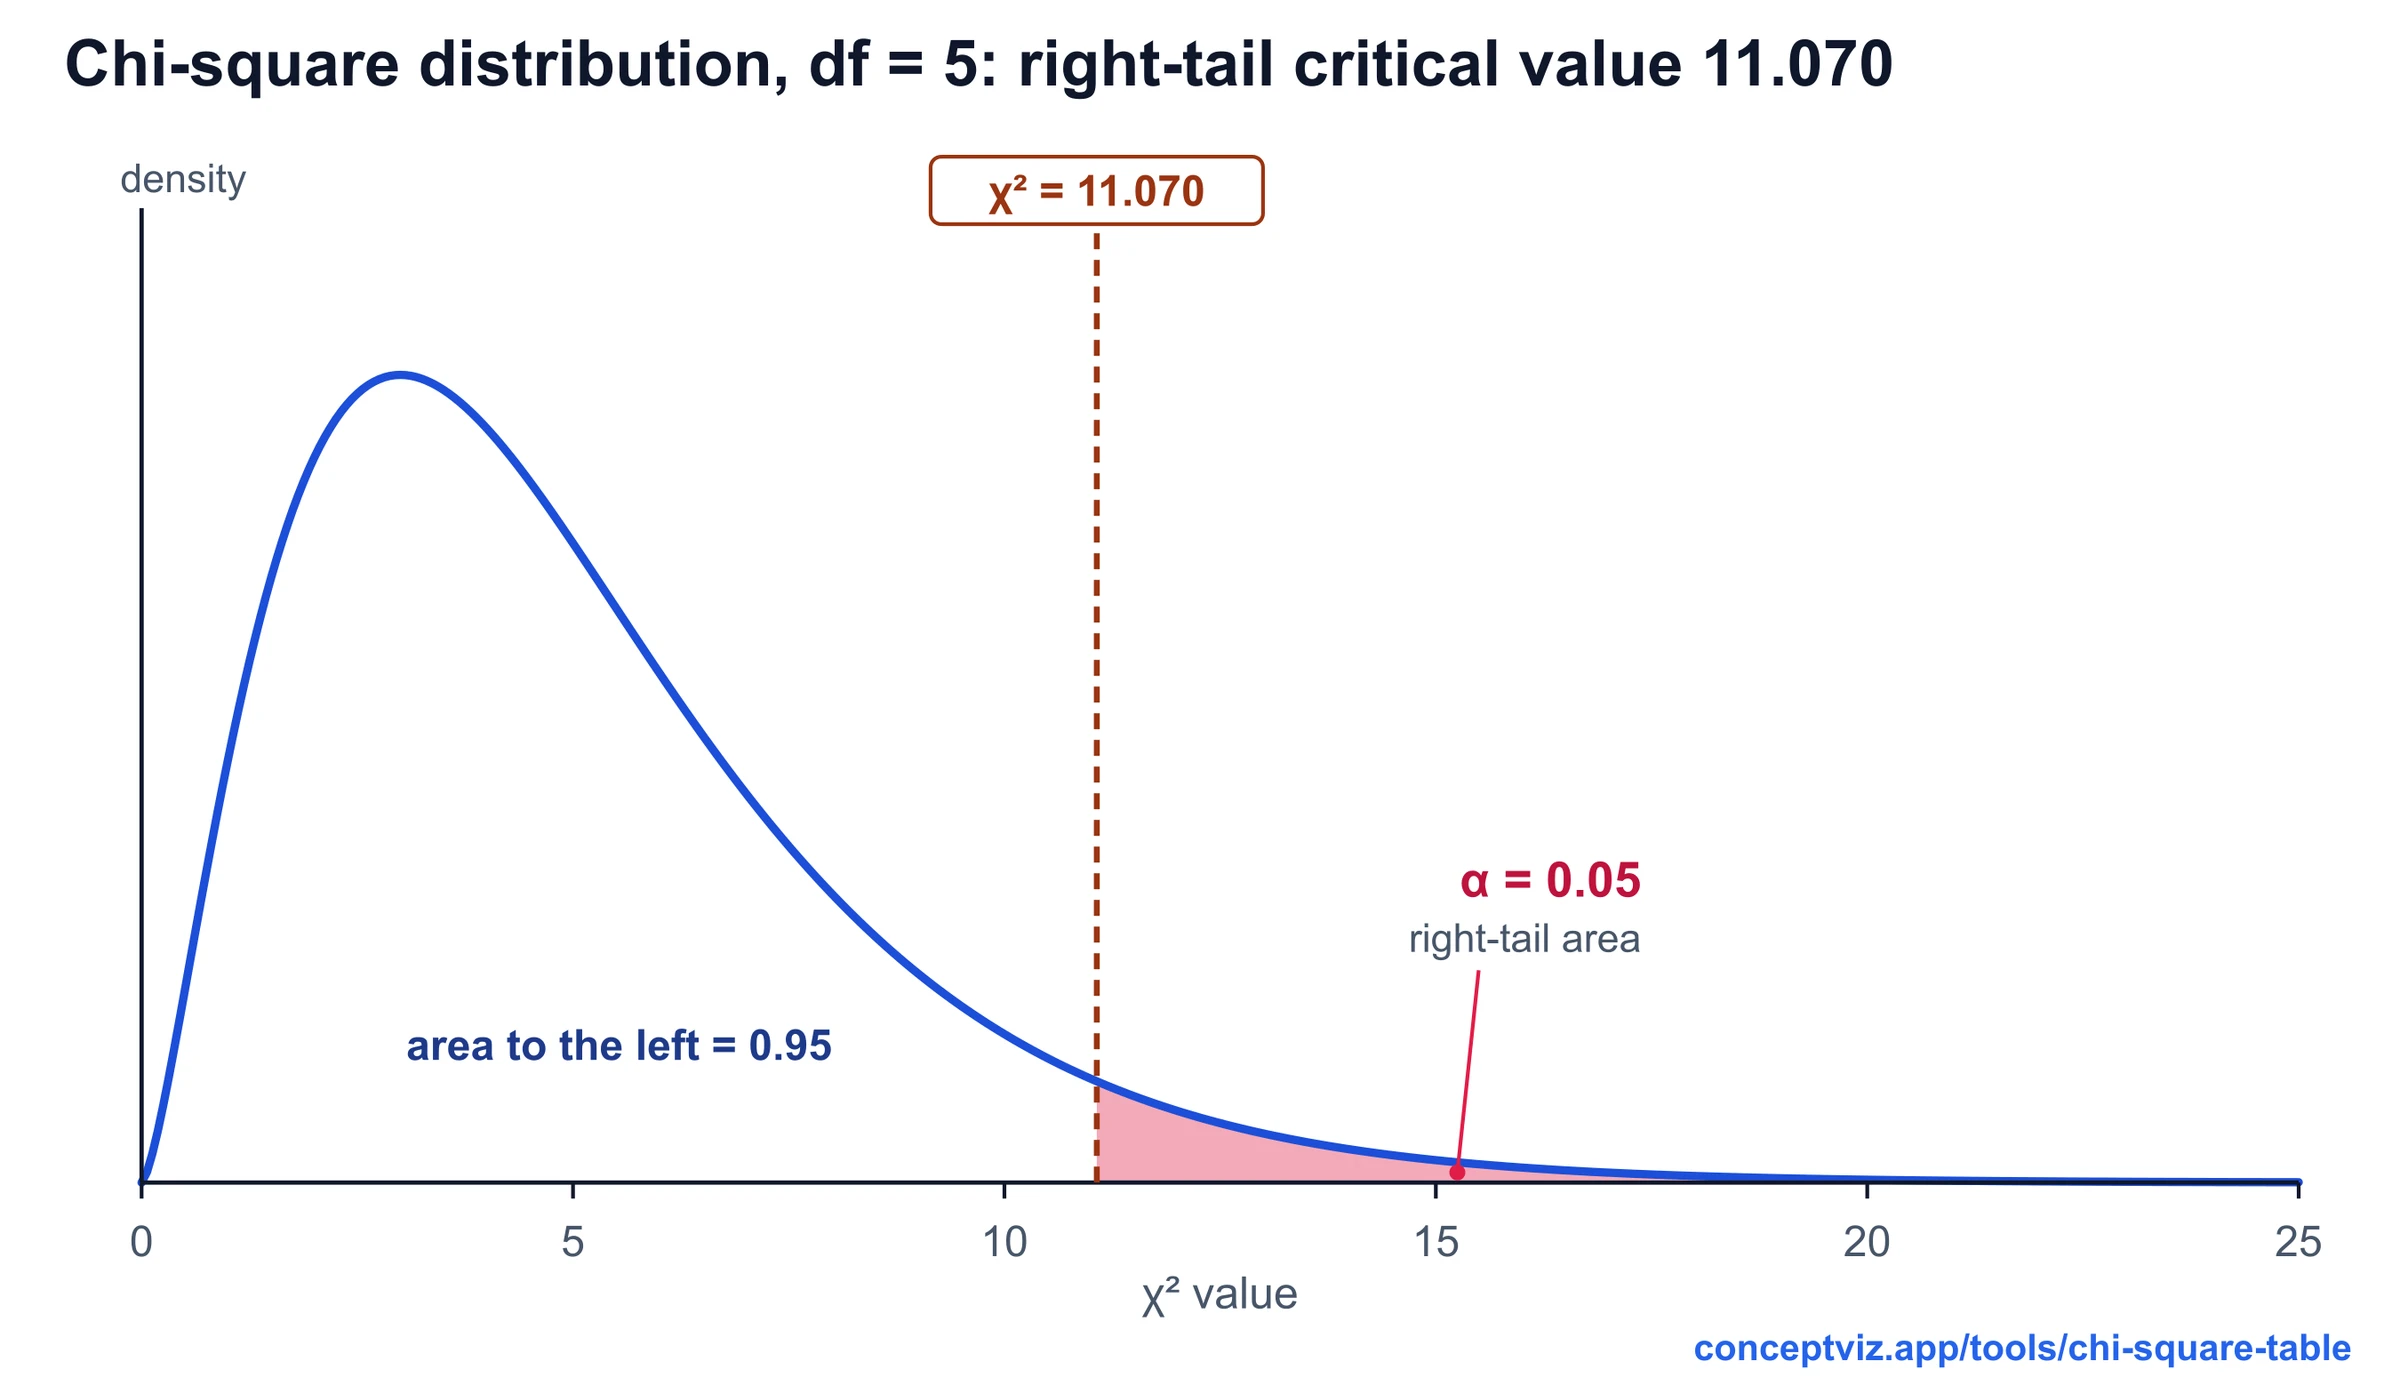
Chi-Square Table
Chi-square table with right-tail critical values for df 1 to 100, a p-value calculator with shaded area and lower-tail columns. Print or download.
 Research
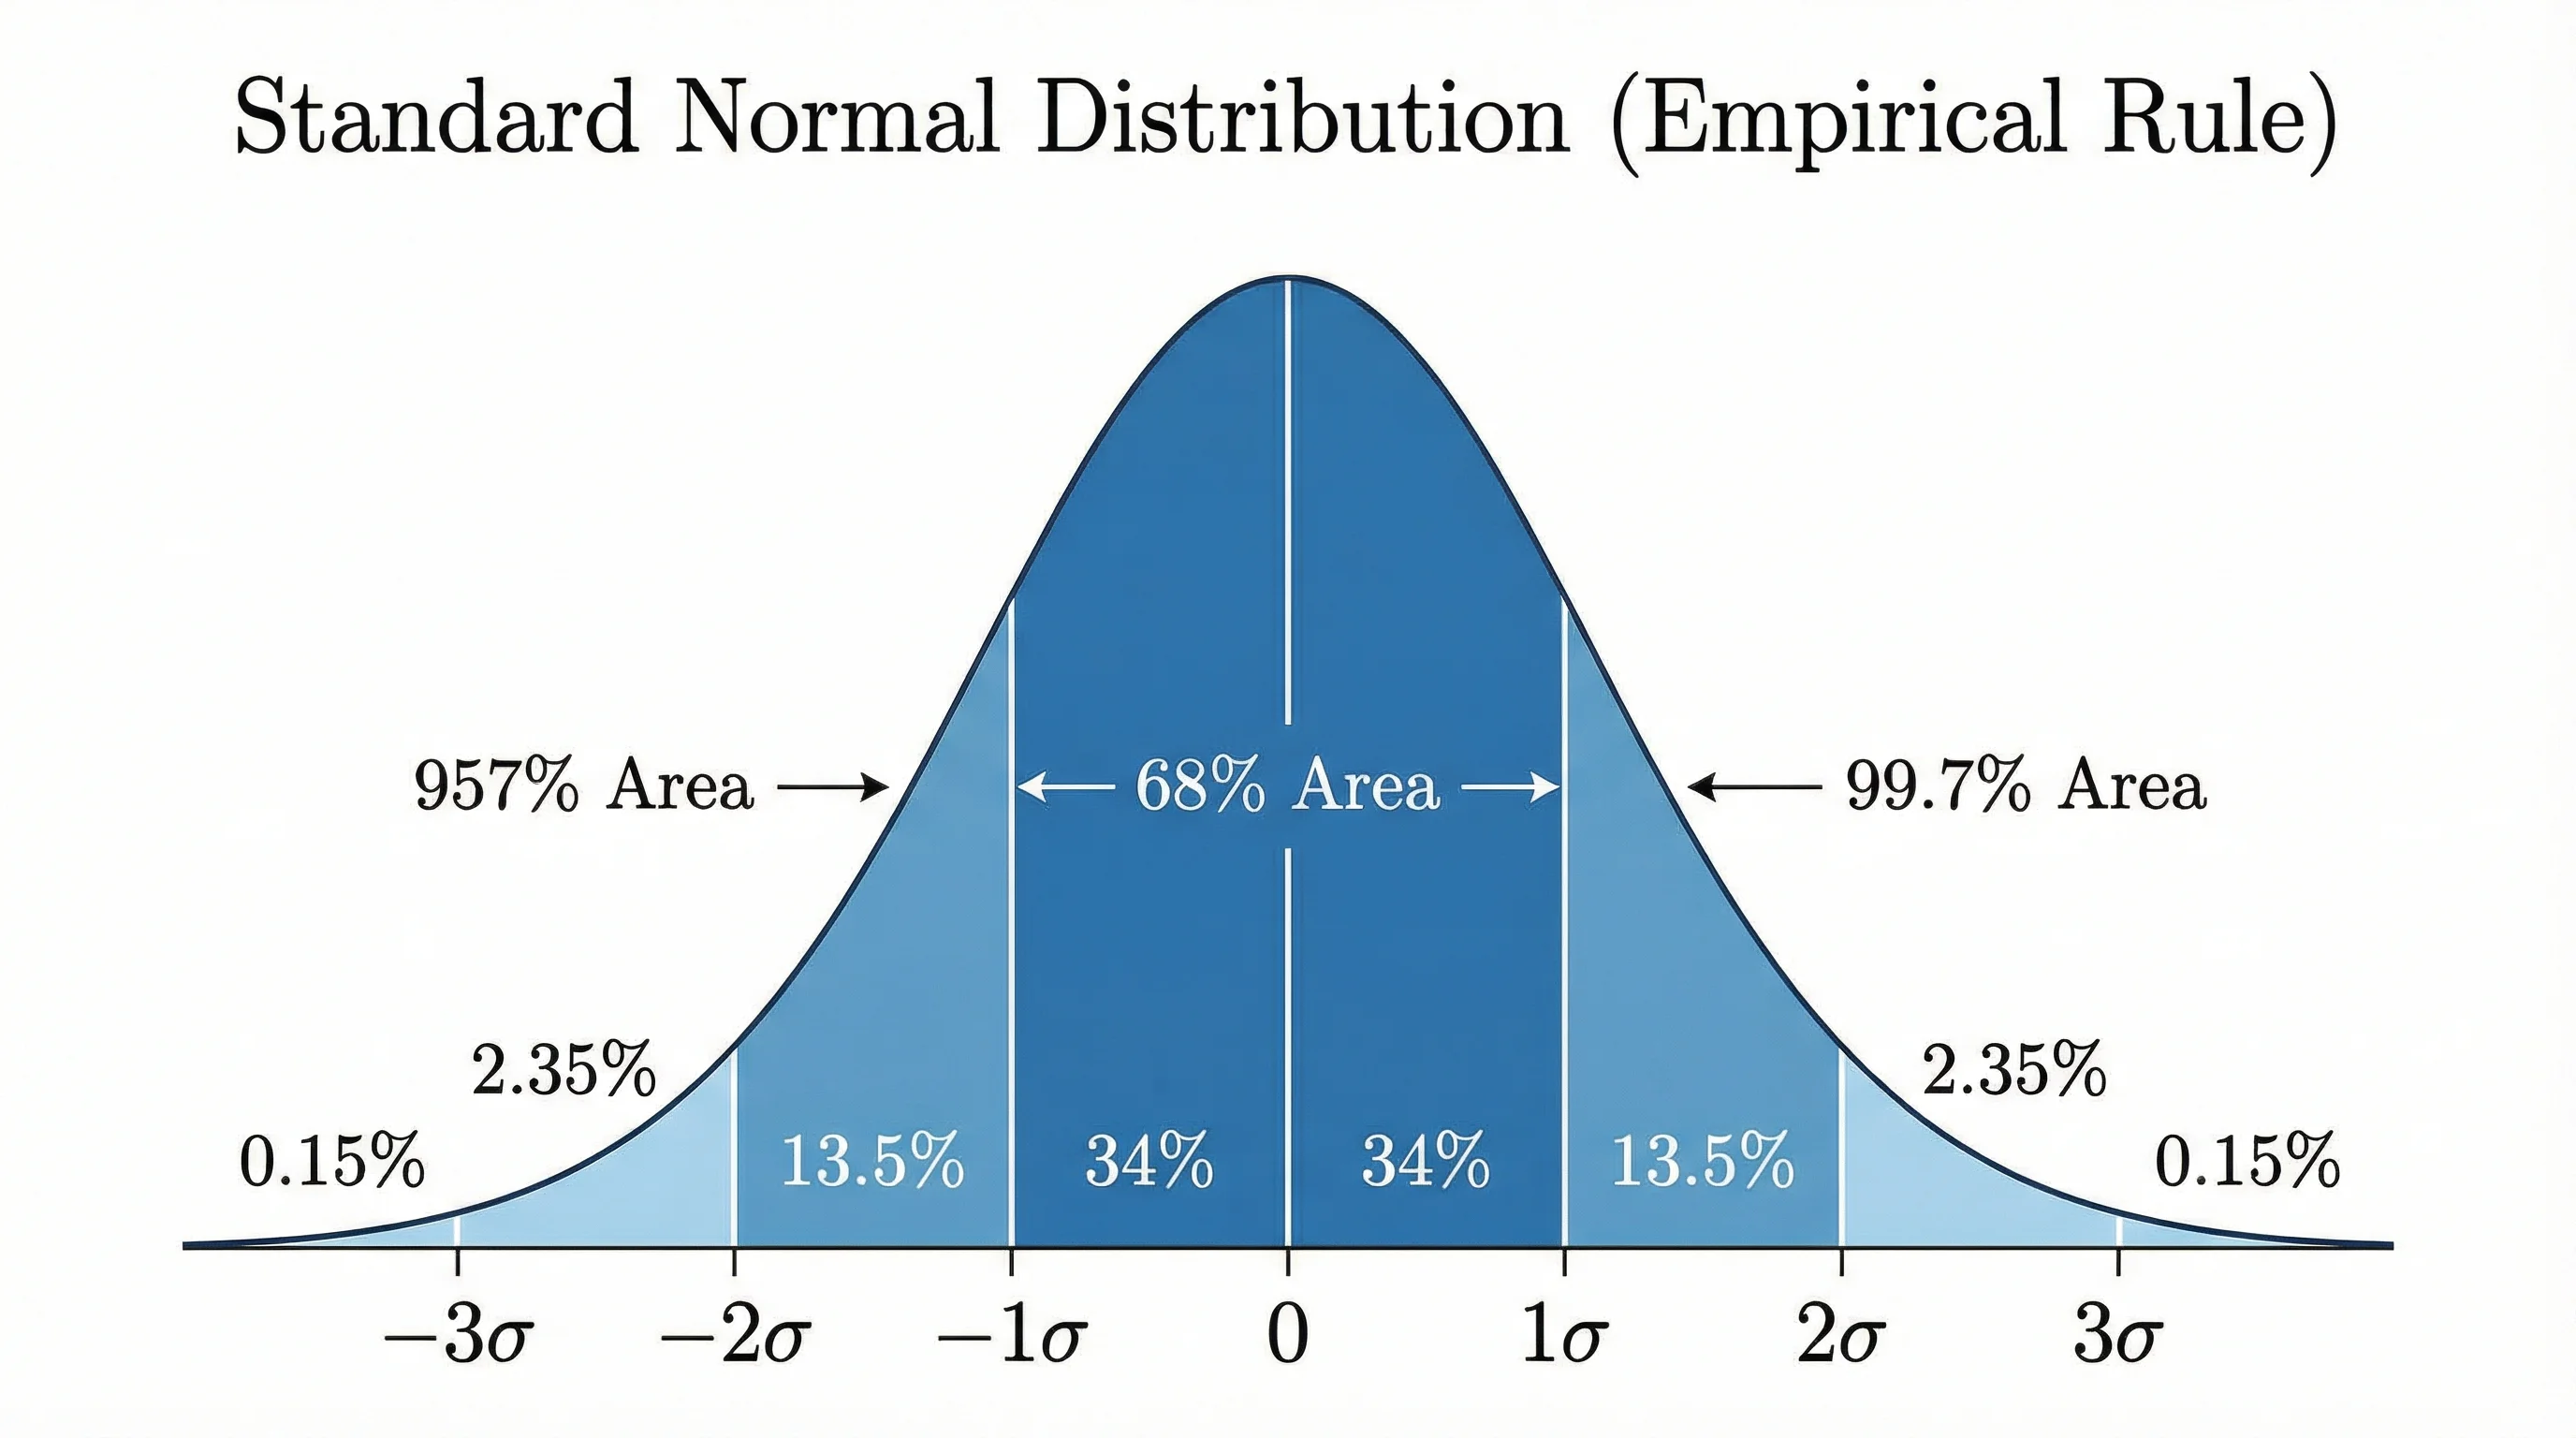
Bell Curve Generator
Create professional bell curves and normal distribution graphs for statistics, data analysis, and academic papers.
 Research
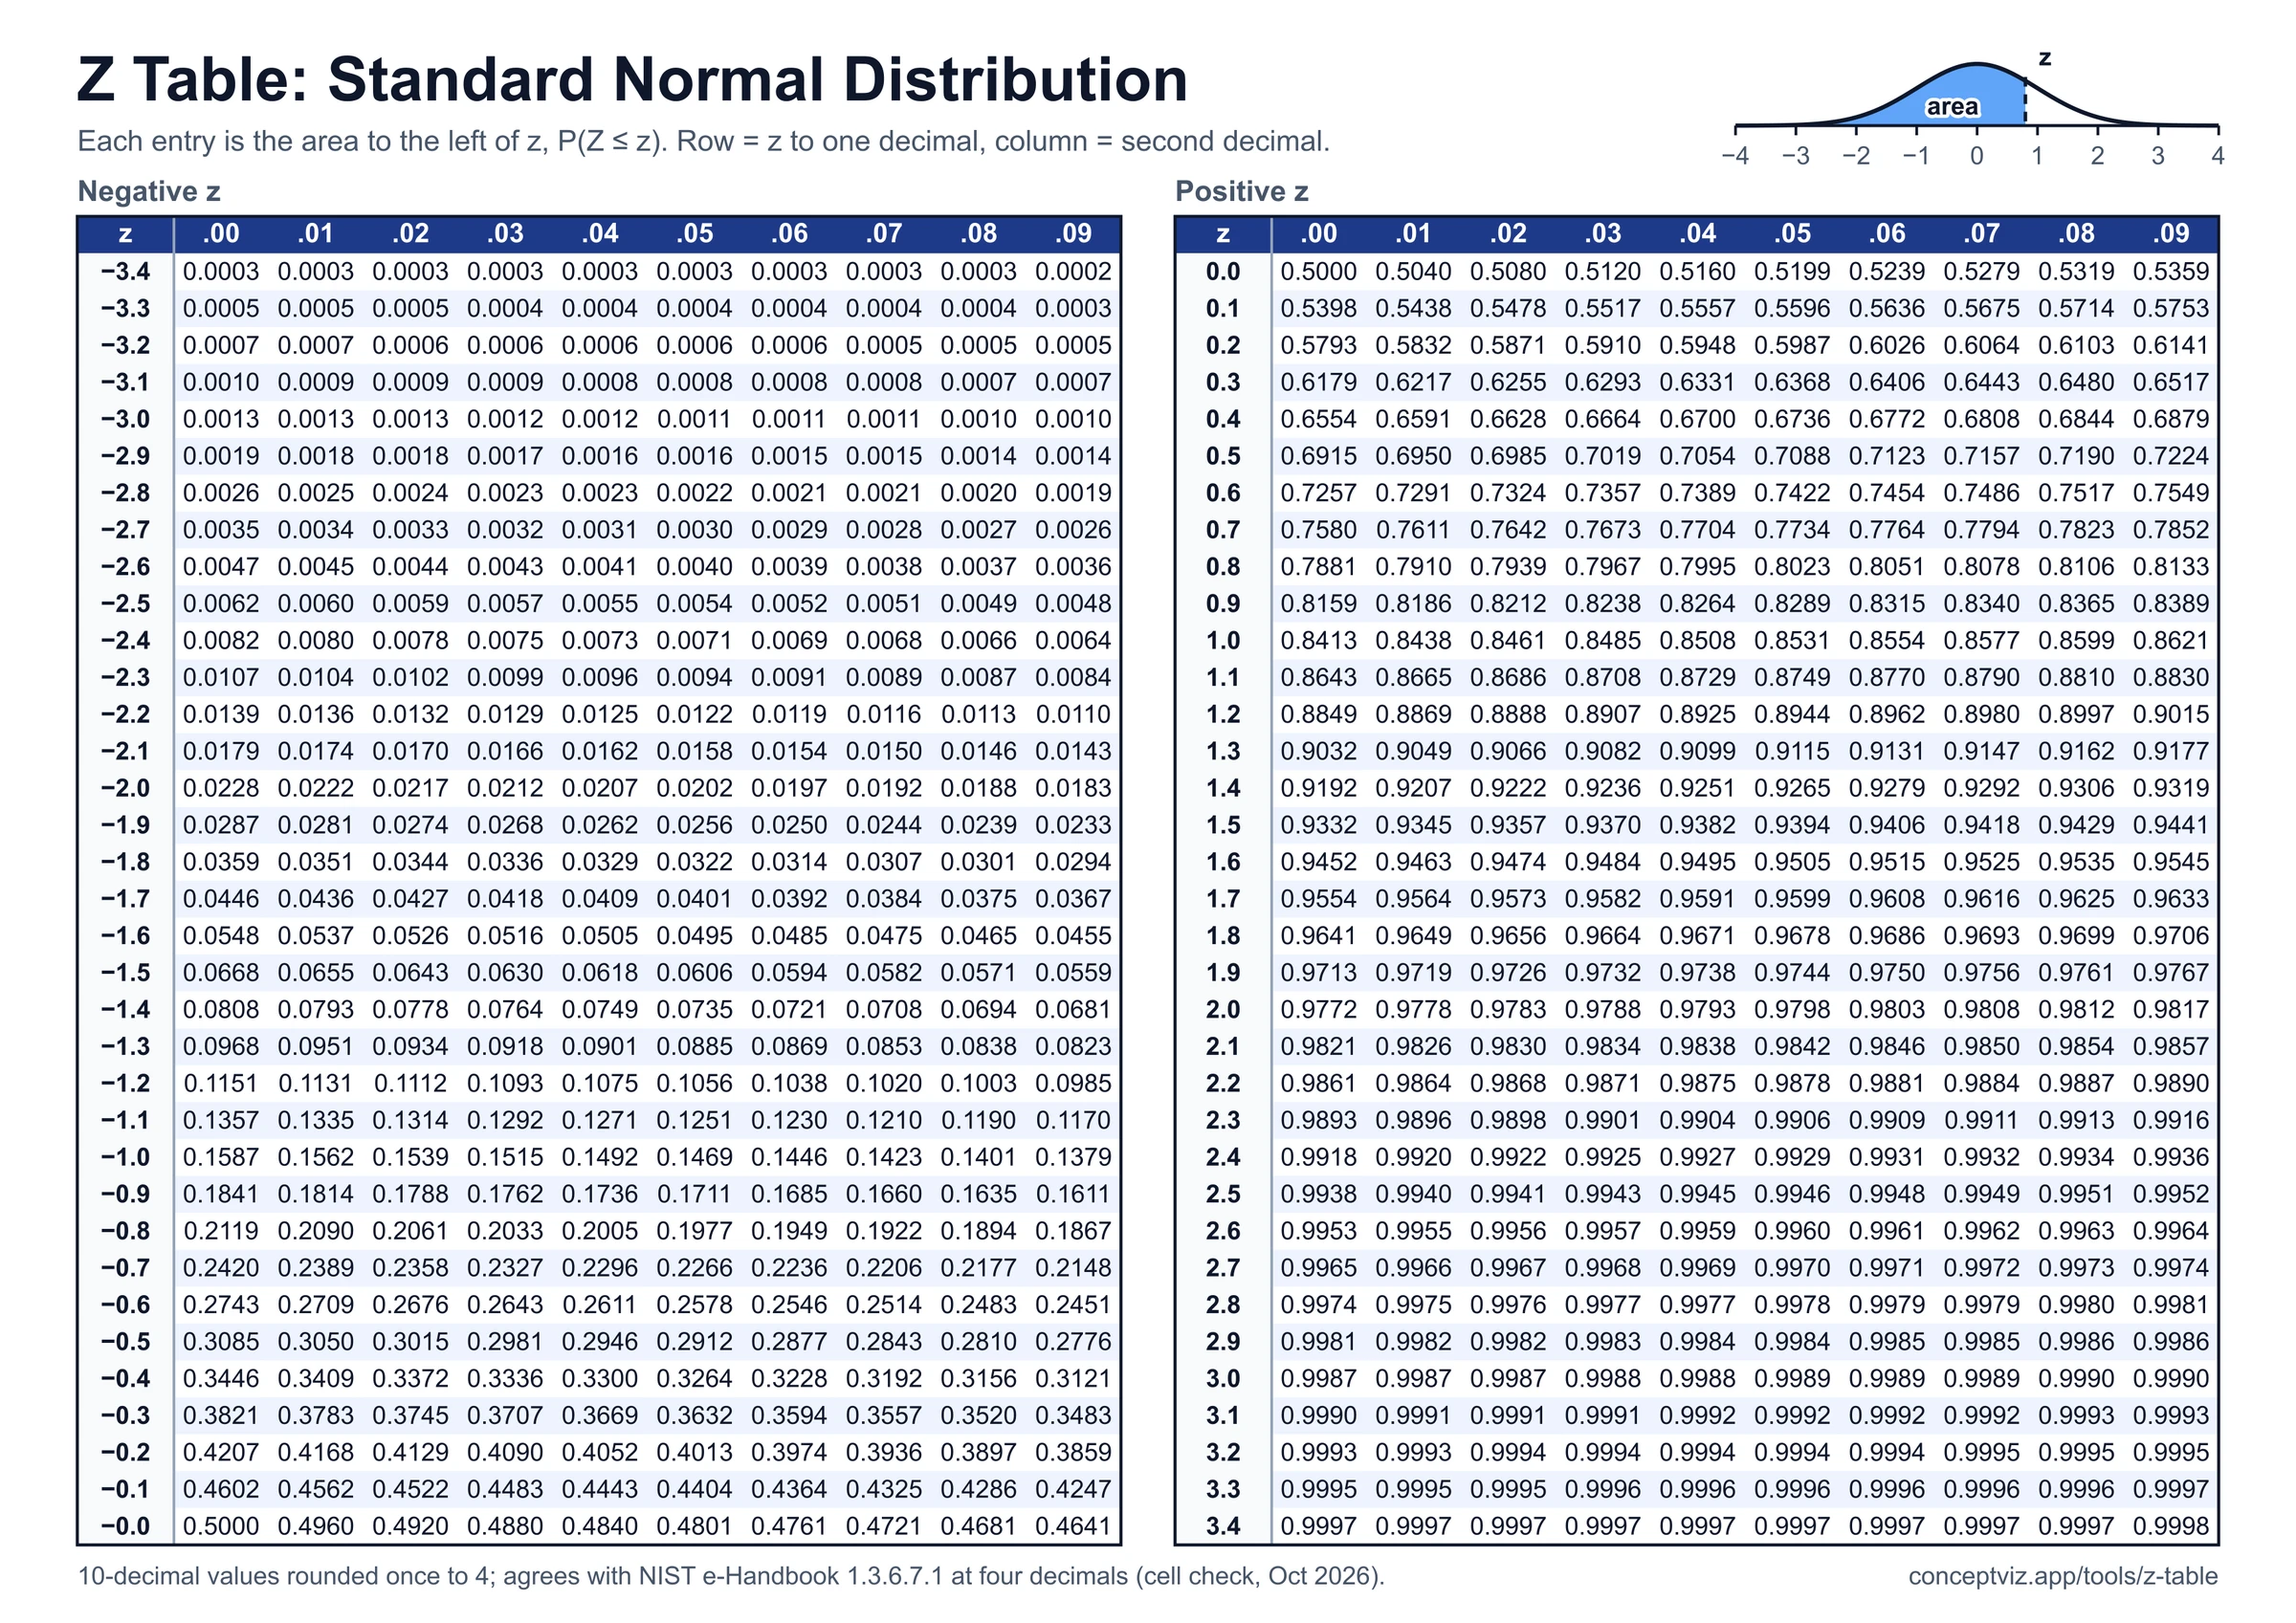
Z Table
Z table with positive and negative z-scores, left-tail cumulative area, z to p and p to z calculator, shaded curve and printable A4 and Letter sheets.
 Research
T Table
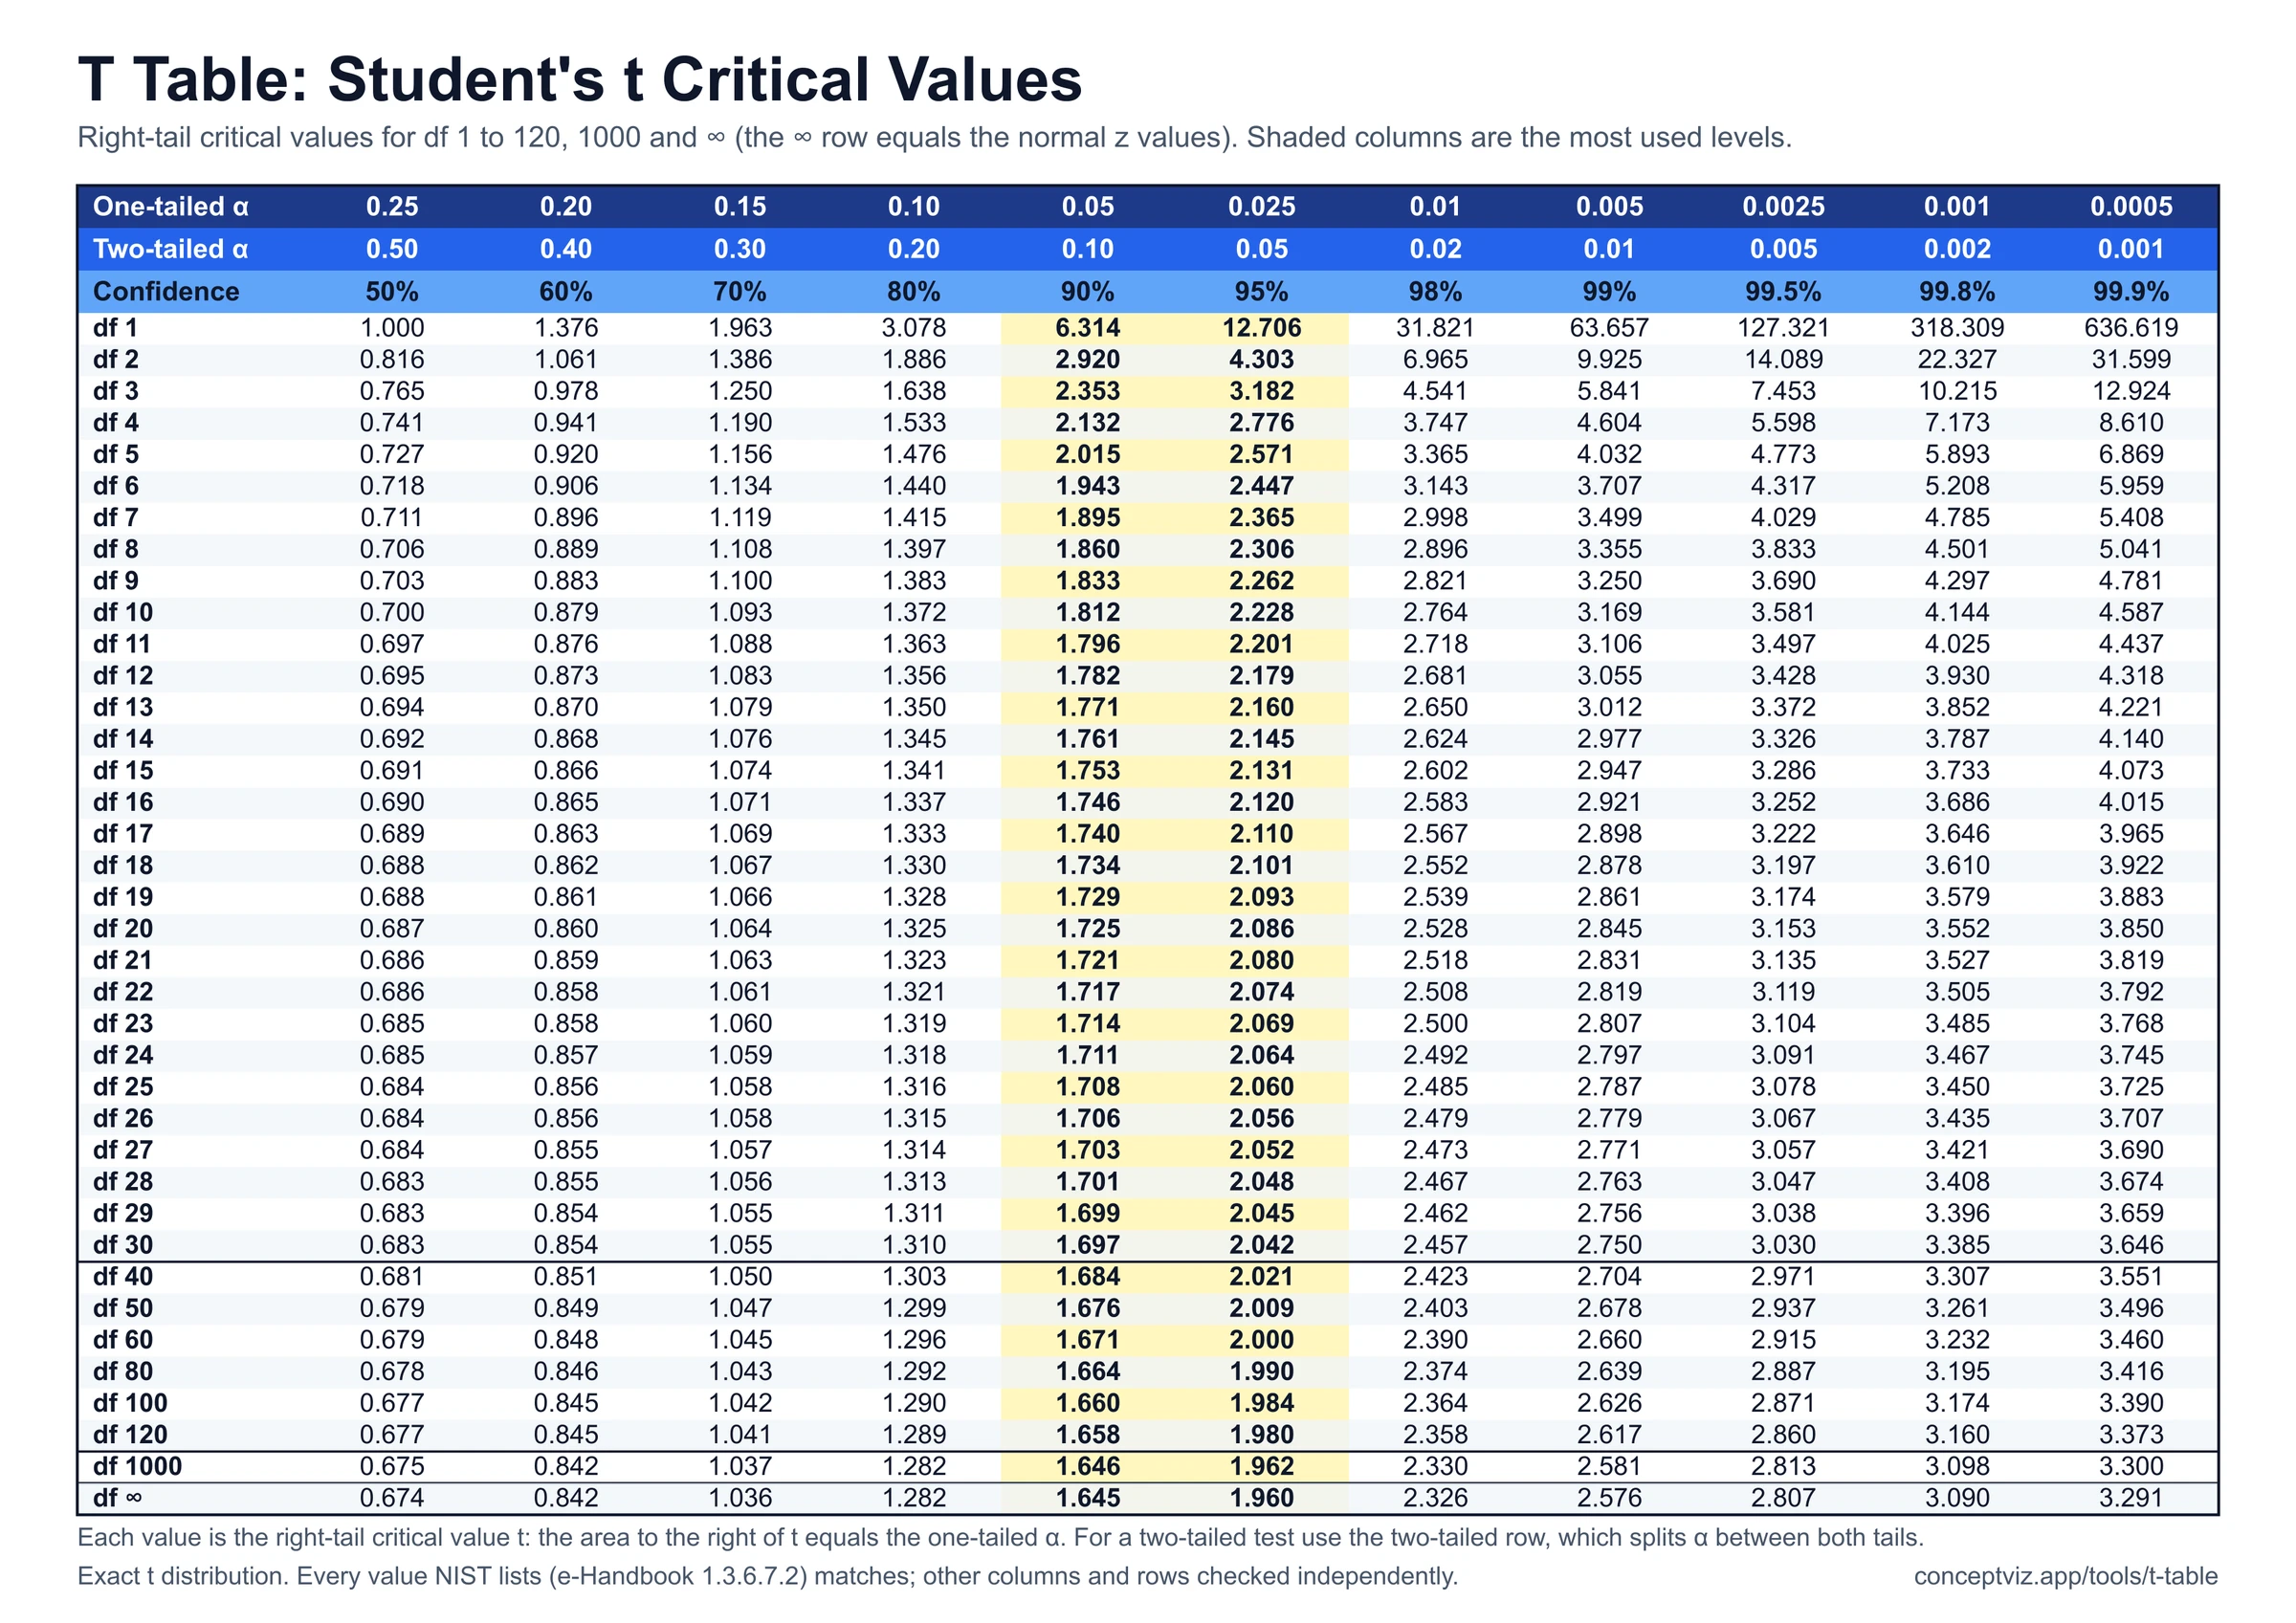
T table with one-tailed and two-tailed critical values for df 1 to 120 and infinity, a critical value and p-value calculator, and printable sheets.
 Research
F Distribution Table
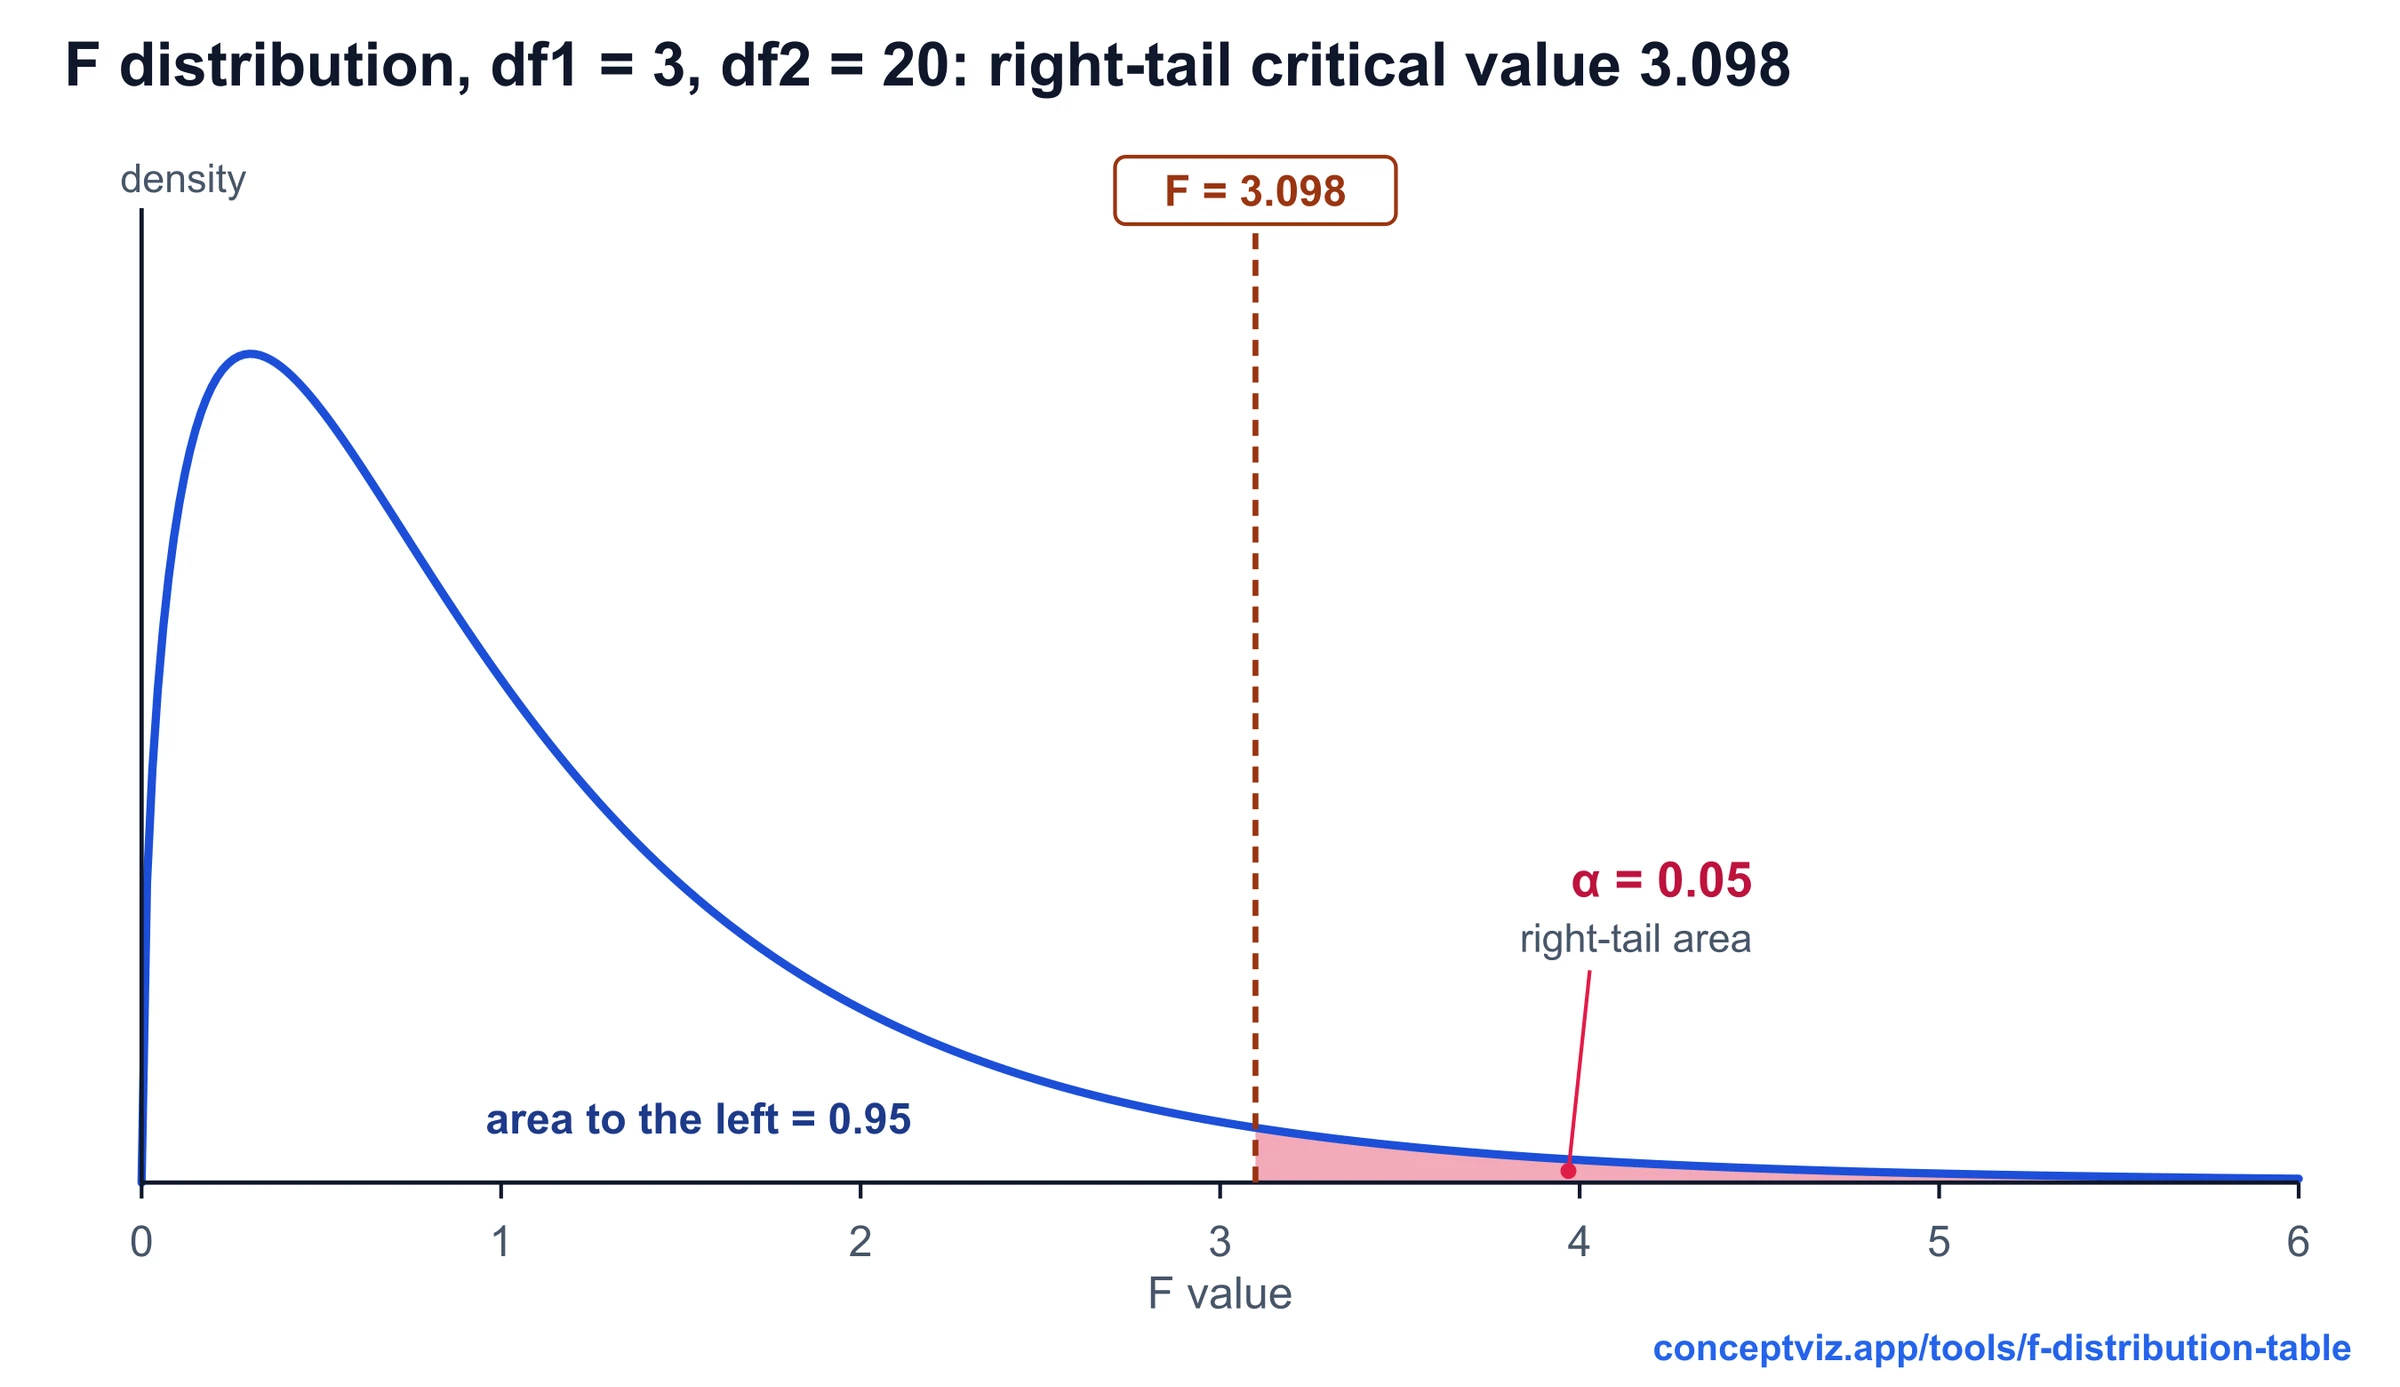
F distribution table with right-tail critical values for alpha 0.10, 0.05, 0.025 and 0.01, a critical value and p-value calculator, and printable sheets.