F Distribution Table
F distribution table for alpha 0.10, 0.05, 0.025 and 0.01 with df1 numerator and df2 denominator, an F critical value and p-value calculator. Printable.
F table for α = 0.05: right-tail critical values
Each number is the F value with area α to its right. Columns are df1 (numerator), rows are df2 (denominator). An F statistic larger than the entry is significant at level α. For a left-tail value use F(1 − α; df1, df2) = 1 / F(α; df2, df1).
Export style
Paper for print
| df2 \ df1 | 1 | 2 | 3 | 4 | 5 | 6 | 7 | 8 | 9 | 10 | 12 | 15 | 20 | 24 | 30 | 40 | 60 | 120 | ∞ |
|---|---|---|---|---|---|---|---|---|---|---|---|---|---|---|---|---|---|---|---|
| 1 | |||||||||||||||||||
| 2 | |||||||||||||||||||
| 3 | |||||||||||||||||||
| 4 | |||||||||||||||||||
| 5 | |||||||||||||||||||
| 6 | |||||||||||||||||||
| 7 | |||||||||||||||||||
| 8 | |||||||||||||||||||
| 9 | |||||||||||||||||||
| 10 | |||||||||||||||||||
| 11 | |||||||||||||||||||
| 12 | |||||||||||||||||||
| 13 | |||||||||||||||||||
| 14 | |||||||||||||||||||
| 15 | |||||||||||||||||||
| 16 | |||||||||||||||||||
| 17 | |||||||||||||||||||
| 18 | |||||||||||||||||||
| 19 | |||||||||||||||||||
| 20 | |||||||||||||||||||
| 21 | |||||||||||||||||||
| 22 | |||||||||||||||||||
| 23 | |||||||||||||||||||
| 24 | |||||||||||||||||||
| 25 | |||||||||||||||||||
| 26 | |||||||||||||||||||
| 27 | |||||||||||||||||||
| 28 | |||||||||||||||||||
| 29 | |||||||||||||||||||
| 30 | |||||||||||||||||||
| 40 | |||||||||||||||||||
| 60 | |||||||||||||||||||
| 120 | |||||||||||||||||||
| ∞ |
Values are rounded to 3 decimals, 2 decimals from 100 up and 1 decimal from 1000 up. Each cell is computed from the regularized incomplete beta function, and the ∞ row and column from chi-square quantiles. Every cell was compared with SciPy. Click any cell to see its shaded area.
Selected cell
F(0.05; 2, 27) = 3.354
With df1 = 2 and df2 = 27, 0.05 of the distribution lies to the right of 3.354.
Free F Distribution Table Charts
Every chart below is drawn from the same code as the tool above. View, download and print them free, no sign-up.
F Distribution Table: Alpha 0.05
The most used F table: right-tail critical values at the 5% level for every df1 and df2 pair.
Reference tables
How to read
Printable versions
Worked examples
Working with other test statistics? Look up t critical values in the t table, chi-square values in the chi-square table and normal areas in the z table, or draw a distribution with the bell curve generator. An F value is a ratio of two scaled chi-square values, which is why the ∞ row and column of the F table can be read from the chi-square distribution.
What the F distribution is
The F distribution is the sampling distribution of a ratio of two independent chi-square variables, each divided by its own degrees of freedom. That is why it needs two numbers: df1 for the numerator and df2 for the denominator. It starts at 0, can never be negative, and is skewed to the right, so large values are rare under the null hypothesis. Because only a large ratio counts as evidence against the null hypothesis, most F tests use only the right tail, and that is the tail this table lists.
When you use an F table
The F distribution turns up in three common places. A one-way ANOVA compares the variation between group means with the variation inside groups, and assumes independent groups, roughly normal data and similar spread in each group. A regression F test checks the null hypothesis that all slope coefficients are zero. An F test for equal variances compares two sample variances; it is sensitive to non-normal data, so check normality first or use a more robust test such as Levene’s. In each case you compute an F statistic from your data, then compare it with the critical value from this table, or get an exact p-value from the calculator above.
How to read the F table
- Pick the tab for your significance level α, such as the F table 0.05. Find the column for df1, the numerator degrees of freedom, and the row for df2, the denominator degrees of freedom. The cell where they meet is the right-tail critical value: an F statistic above it is significant at level α.
- Take a one-way ANOVA with 3 groups of 10 values each. There are 3 − 1 = 2 degrees of freedom between groups and 30 − 3 = 27 within groups. At α = 0.05 the cell for df1 = 2 and df2 = 27 is 3.354. Suppose your F statistic is 4.5. That is larger, so the groups differ significantly, and the calculator gives the exact p-value 0.0206.
Rows and columns that are missing
Printed F tables show df1 from 1 to 10, then 12, 15, 20, 24, 30, 40, 60, 120 and infinity, and df2 from 1 to 30, then 40, 60, 120 and infinity. If your df is not listed, the cautious habit is to use the next smaller value, which gives a slightly larger critical value. The calculator removes the guesswork: type any whole df from 1 to 1000, or inf, and it returns the exact value. For example F(0.05; 1, ∞) = 3.841, which is the square of the normal critical value 1.96.
Left-tail values and swapped degrees of freedom
A left-tail critical value is not printed, because it can be found from the right-tail table: F(1 − α; df1, df2) = 1 / F(α; df2, df1). To find the value that leaves 5% in the left tail for df1 = 10 and df2 = 20, look up F(0.05; 20, 10) = 2.774 and take its reciprocal. The result is 0.426. The most common mistake is swapping df1 and df2: F(0.05; 10, 20) = 2.348, but F(0.05; 20, 10) = 2.774. Always put the numerator df on the columns and the denominator df on the rows.
Which alpha to choose
The 0.05 table is the default for most coursework. Use 0.01 when a false positive is costly, and 0.10 for exploratory work. The 0.025 table is useful when you run a two-sided variance-ratio test at the 5% level, because each tail then holds 0.025. Put the larger sample variance on top, then compare the ratio with the right-tail value from the 0.025 table; if you keep the original order, also check the left-tail value 1 / F(0.025; df2, df1). As a check, F(0.01; 5, 10) = 5.636 and F(0.10; 3, 20) = 2.380.
Frequently Asked Questions
Related Statistics Tools
 Research
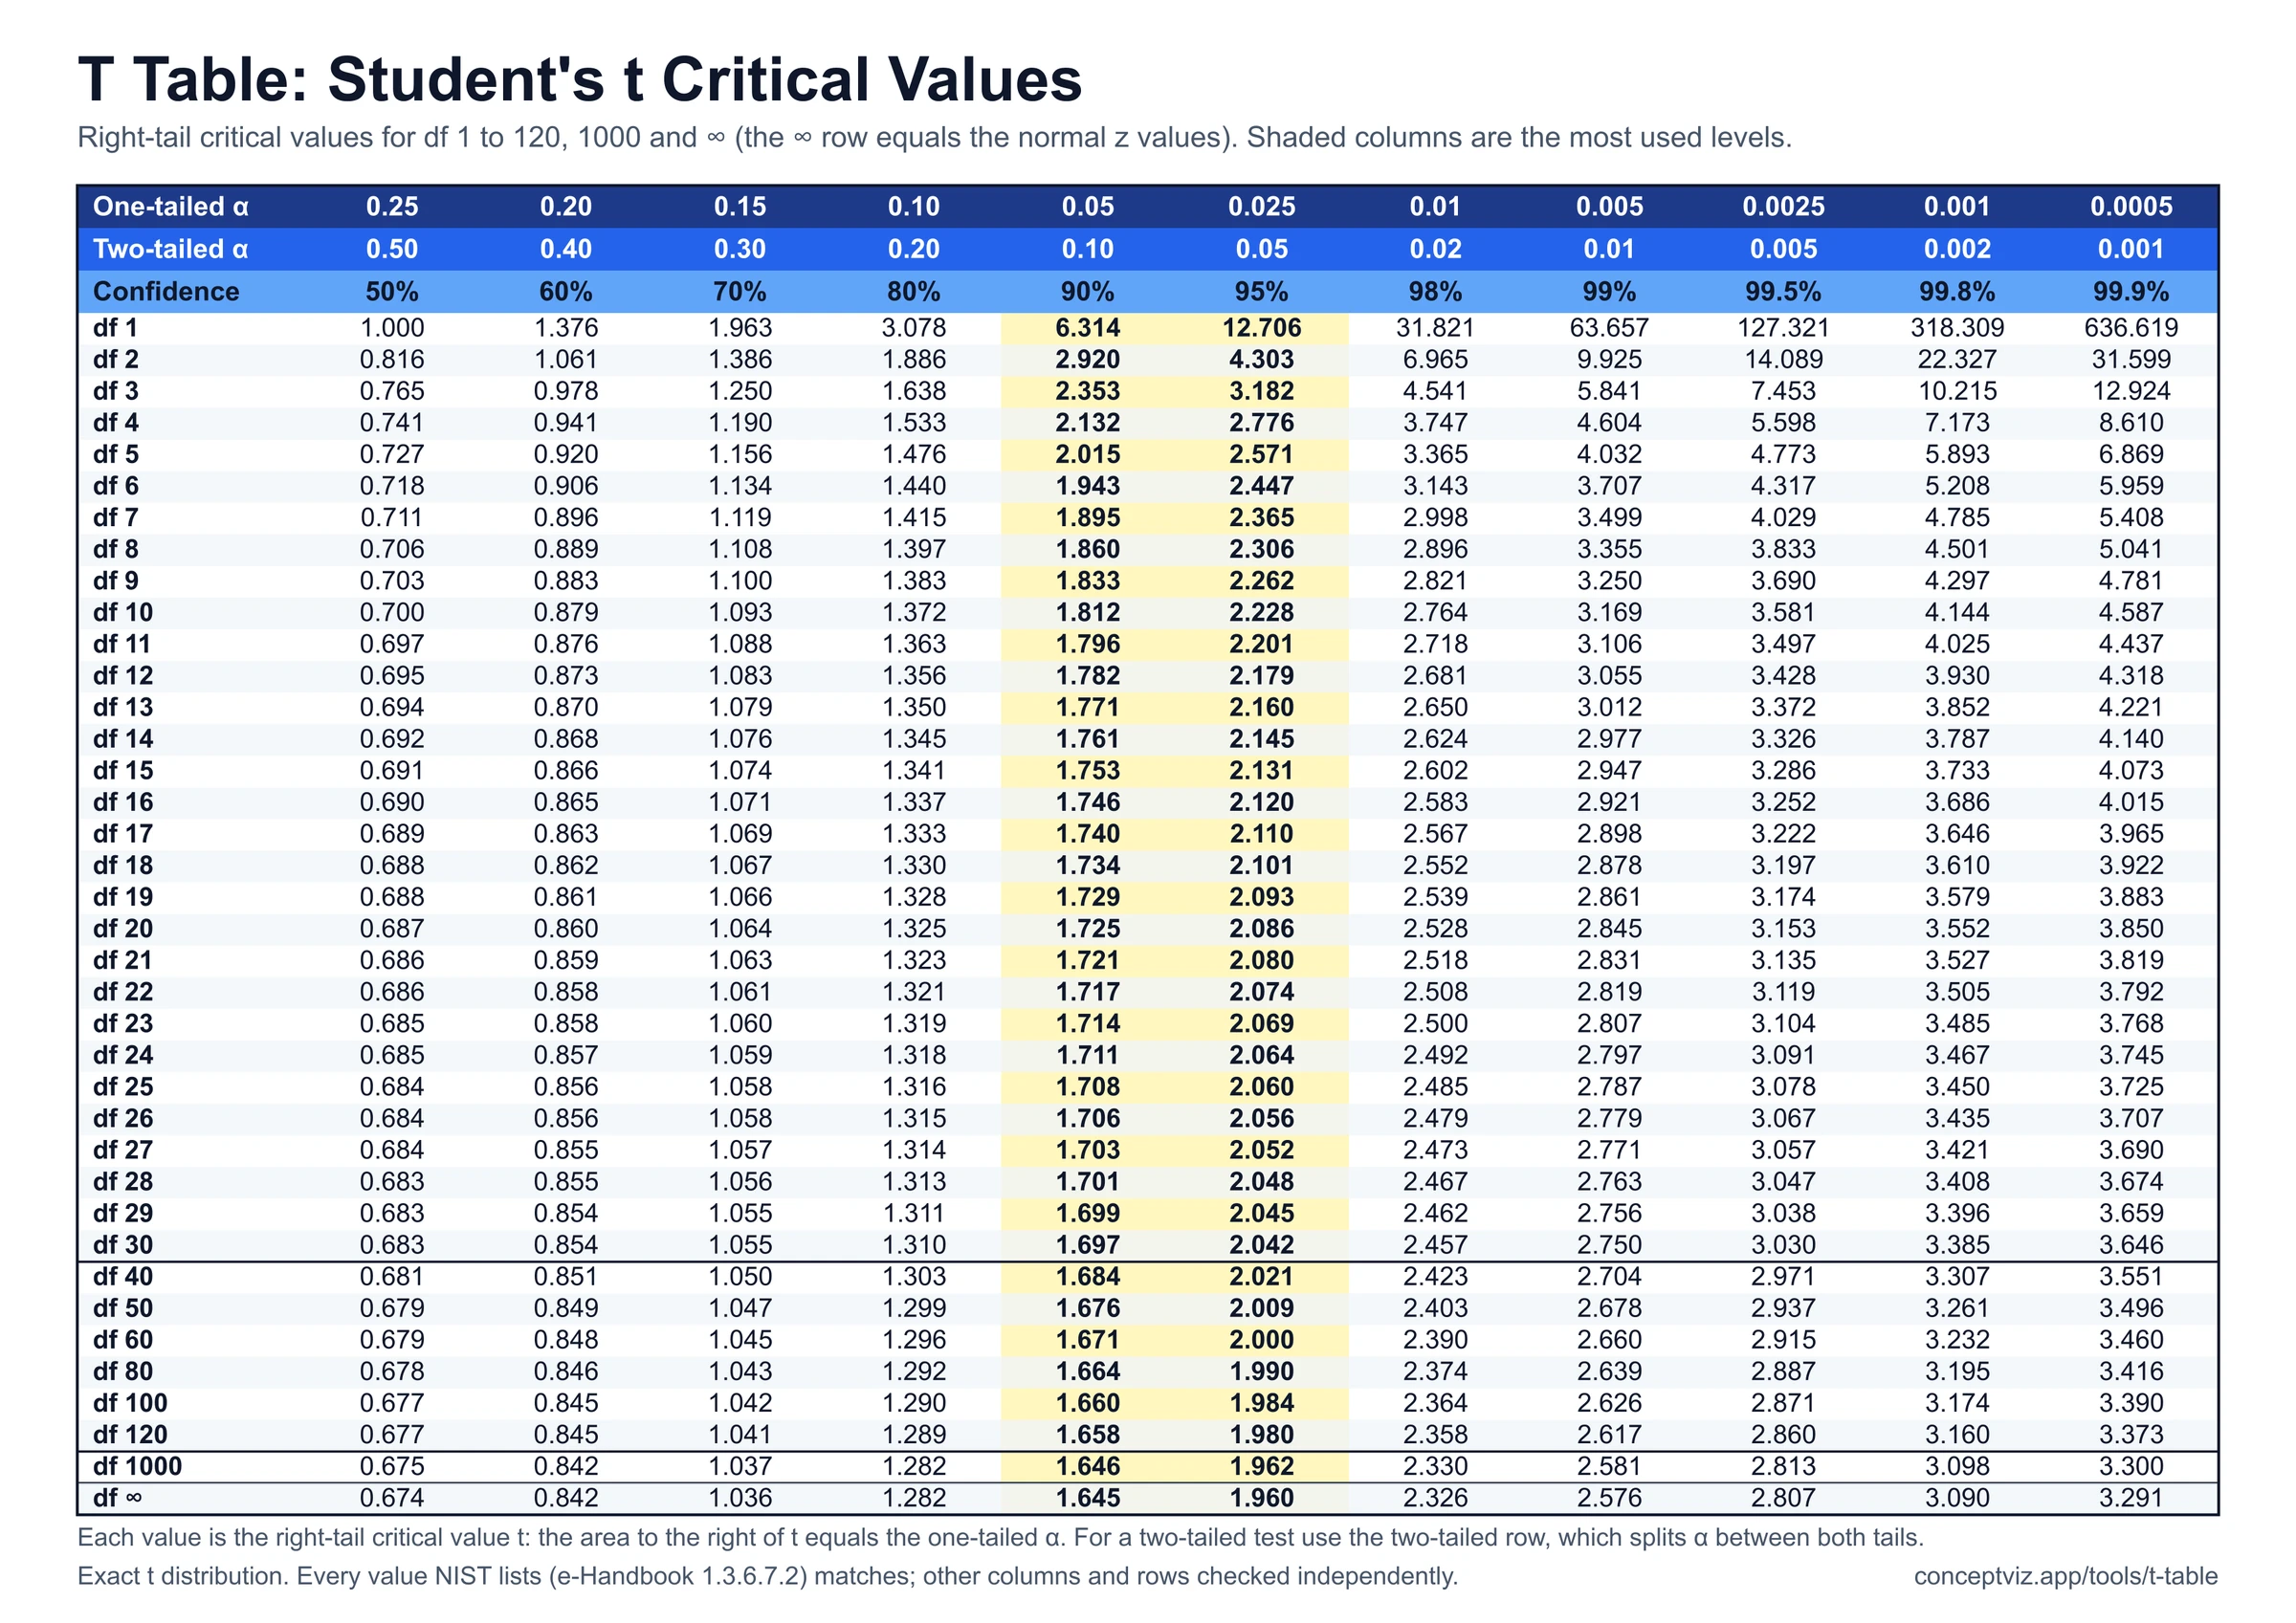
T Table
T table with one-tailed and two-tailed critical values for df 1 to 120 and infinity, a critical value and p-value calculator, and printable sheets.
 Research
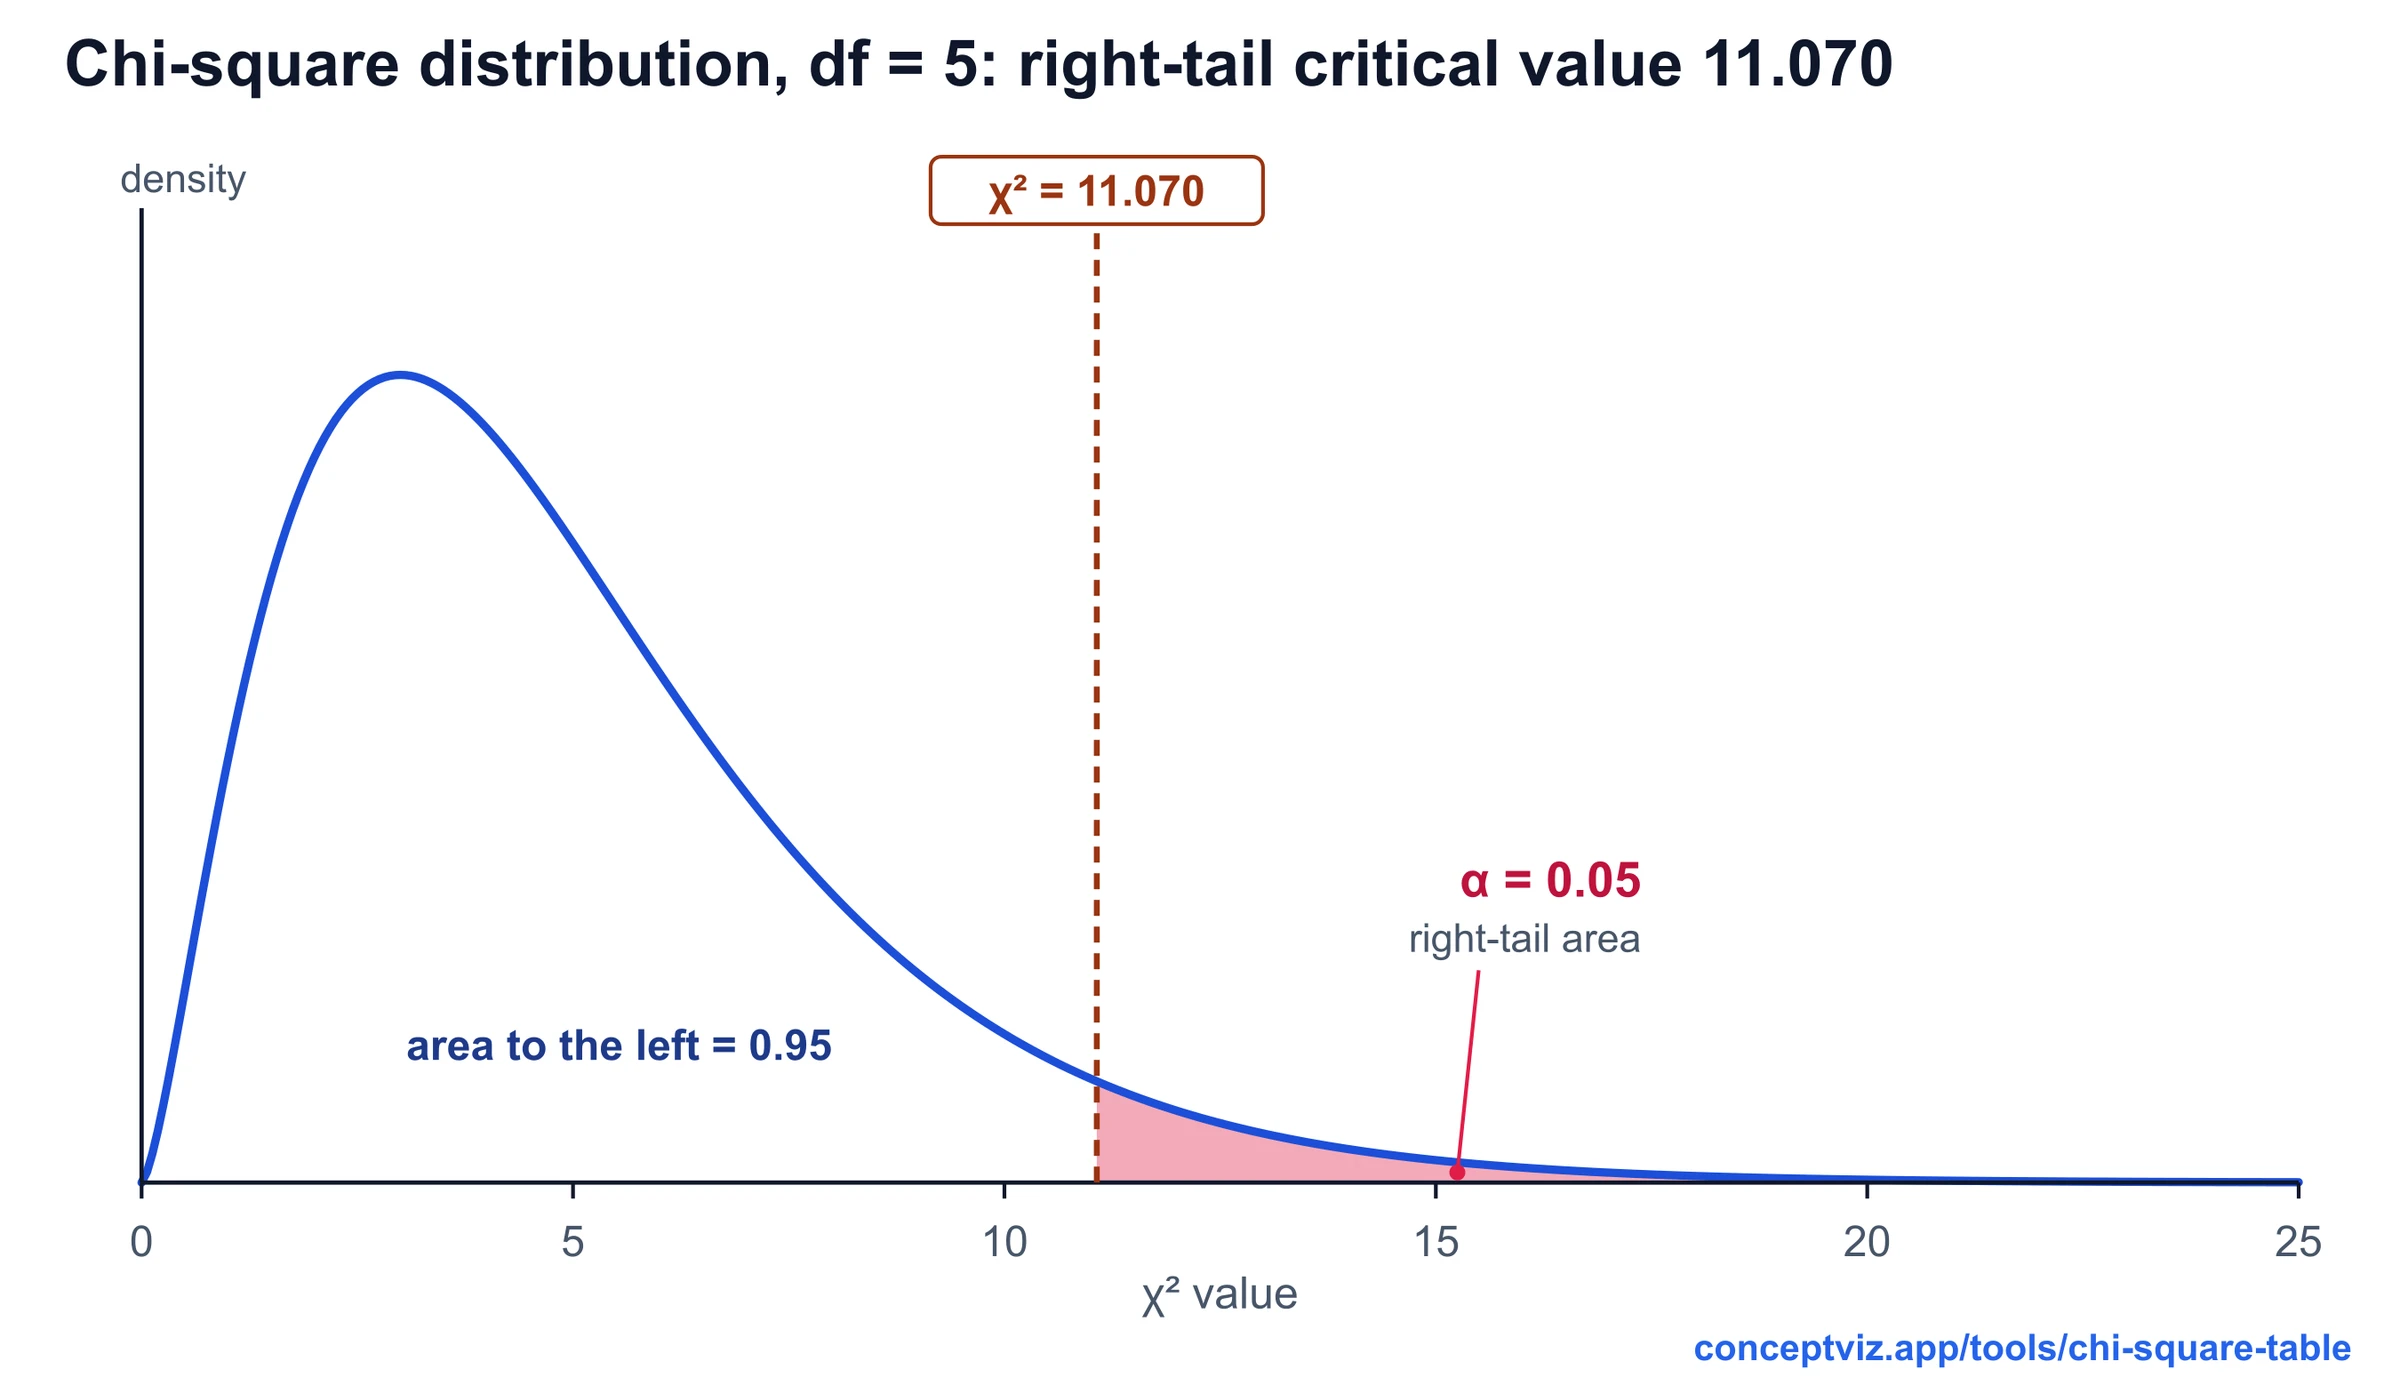
Chi-Square Table
Chi-square table with right-tail critical values for df 1 to 100, a p-value calculator with shaded area and lower-tail columns. Print or download.
 Research
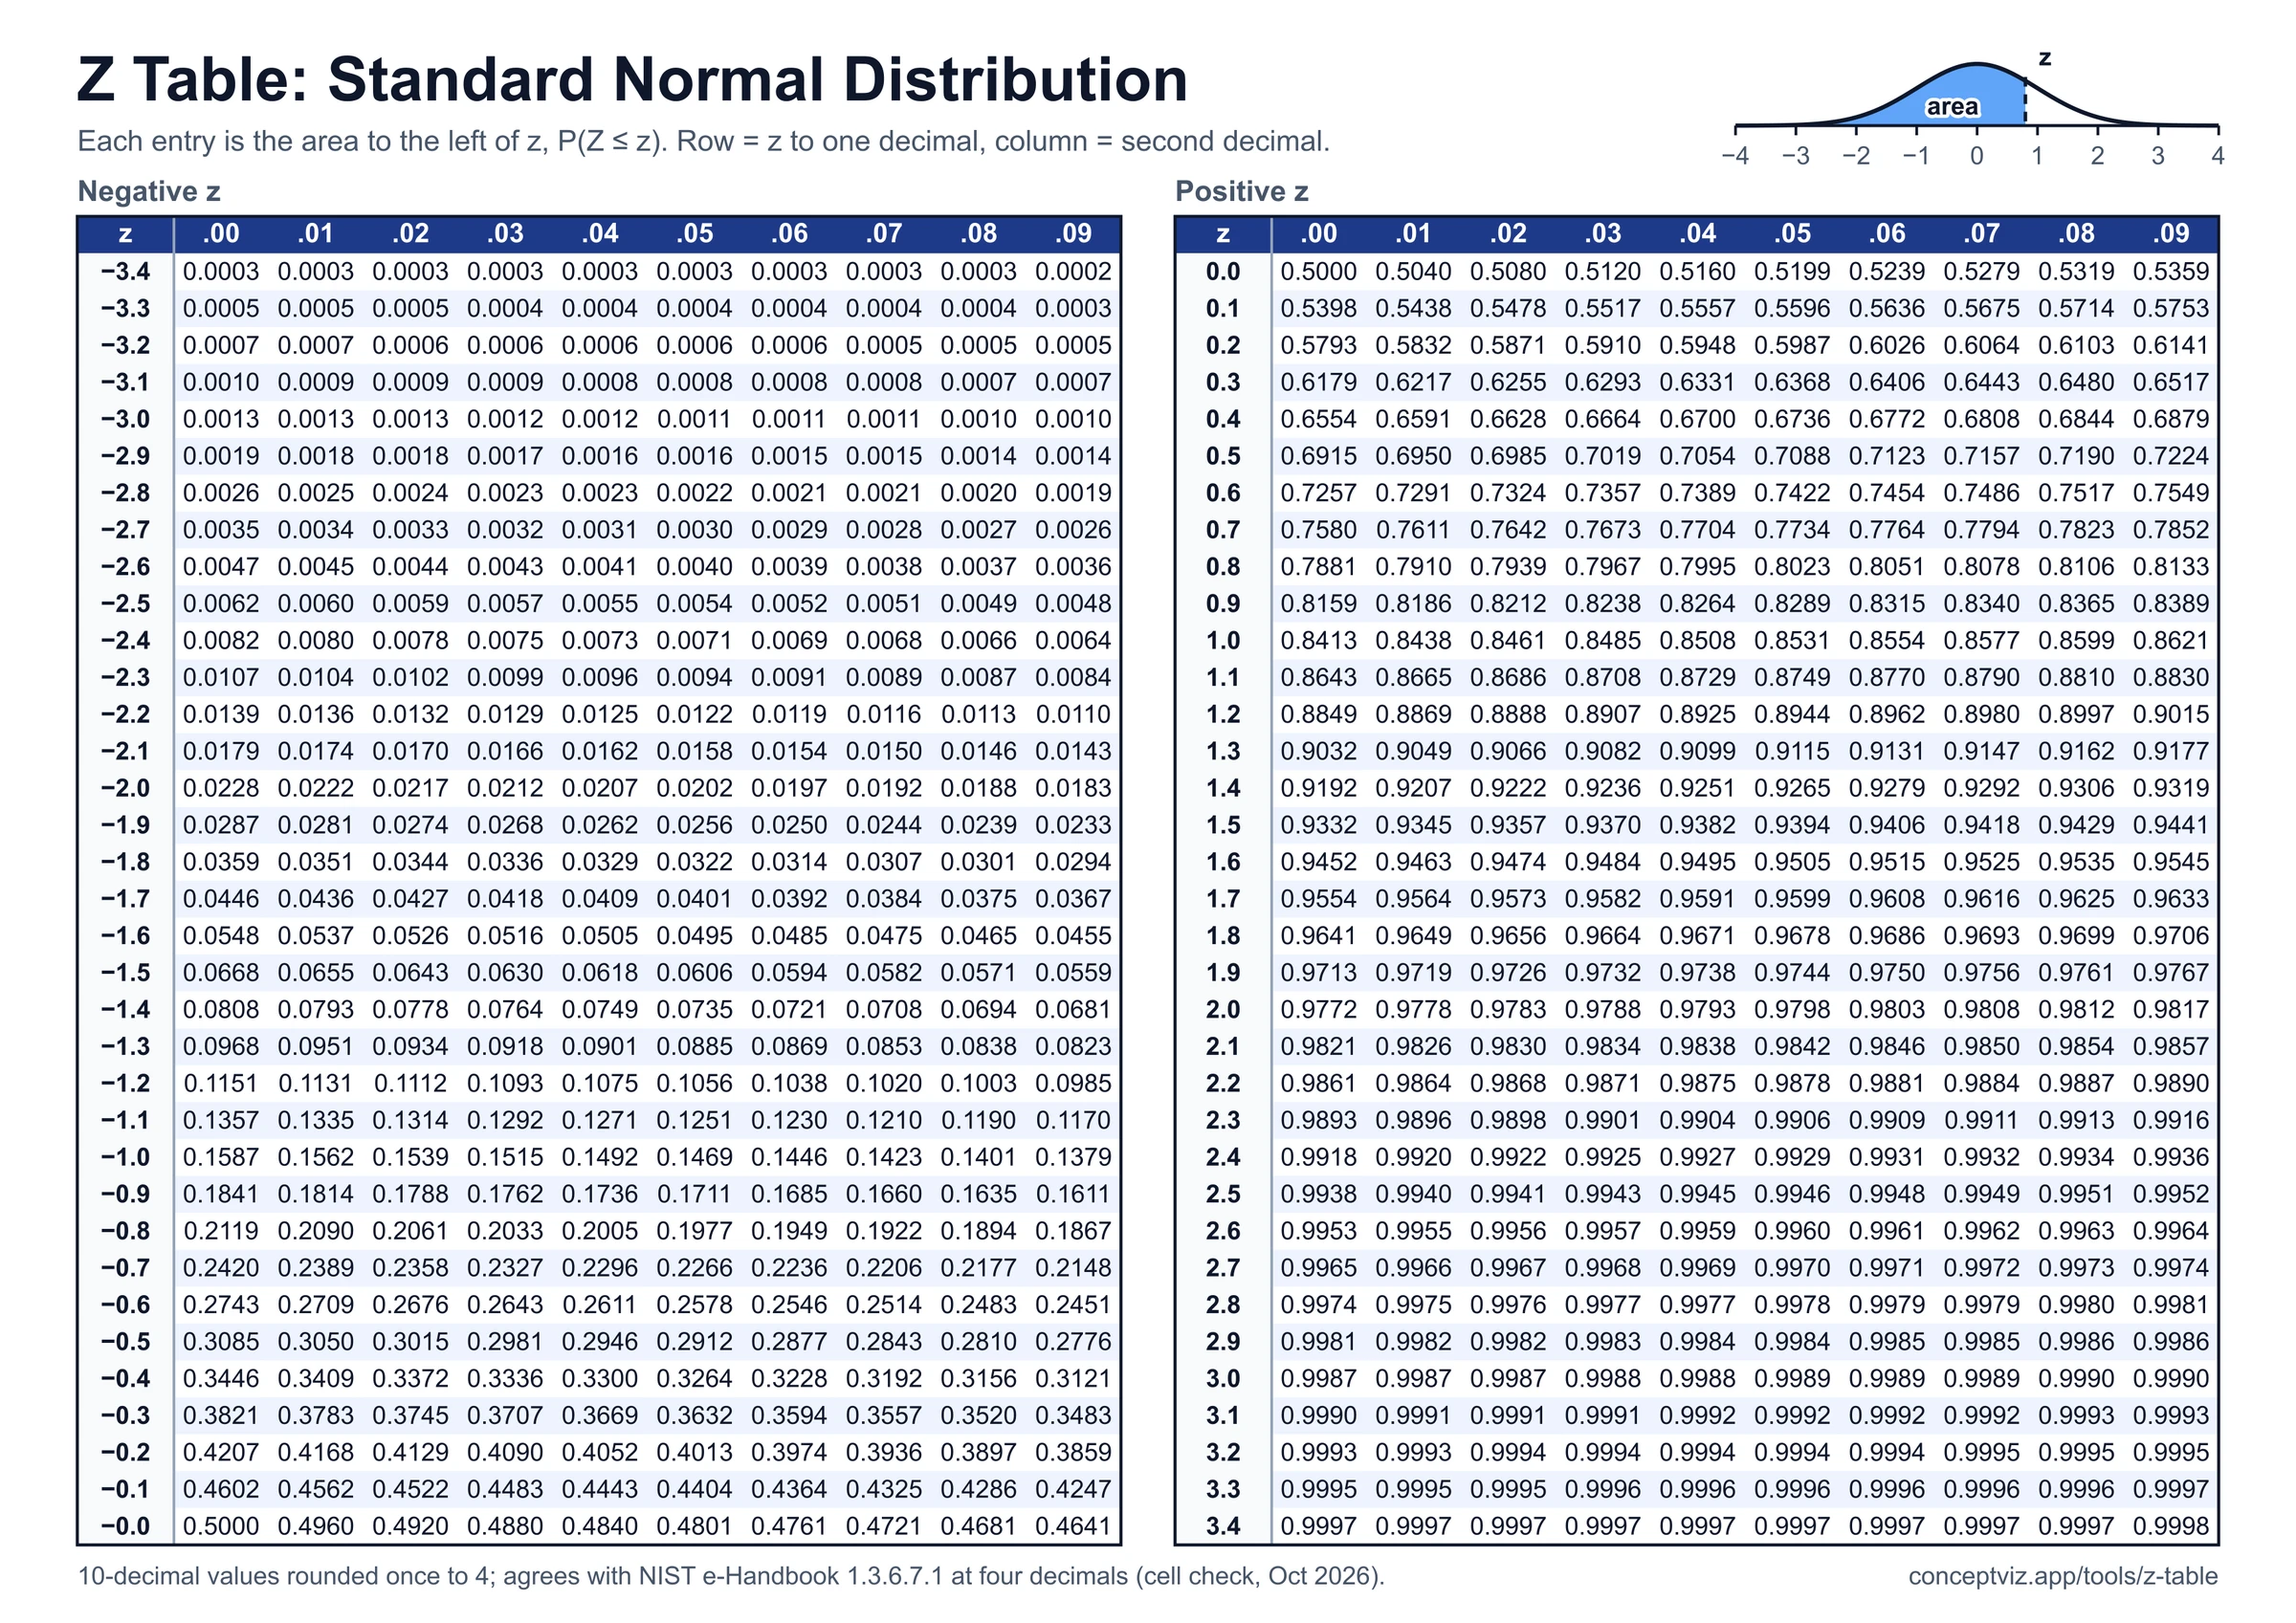
Z Table
Z table with positive and negative z-scores, left-tail cumulative area, z to p and p to z calculator, shaded curve and printable A4 and Letter sheets.