Wiggers Diagram Generator cardiac cycle
Free Wiggers diagram generator. Overlay ECG, pressure, volume, and heart sounds for one cardiac cycle and download labeled or blank SVG.
One teaching cardiac cycle as SVG: ECG, pressures, volume, and heart sounds — free, no account
Cycle options
Traces are teaching values at ~75 bpm, not pasted clinical data. Switching options only changes labels and which panels appear.
Wiggers Diagram Generator
Preview is free on this page ·
Your AI Wiggers illustration will appear here
For timed teaching traces, use the Precise Diagram tab instead
Wiggers Diagram Examples
The first five are exact engine renders. The last image is an AI illustration of Illustration mode.
Labeled left-heart cycle
Exact engine render — teaching traces at ~75 bpm, not a patient recording.
Blank worksheet
Exact engine render — same layout, labels removed for revision.
Phase bands
Exact engine render — the five teaching phases on the same traces.
ECG + pressures
Exact engine render — ECG and pressures only, for a first lecture slide.
Right-heart scale
Exact engine render — same timing, pulmonary pressure scale instead of 120 mmHg.
AI illustration — heart sounds
AI illustration of Illustration mode — slide art, not plotted from the engine.
What a Wiggers diagram is
A Wiggers diagram is the stacked cardiac-cycle plot used in every physiology lecture: ECG on top, arterial and chamber pressures, ventricular volume, and often heart sounds, all on one time axis. This page draws that figure as an exact SVG. It is not a heart-anatomy worksheet and it is not a patient monitor dump. The nearest anatomy page is the heart diagram generator; use that when you need chambers and valves drawn as a picture.
What the traces lock
- One ~800 ms beat (~75 bpm). Times are teaching marks, not a recorded ECG.
- Left heart default: LV ~8–120 mmHg, aorta 80–120 mmHg with a dicrotic notch, LA a/c/v waves, EDV ~130 mL and ESV ~60 mL.
- Valve order: mitral close (S1) → isovolumetric contraction → aortic open → ejection → aortic close (S2) → isovolumetric relaxation → mitral open → filling.
- Right-heart mode keeps the same timing and drops pressures onto a pulmonary scale (~25/10 mmHg).
Labeled, blank, phases, and simplified
Start with the labeled left-heart figure so the room can see every curve. Use the blank copy of the same layout for a self-test. Phase bands name atrial systole, isovolumetric contraction, ejection, isovolumetric relaxation, and filling. The simplified option keeps ECG and pressures only. Heart-sounds mode keeps S1 at mitral closure and S2 at aortic closure. Those are the lecture-pack variants people search as “Wiggers diagram labeled” and “cardiac cycle diagram.”
Precise SVG vs AI illustration
The Precise Diagram tab is the version for class and papers: event times and teaching amplitudes are fixed in code. The AI Illustration tab is only for slide mockups. Check every notch, valve line, and S1/S2 mark against the precise traces before you project the file or put it in a paper. Do not ask the AI tab for a cartoon heart — that job belongs on the heart diagram page.
Frequently Asked Questions
Related Medical Tools
 Medical
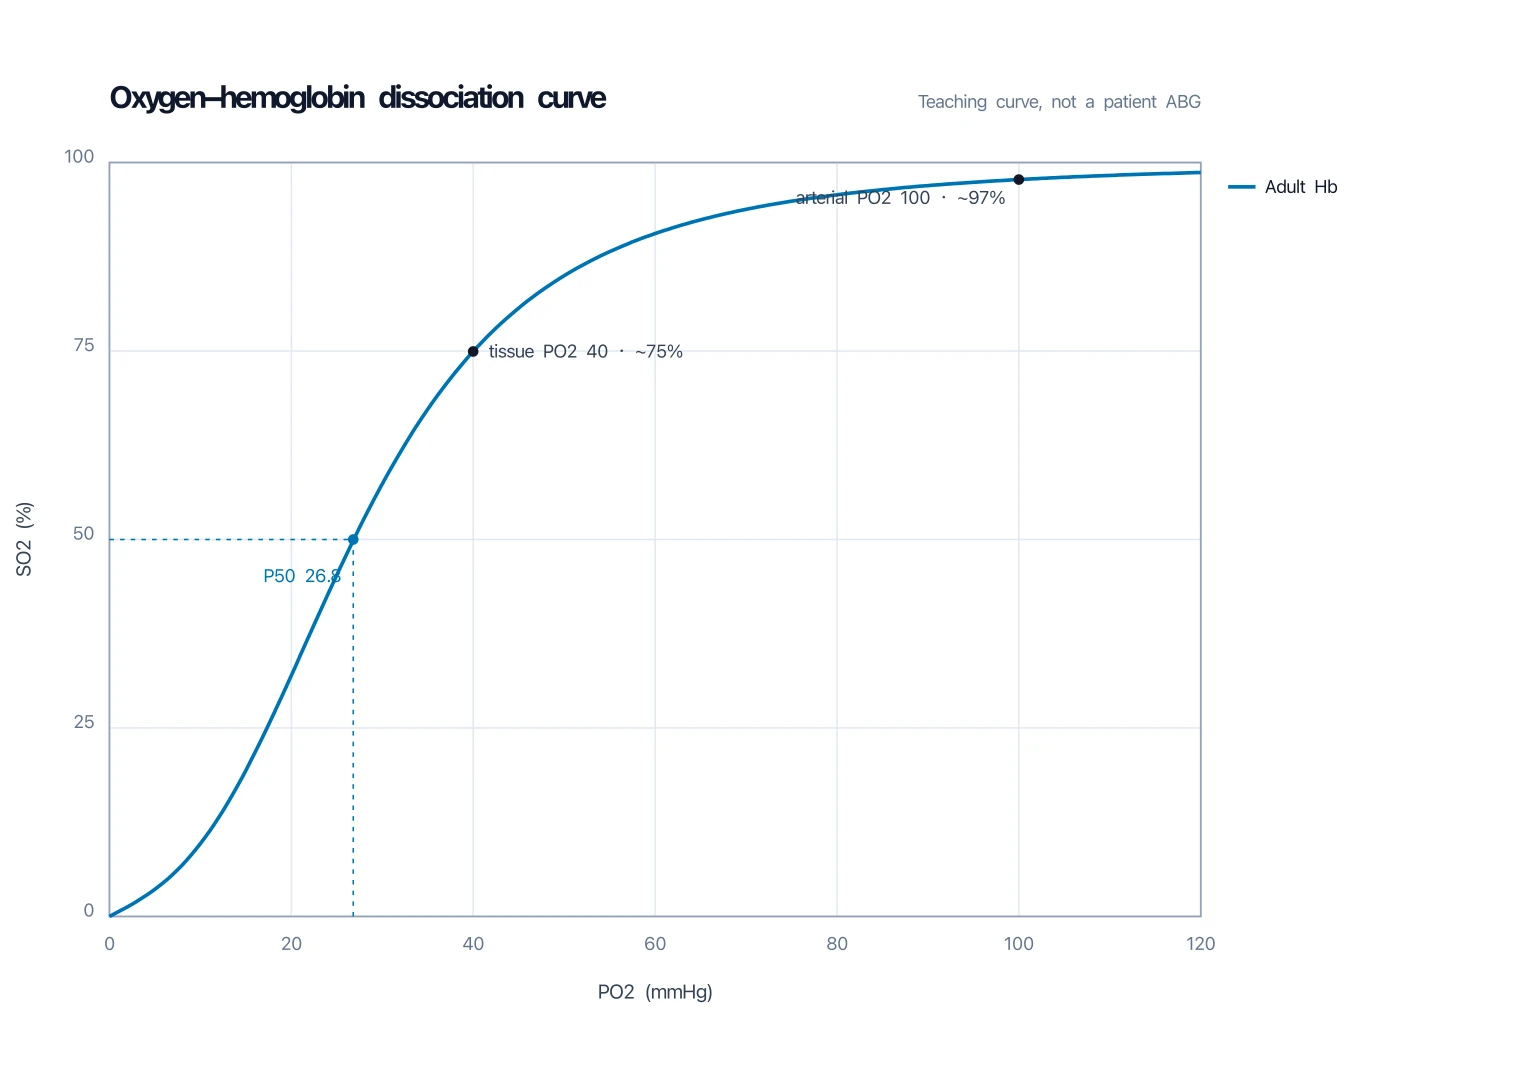
Oxygen-Hemoglobin Dissociation Curve Generator
Sigmoid SO2 versus PO2 with P50 — another physiology lecture plot, not the cardiac cycle.
 Medical
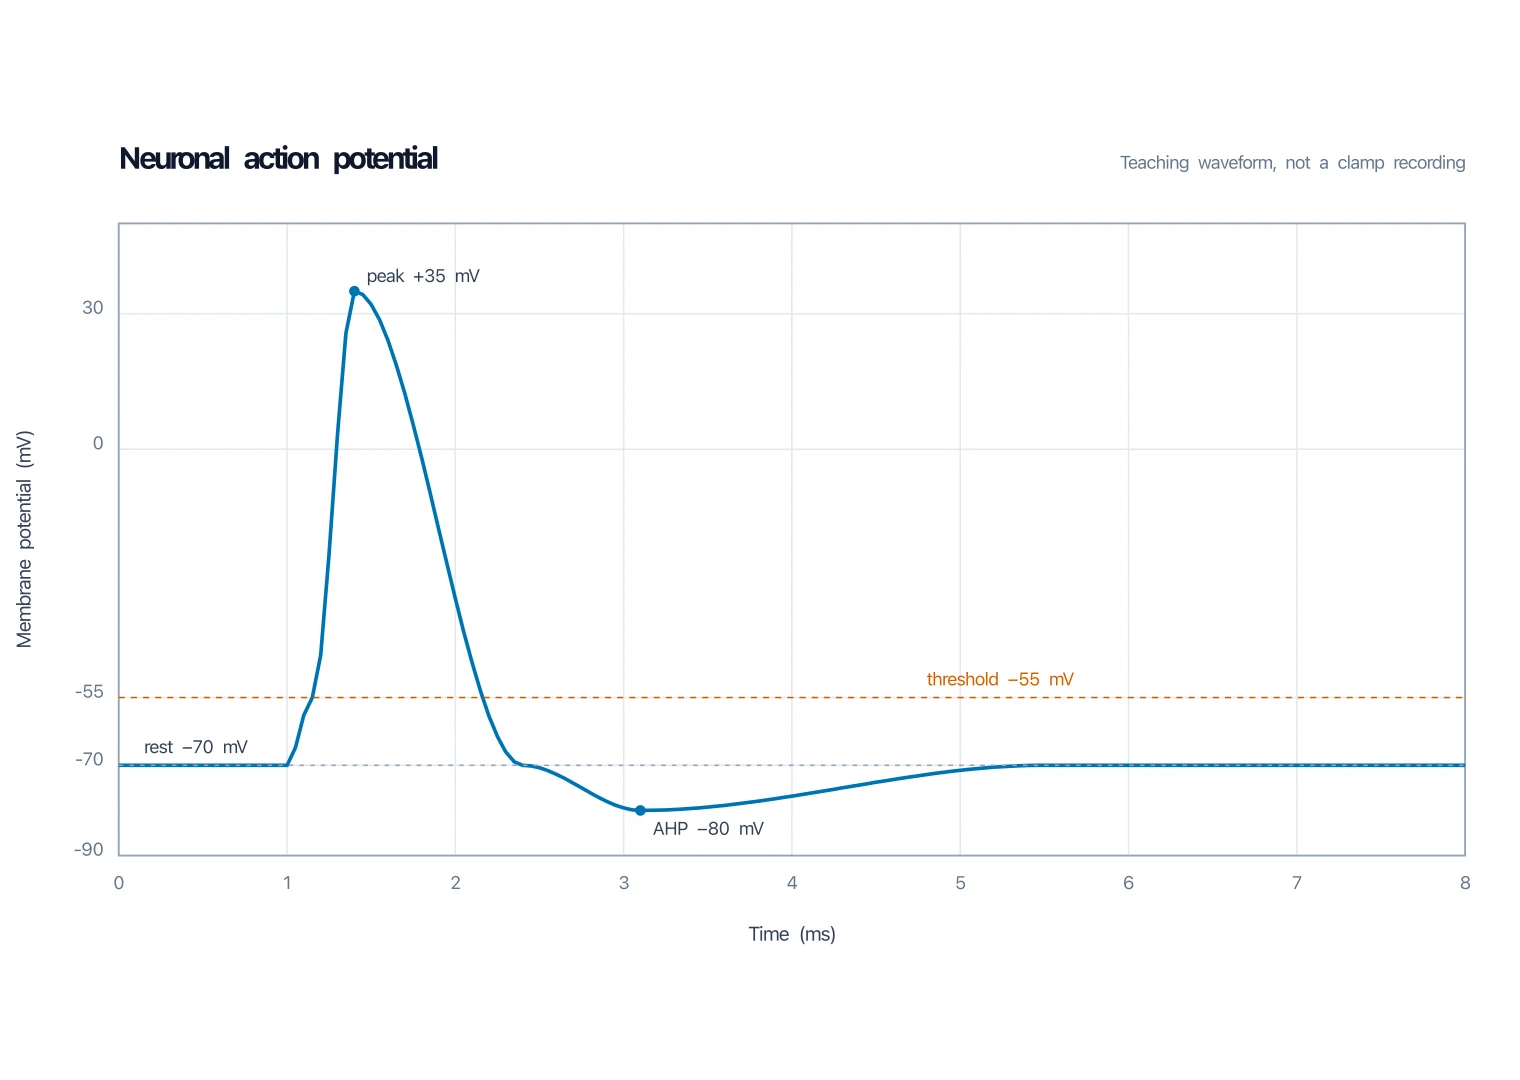
Action Potential Graph Generator
Membrane voltage versus time — the ventricular spike and plateau, not the stacked cardiac-cycle plot.
 Medical
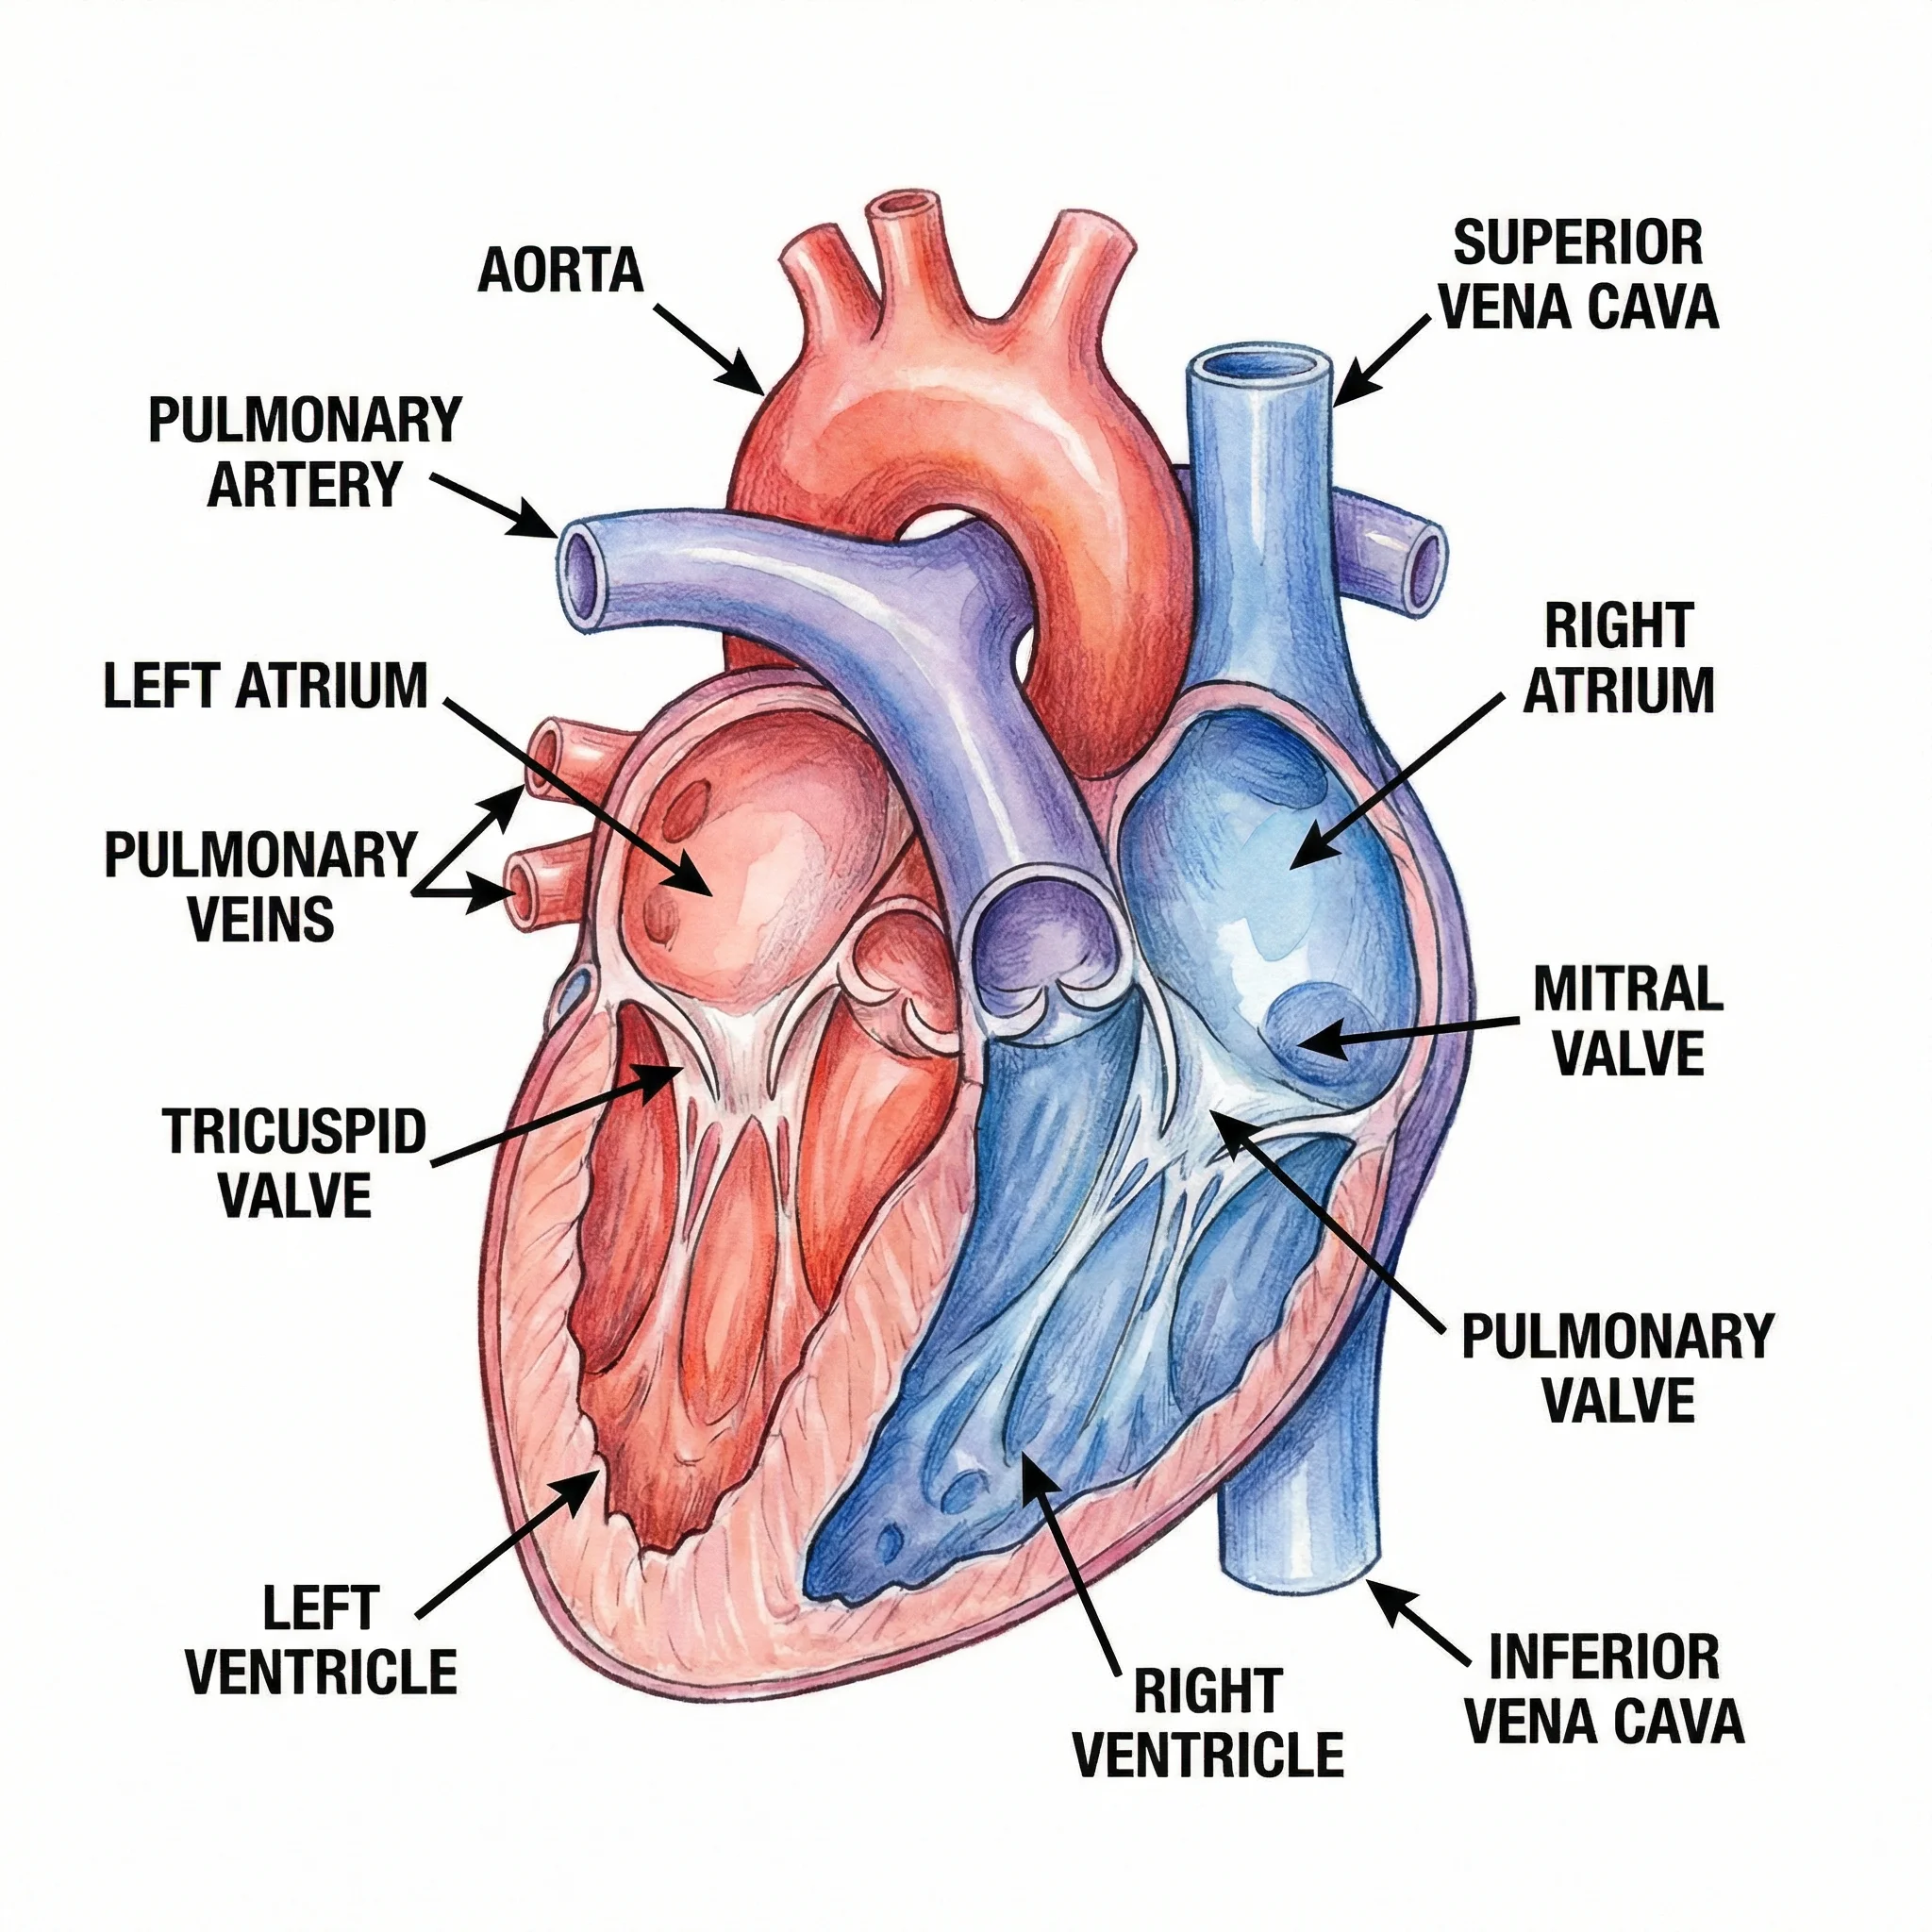
Heart Diagram Generator
Chamber and valve anatomy — the picture of the heart, not the Wiggers time plot.
 Medical
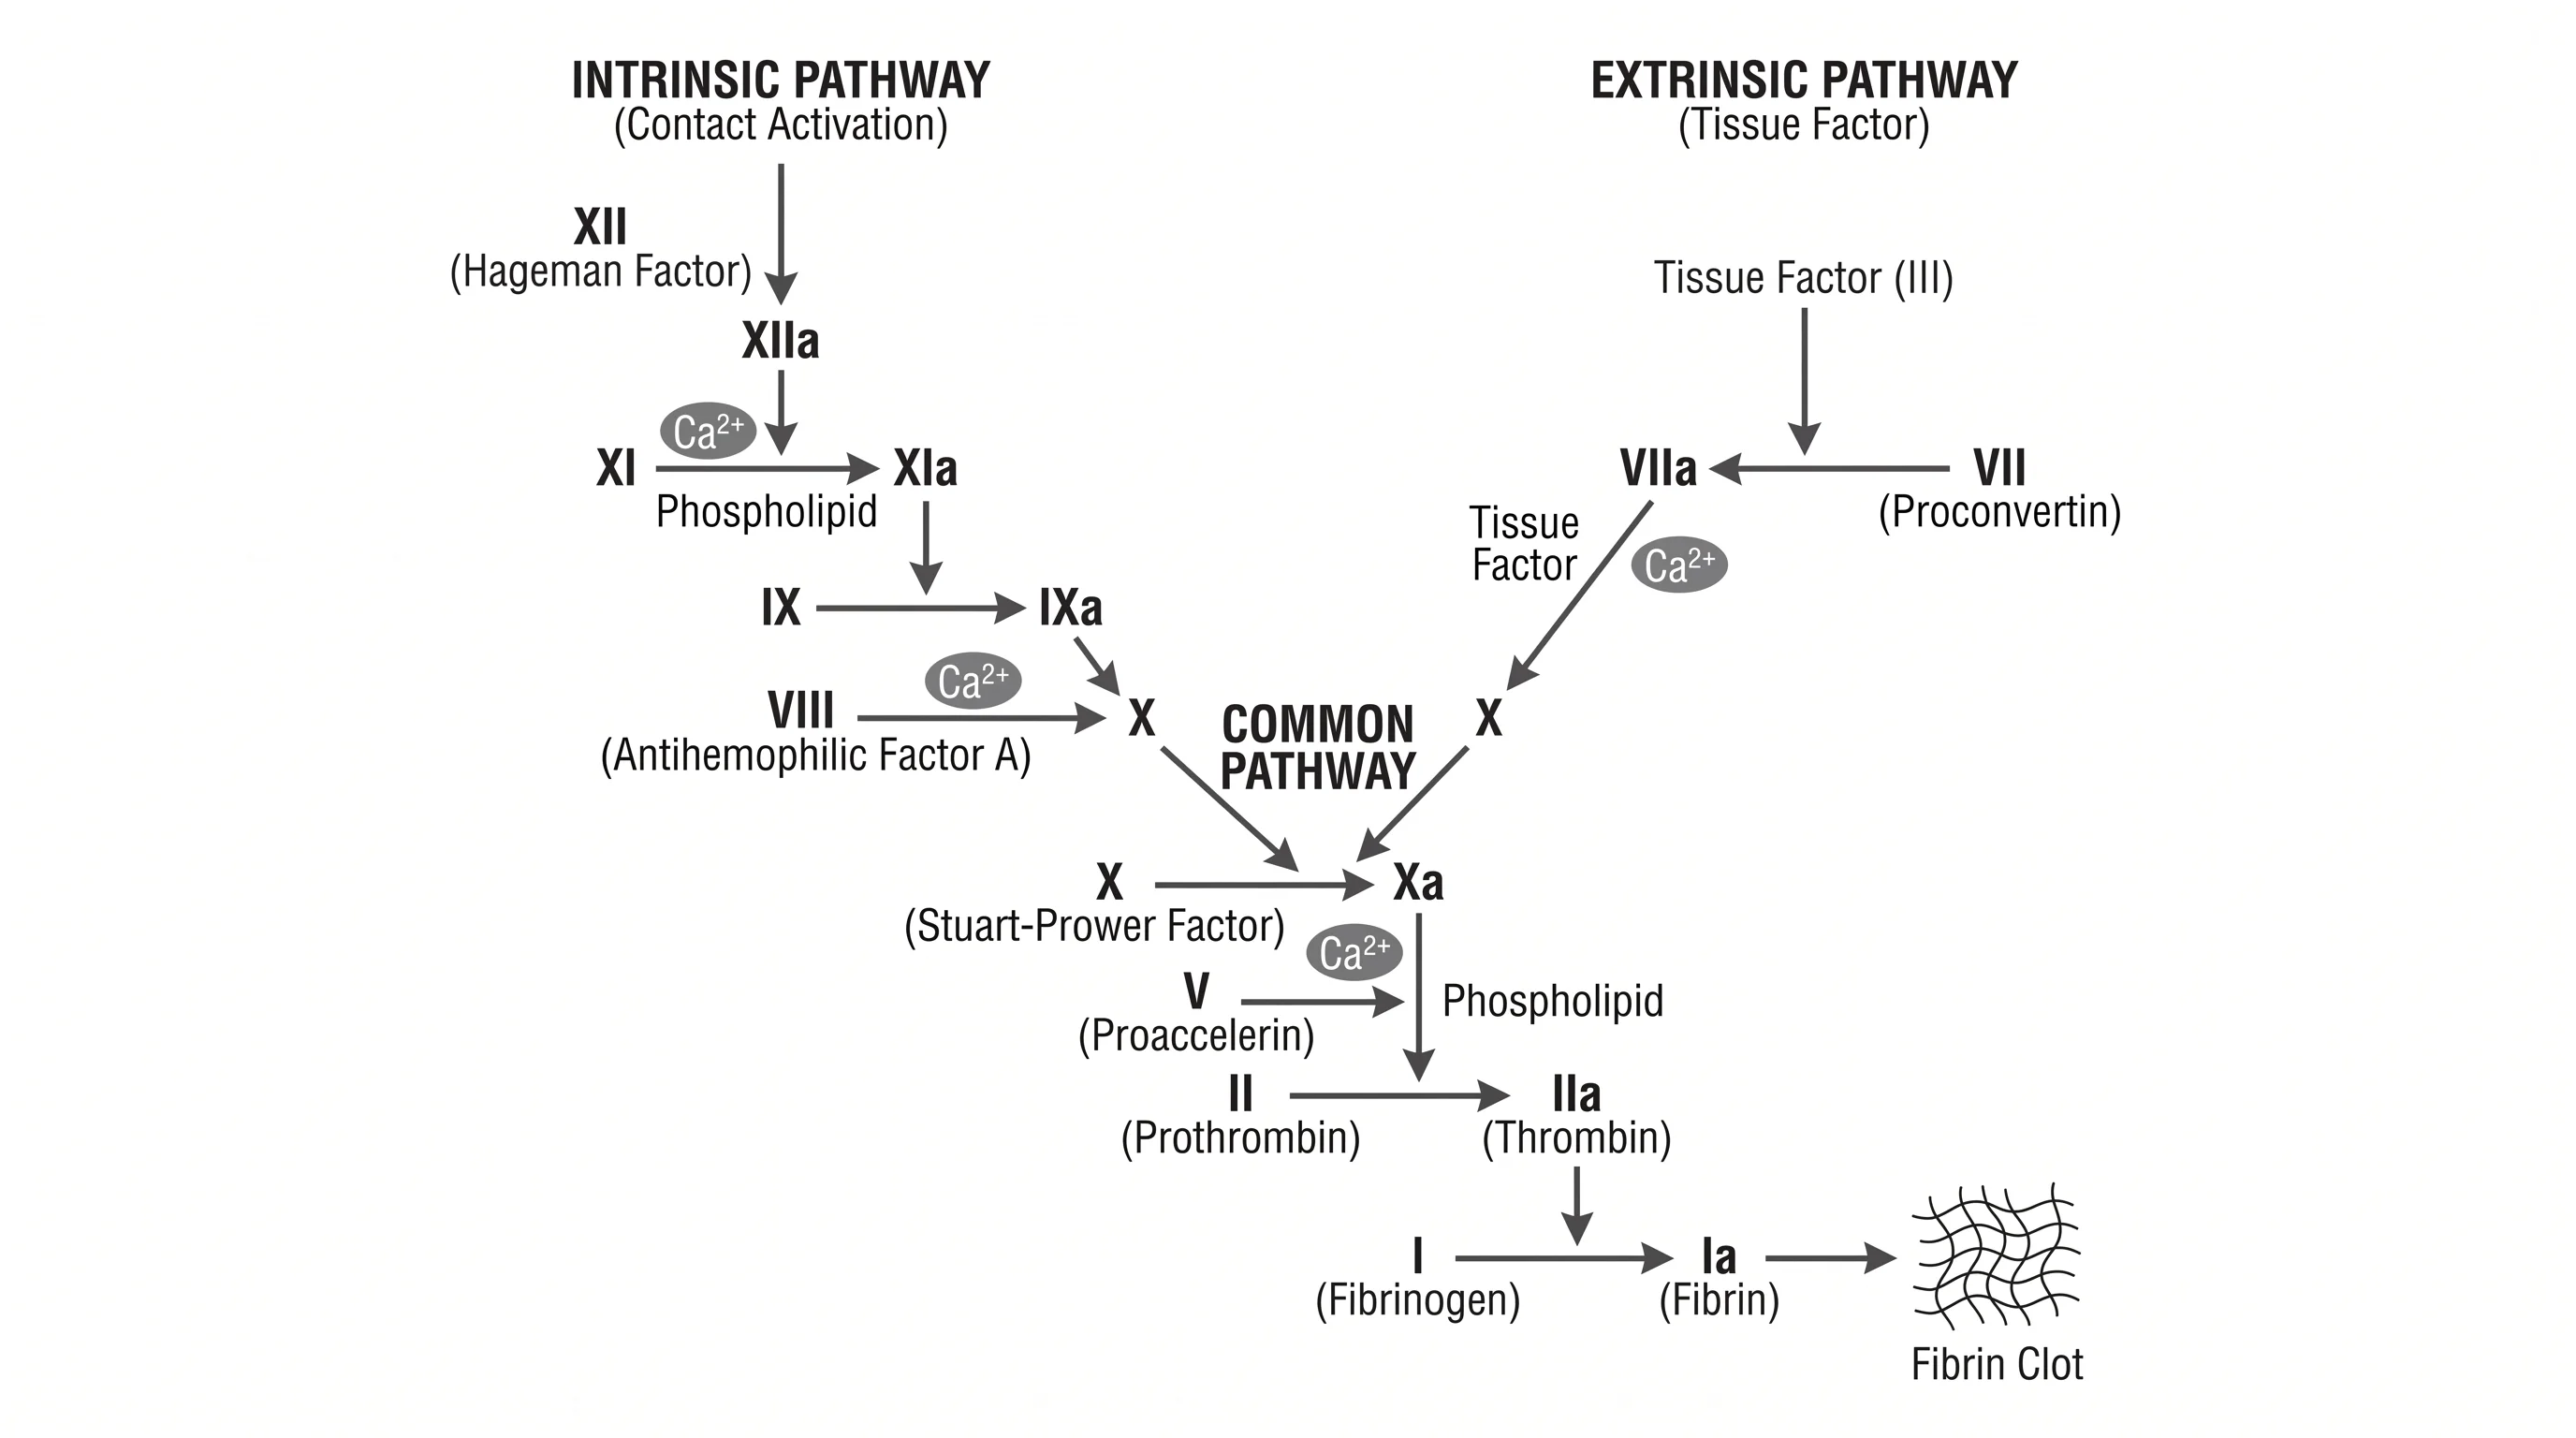
Coagulation Cascade Diagram Generator
Another lecture-pack medical figure: labeled, blank, or annotated clotting cascade.
MedicalMedical Illustration Generator
Broader clinical figures when the cardiac-cycle plot is only one panel in a slide.