Oxygen-Hemoglobin Dissociation Curve Generator dissociation curve
Free oxygen-hemoglobin dissociation curve generator. Draw the sigmoid SO2–PO2 plot, mark P50, and download labeled, blank, left-shift, or right-shift SVG.
Sigmoid SO2 versus PO2 as SVG: P50, tissue and arterial marks, left or right shift — free, no account
Curve options
Adult hemoglobin uses the Severinghaus teaching relationship. Shifts move P50. This is not pasted arterial-blood-gas data.
Oxygen-Hemoglobin Dissociation Curve Generator
Preview is free on this page ·
Your AI oxygen-hemoglobin curve illustration will appear here
For a locked P50 and shift direction, use the Precise Diagram tab instead
Oxygen-Hemoglobin Dissociation Curve Examples
All six images are exact engine renders of the Precise Diagram tab.
Labeled adult curve
Exact engine render — Severinghaus teaching curve, not a patient ABG.
Blank worksheet
Exact engine render — same sigmoid, labels removed for revision.
Right shift
Exact engine render — higher P50 unloads more O2 at the same PO2.
Left shift
Exact engine render — lower P50 holds more O2 at the same PO2.
Fetal vs adult
Exact engine render — fetal Hb sits left of the adult teaching curve.
Myoglobin overlay
Exact engine render — myoglobin is hyperbolic, hemoglobin is sigmoid.
What the oxygen-hemoglobin dissociation curve is
The oxygen-hemoglobin dissociation curve (also called the oxyhemoglobin dissociation curve, oxygen dissociation curve, or ODC) is the sigmoid plot of hemoglobin saturation (SO2) against partial pressure of oxygen (PO2). This page draws that lecture figure as an exact SVG. It is not a hemoglobin ribbon cartoon, and it is not the atomic Bohr model. Use the protein-structure page when you need subunits and heme drawn as a picture; use the Bohr-model maker only for electron shells.
What the traces lock
- Adult hemoglobin follows the Severinghaus (1979) teaching relationship. Standard P50 is 26.8 mmHg, and saturation at P50 is 50%.
- Tissue teaching point: PO2 40 mmHg ≈ 75% saturation. Arterial teaching point: PO2 100 mmHg ≈ 97% saturation.
- The adult curve is sigmoid: steepest near P50, flatter on the arterial plateau. Myoglobin is a rectangular hyperbola (Hill n = 1), not an S-shape.
- Right shift raises P50 and lowers saturation at the same PO2 (CADET: CO2, acid, 2,3-DPG, exercise, temperature). Left shift does the reverse. Fetal Hb is a left-shifted overlay, not a new axis.
Labeled, blank, shifts, fetal, and myoglobin
Start with the labeled adult curve so the room can see P50 and the 40 / 100 mmHg marks. Use the blank copy of the same axes for a self-test. Right-shift and left-shift overlays keep the adult curve on the plot so the direction is visible. Fetal versus adult and the optional myoglobin overlay match the usual lecture-pack variants people search as “oxyhemoglobin dissociation curve,” “ODC P50,” and “Bohr shift.” The Bohr shift on this page is the physiology shift of the O2 curve. It is not the Bohr atomic model.
Precise SVG vs AI illustration
The Precise Diagram tab is the version for class and papers: P50, sat(40), sat(100), and shift direction are fixed in code. The AI Illustration tab is only for slide mockups. Check every P50 mark and left/right overlay against the precise traces before you project the file or put it in a paper. Do not ask the AI tab for a Bohr atom or a default hemoglobin cartoon.
Frequently Asked Questions
Related Medical Tools
 Medical
Dose-Response Curve Generator
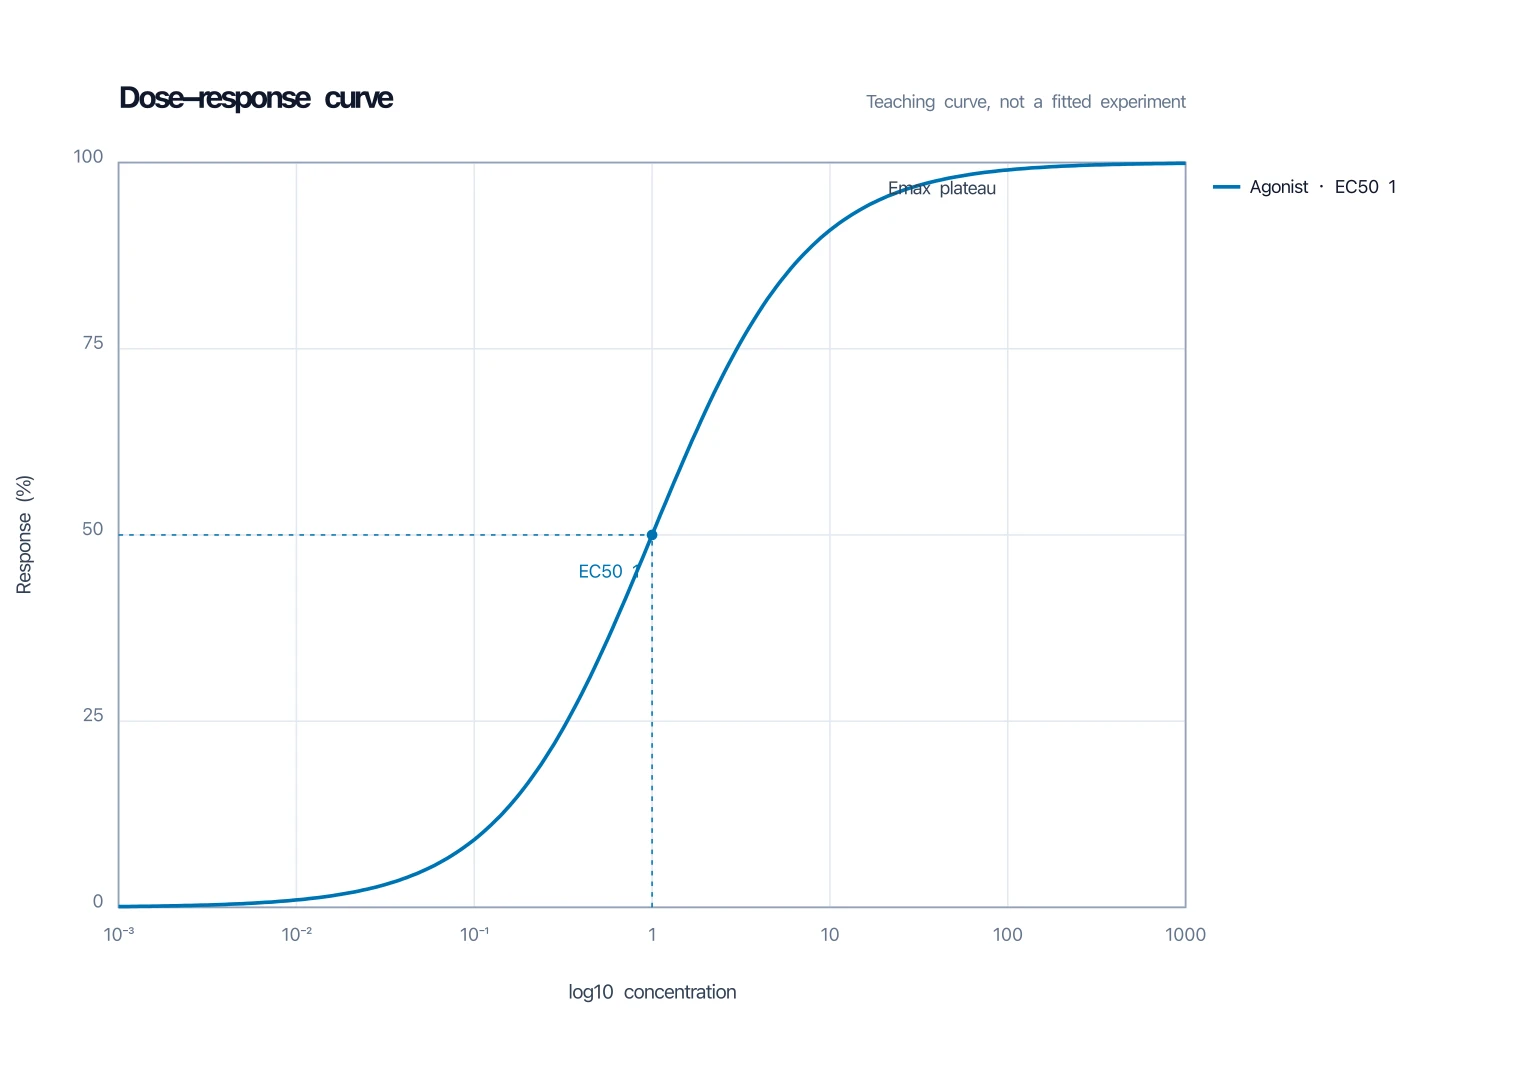
Sigmoid log-dose plot with EC50 or IC50 — another lecture curve, not SO2 versus PO2.
 Medical
Wiggers Diagram Generator
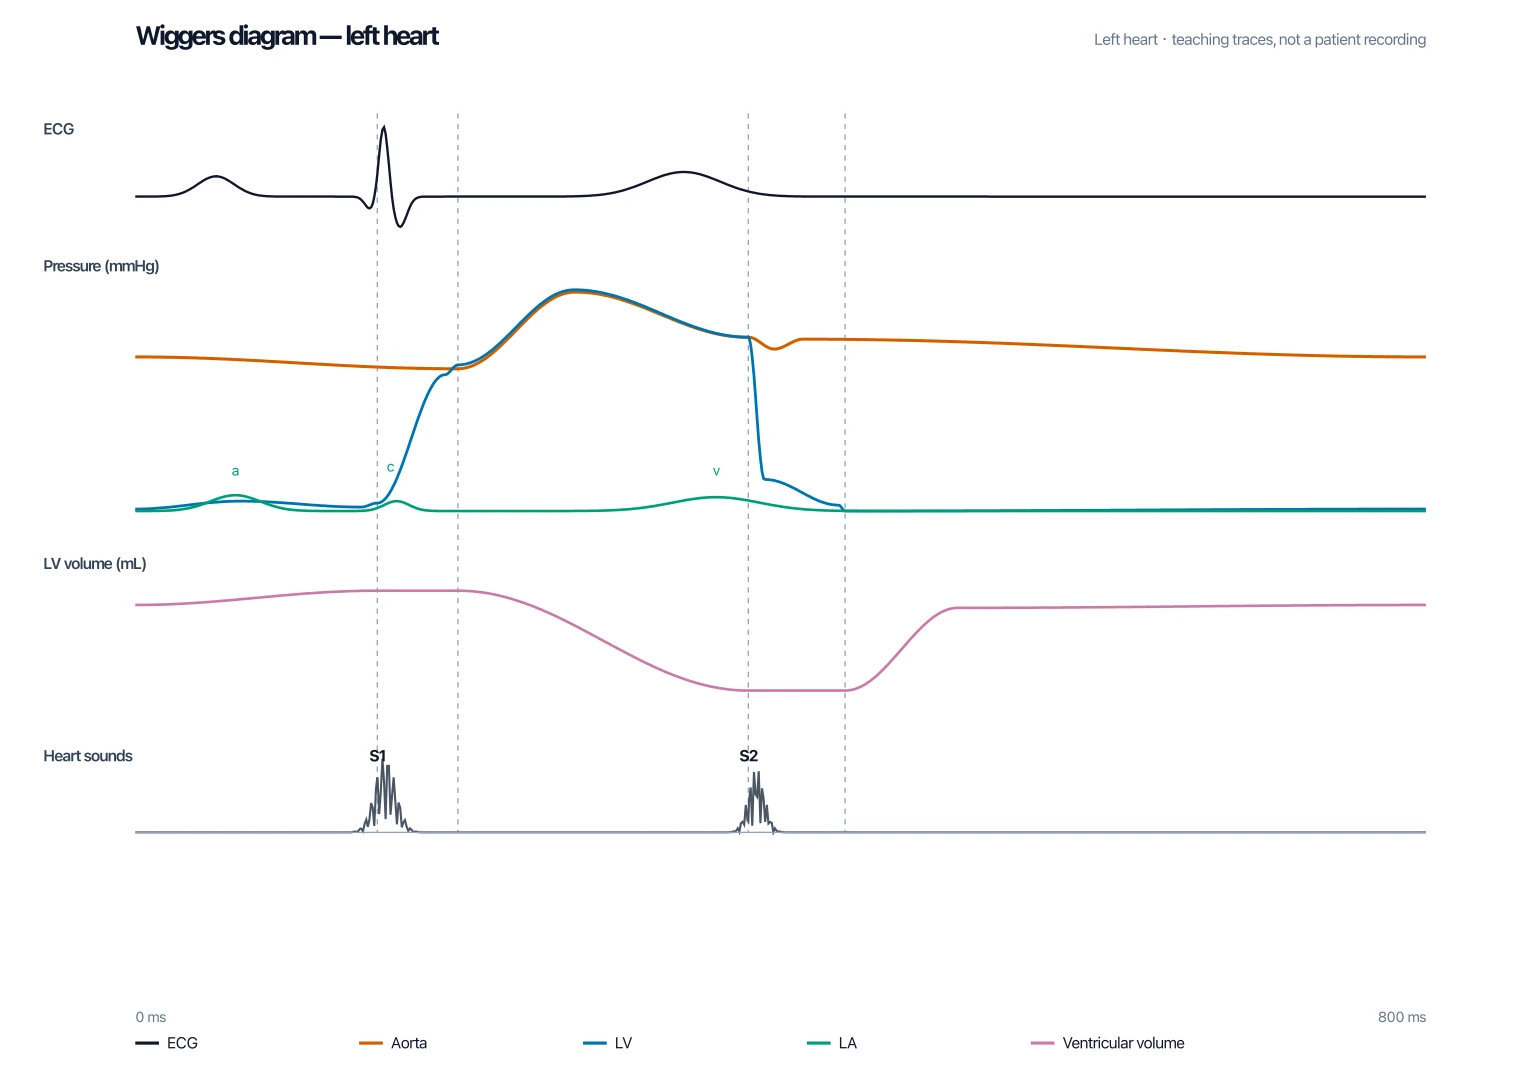
Stacked cardiac-cycle plot — another physiology lecture figure, not the O2 curve.
 Medical
Medical Illustration Generator
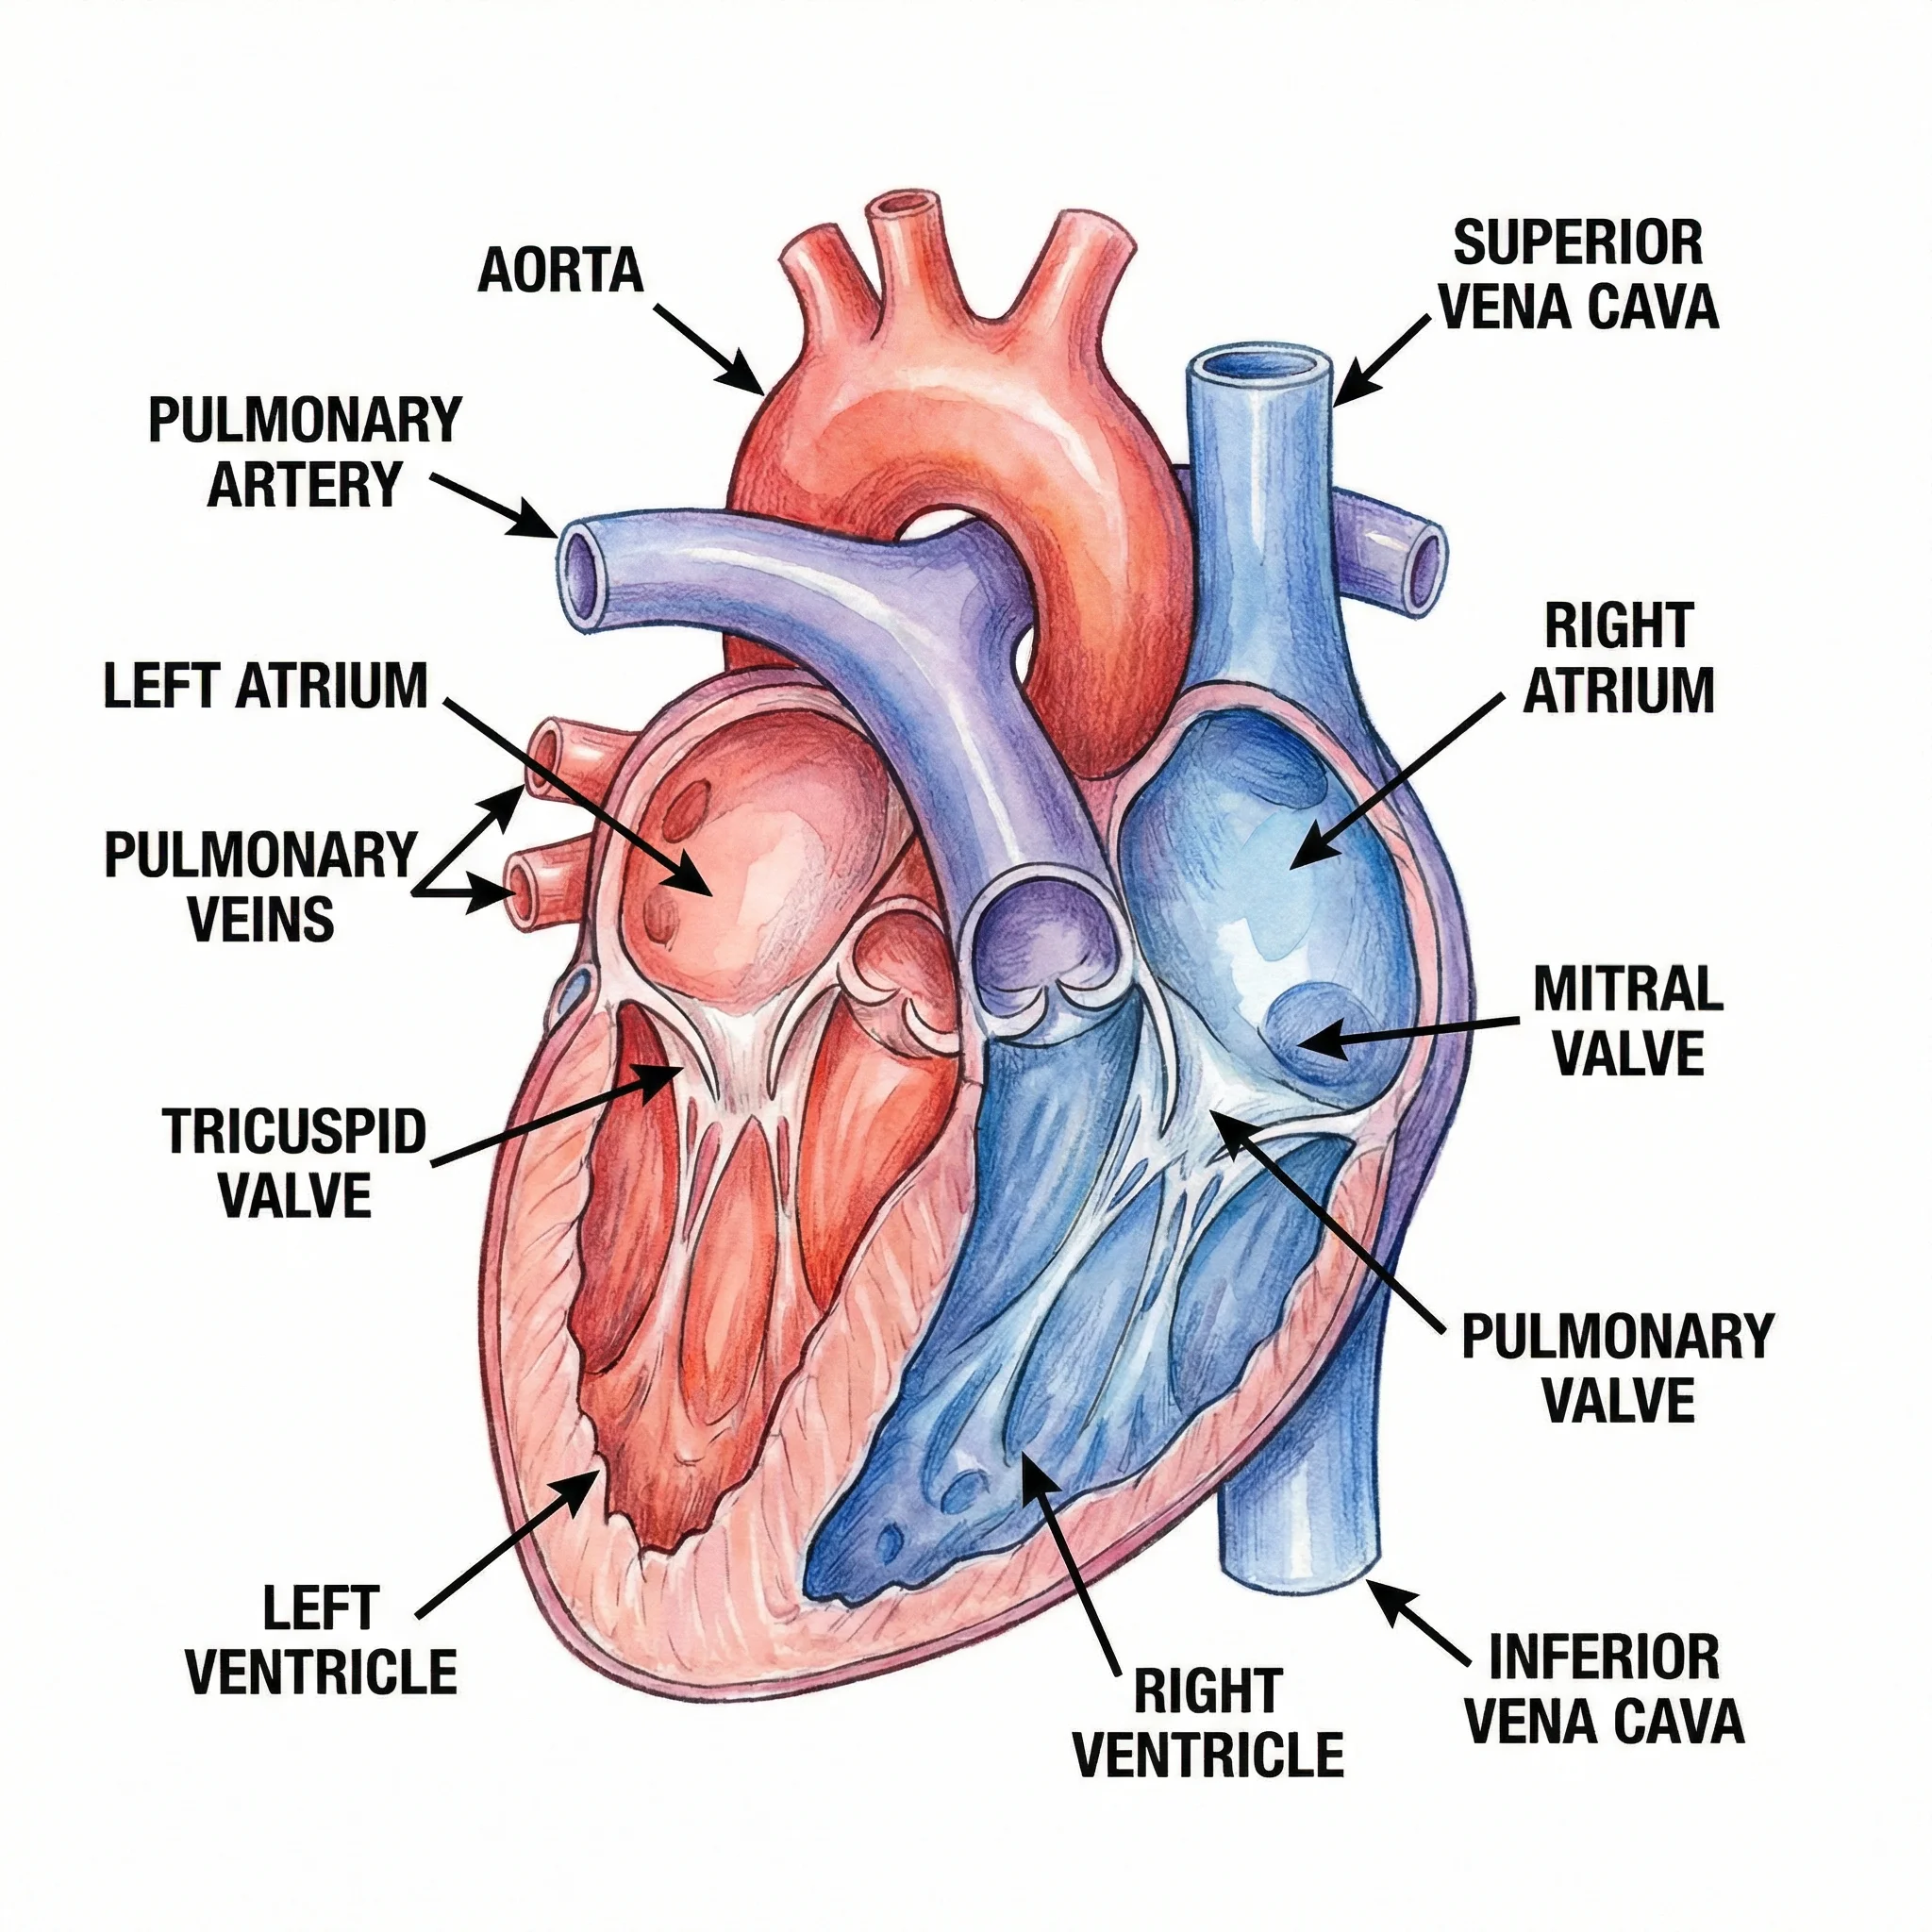
Broader clinical figures when the dissociation curve is only one panel in a slide.
 Biology
Protein Structure Diagram Generator
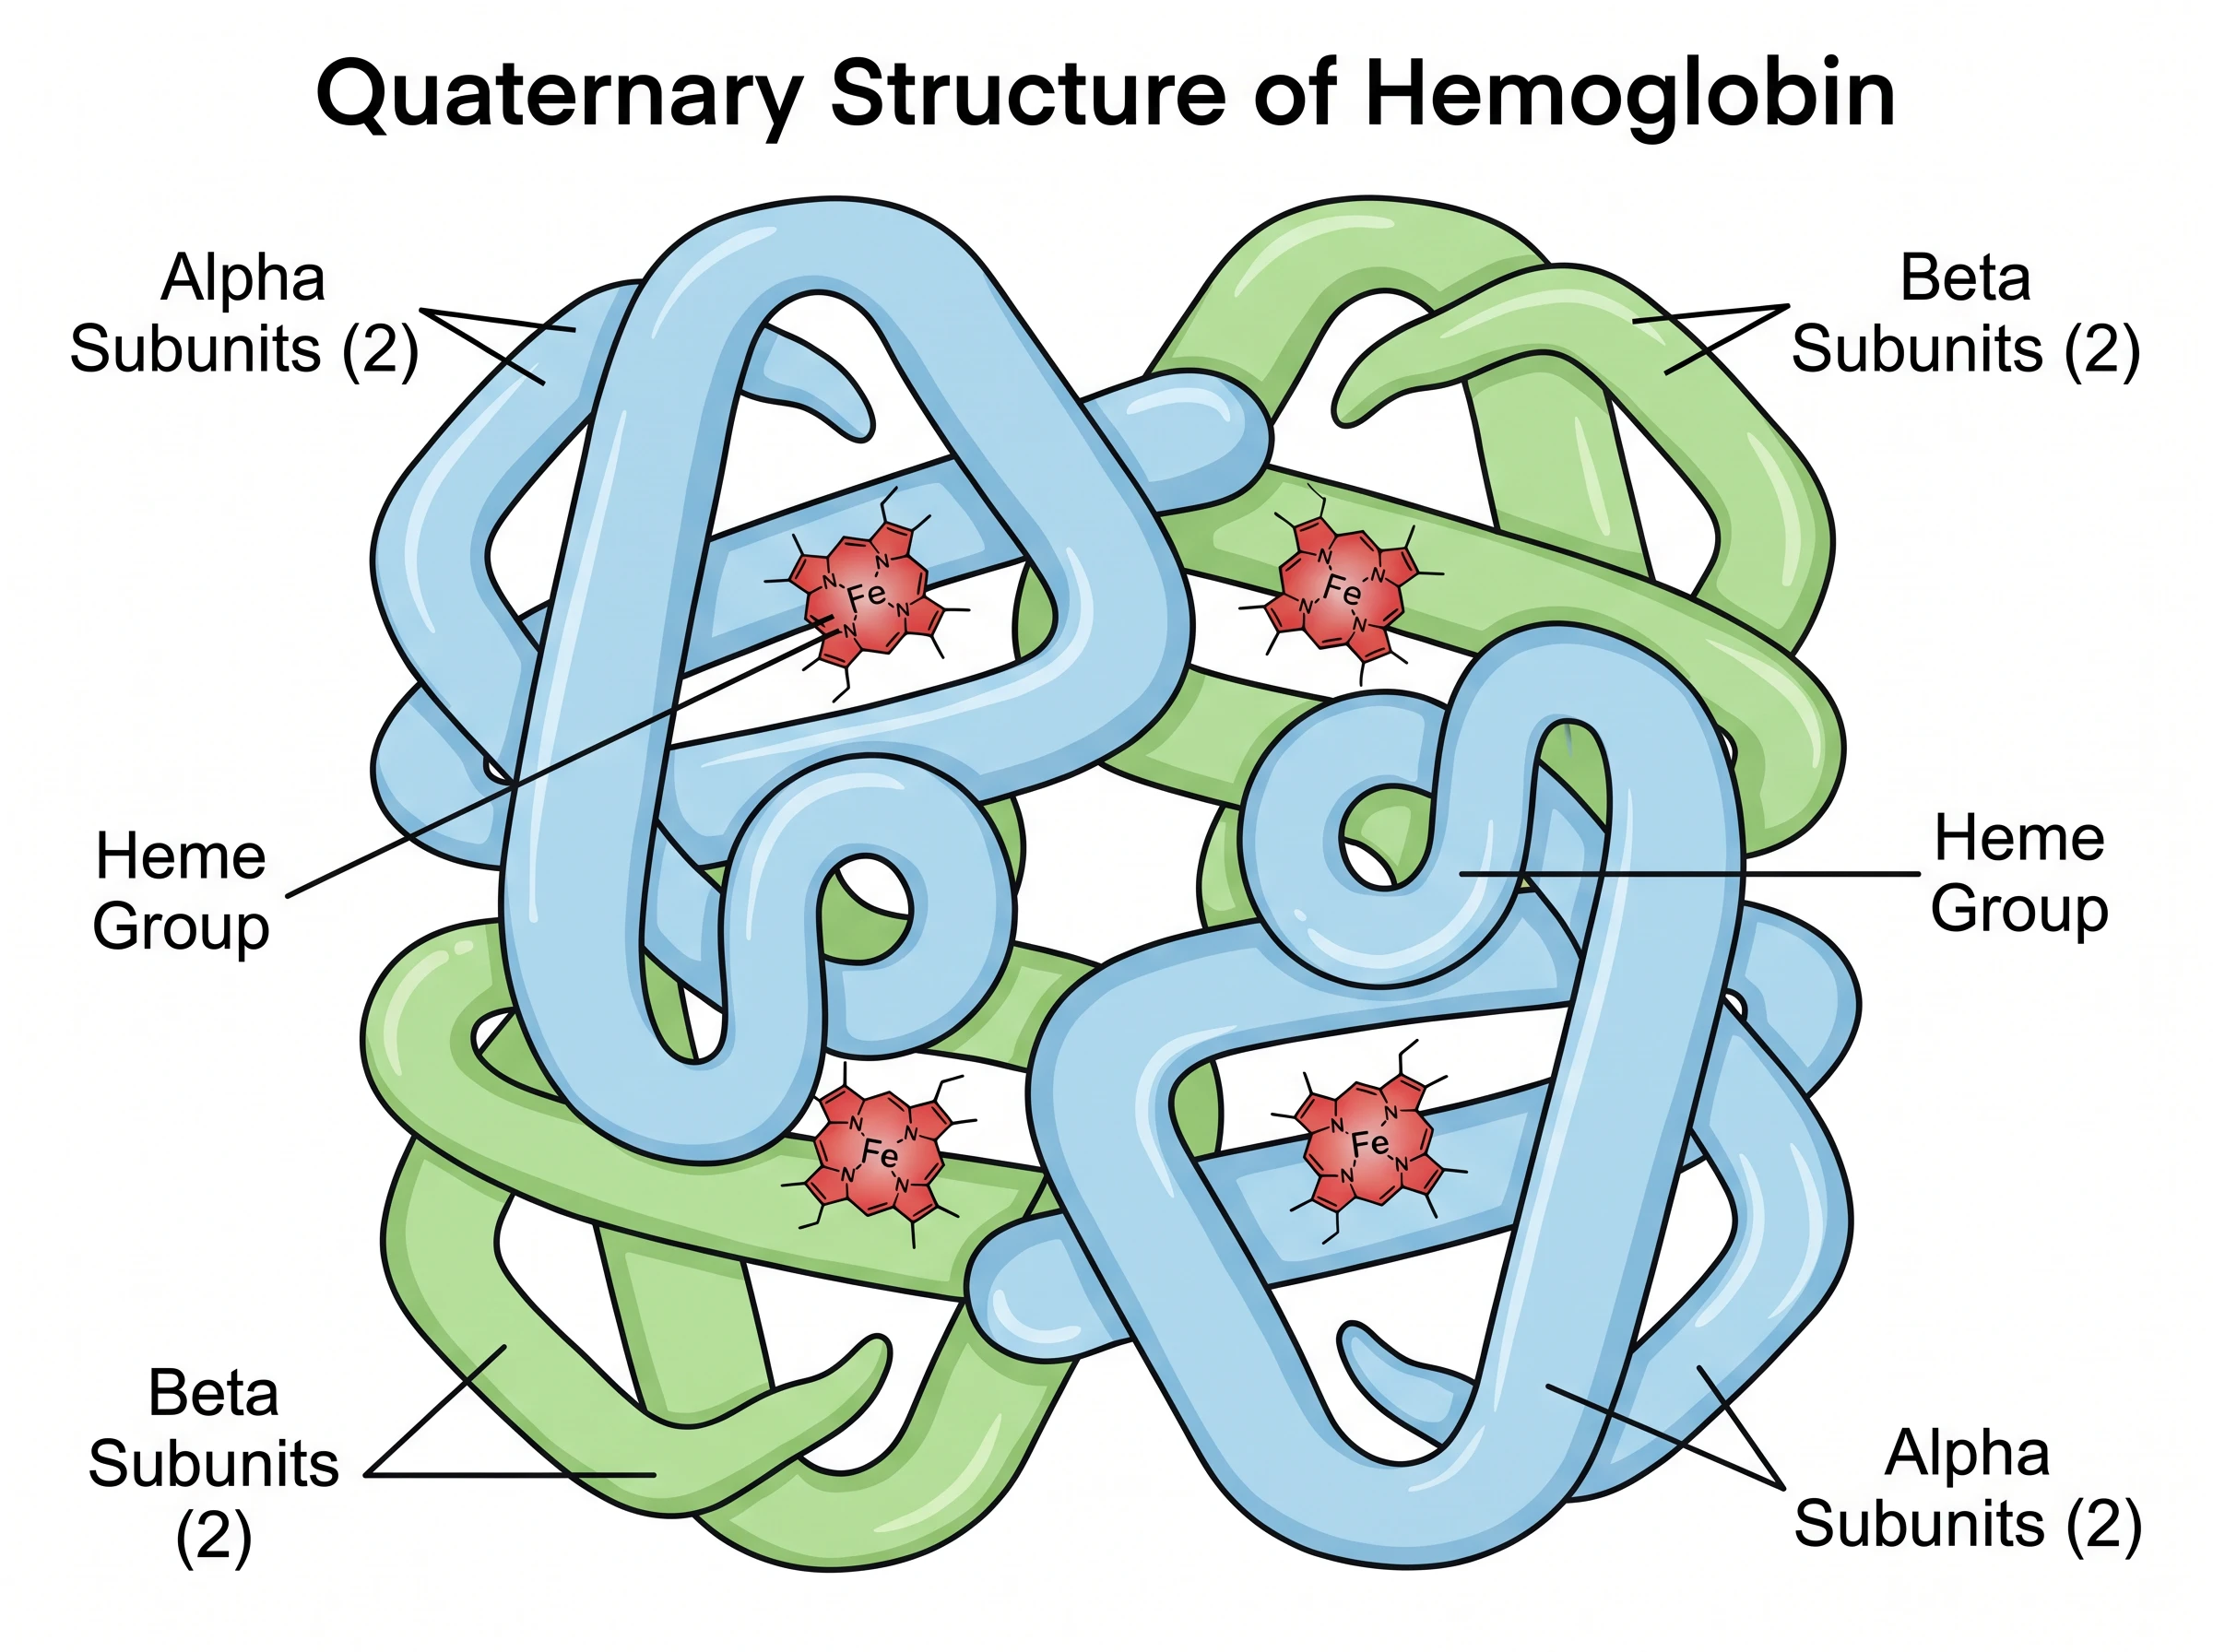
Hemoglobin as a quaternary-structure cartoon — subunits and heme, not SO2 versus PO2.