Action Potential Graph Generator voltage versus time
Free action potential graph generator. Plot membrane voltage versus time with threshold, peak, and afterhyperpolarization, and download labeled or blank SVG.
Membrane voltage versus time as SVG: neuronal spike, phases, or cardiac plateau — free, no account
Trace options
Times and voltages are teaching landmarks, not a pasted patch-clamp sweep. Cardiac and pacemaker modes change the time base.
Action Potential Graph Generator
Preview is free on this page ·
Your AI action-potential illustration will appear here
For locked rest / threshold / peak times, use the Precise Diagram tab instead
Action Potential Graph Examples
All six images are exact engine renders of the Precise Diagram tab.
Labeled neuronal spike
Exact engine render — teaching spike, not a clamp recording.
Blank worksheet
Exact engine render — same spike, labels removed for revision.
Phase bands
Exact engine render — the four teaching phases on the same neuronal spike.
Ion labels
Exact engine render — ion labels on the voltage-time spike, no axon cartoon.
Cardiac ventricular
Exact engine render — plateau trace, not a 3 ms neuronal needle.
Pacemaker
Exact engine render — pacemaker MDP, not a neuronal −70 mV rest.
What an action potential graph is
An action potential graph is the voltage-versus-time plot of a membrane spike: rest, threshold, a rapid rise, a peak, repolarization, and often an afterhyperpolarization. This page draws that lecture figure as an exact SVG. It is not a neuron anatomy worksheet. Use the neuron diagram generator when you need dendrites, soma, and axon drawn as a picture.
What the traces lock
- Neuronal default: rest −70 mV, threshold −55 mV, peak +35 mV, AHP −80 mV. The spike is a few milliseconds wide.
- The upstroke crosses threshold after the stimulus mark and before the peak. AHP is more negative than rest.
- Cardiac ventricular mode uses a −90 mV rest and a plateau that lasts hundreds of milliseconds. That is not a thin neuronal needle on a stretched axis.
- Pacemaker mode has no stable −70 mV rest. Voltage creeps from a maximum diastolic potential near −60 mV to threshold.
Labeled, blank, phases, ions, cardiac, pacemaker
Start with the labeled neuronal spike so the room can see rest, threshold, peak, and AHP. Use the blank copy of the same axes for a self-test. Phase bands name resting, depolarization, repolarization, and afterhyperpolarization. Ion labels mark Na+ on the upstroke and K+ on the downstroke. Cardiac and pacemaker options match the Image-search chips for those traces. None of those modes draw a cartoon axon.
Precise SVG vs AI illustration
The Precise Diagram tab is the version for class and papers: voltages and durations are fixed in code. The AI Illustration tab is only for slide mockups. Check every threshold and plateau against the precise traces before you project the file. Do not ask the AI tab for a default neuron cartoon — that job belongs on the neuron diagram page.
Frequently Asked Questions
Related Physiology Tools
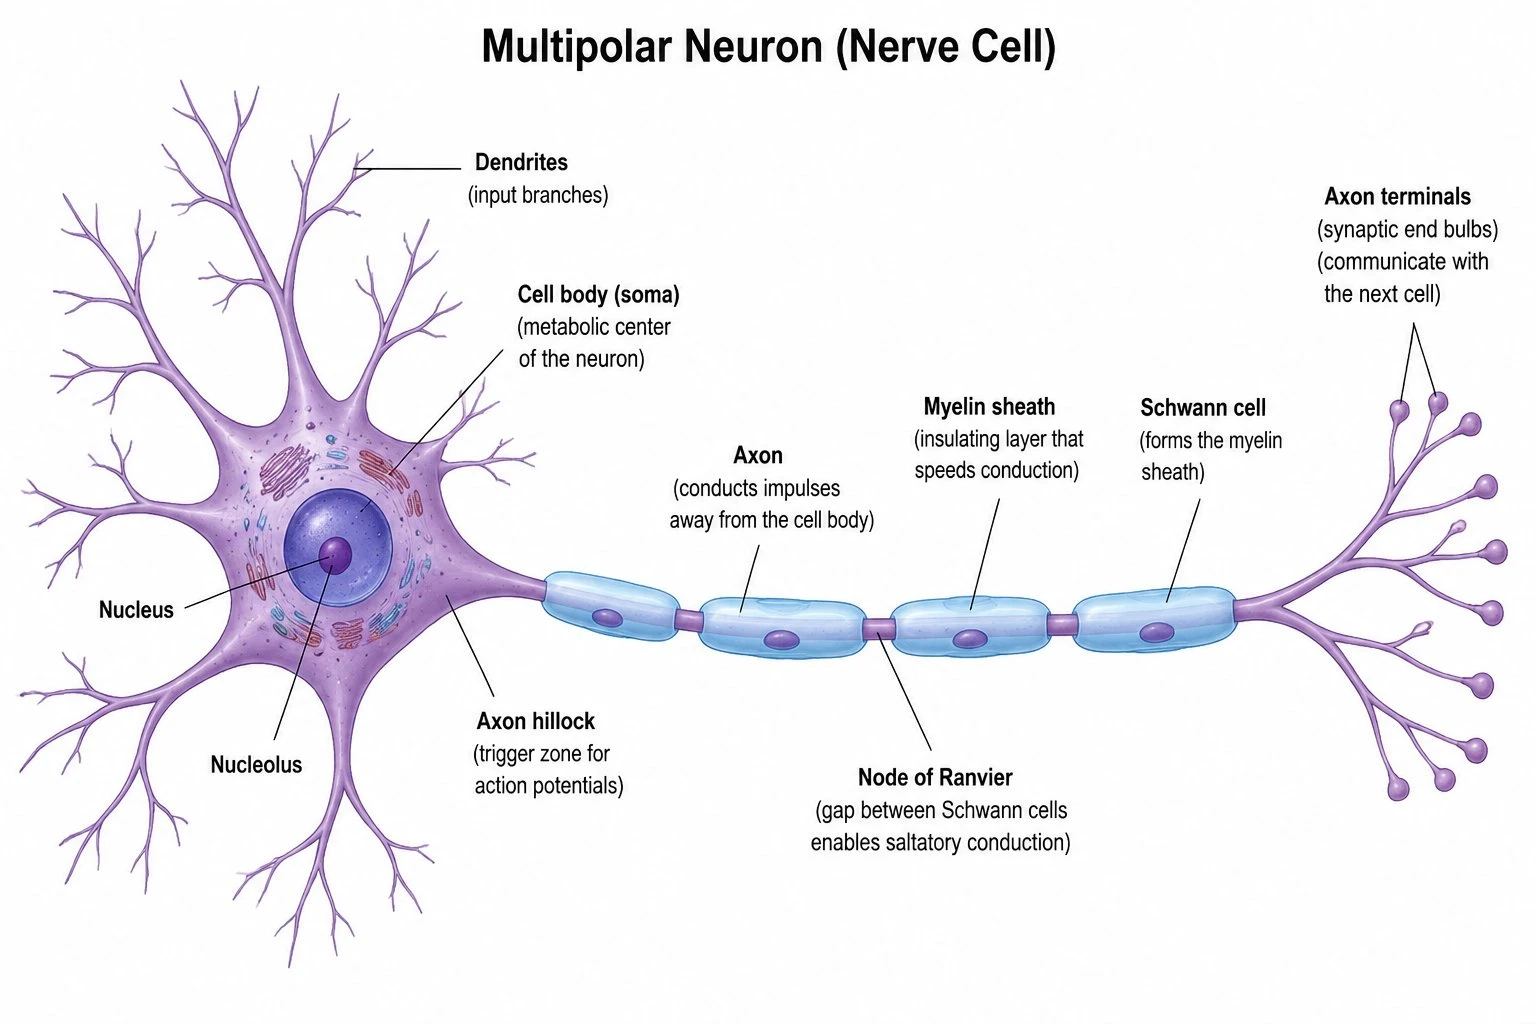 Biology
Neuron Diagram Generator
Soma, dendrites, and axon — the picture of the cell, not the voltage-time spike.
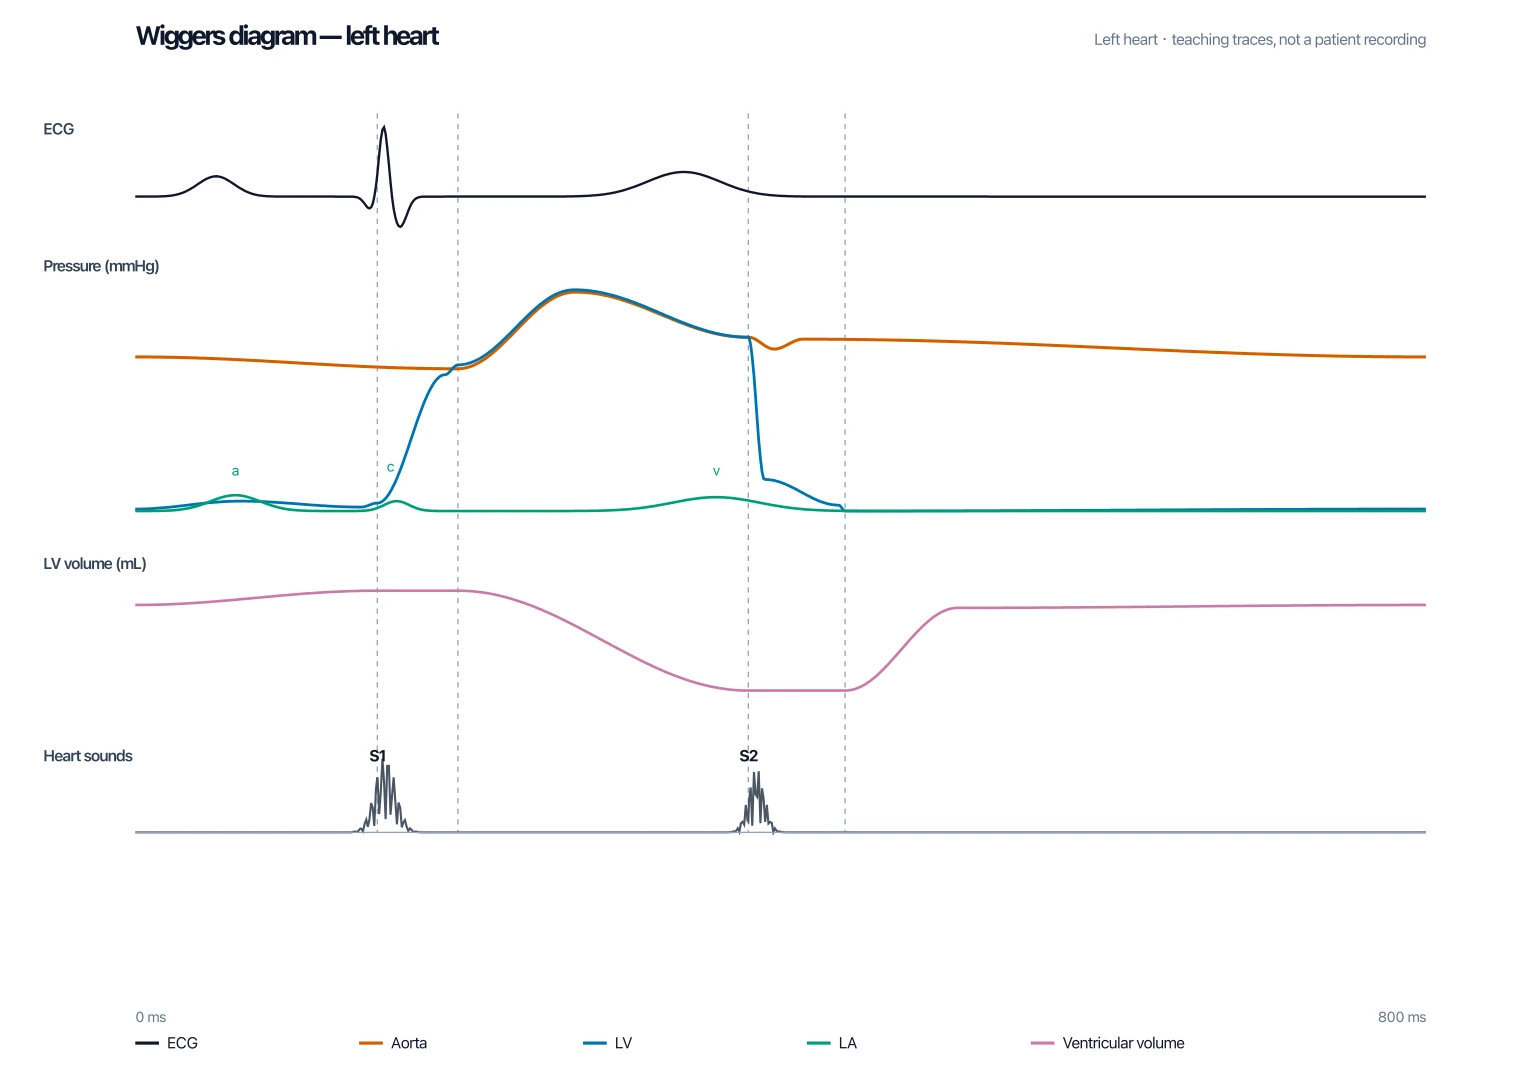 Medical
Wiggers Diagram Generator
Stacked cardiac-cycle plot — ECG and pressures, not a single action-potential sweep.
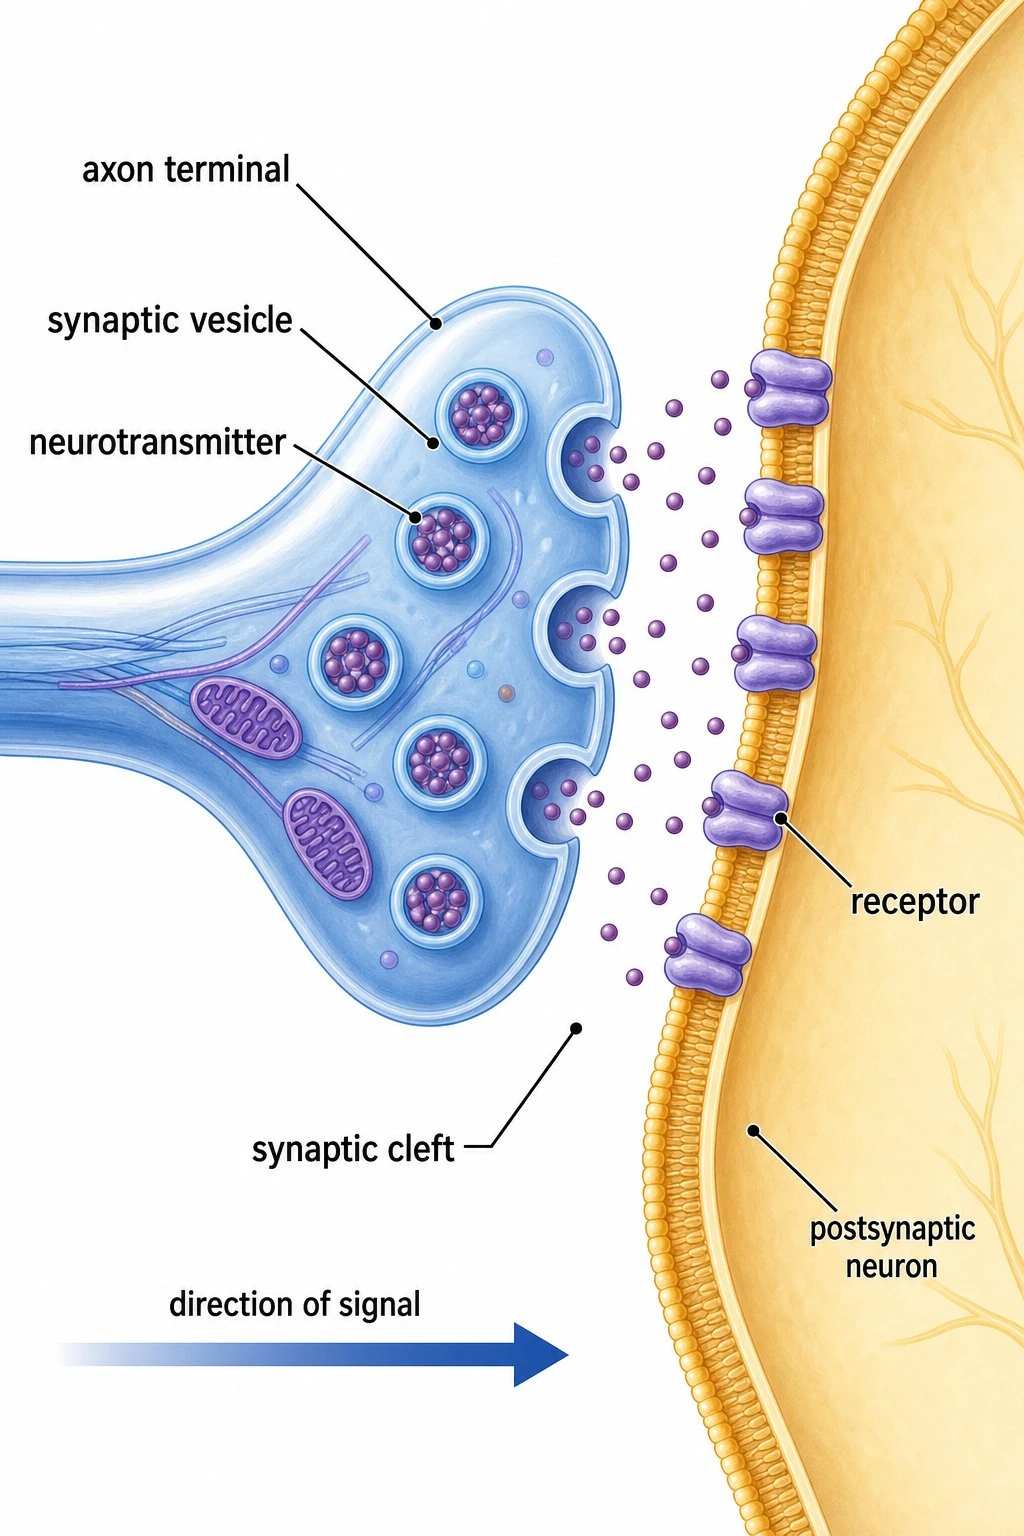 Biology
Synapse Diagram
Chemical-synapse anatomy when the spike is only the trigger for transmitter release.