P-Value Table
Turn a z, t, chi-square, F or r statistic into a p-value with a calculator and quick tables, then report it in APA 7 format. Free, no sign-up.
Test statistic
Tails
Two-tailed p-value
p = 0.0298
Below 0.05: significant at α = 0.05, so you would reject the null hypothesis.
Left tail
0.9851
Right tail
0.0149
Two-tailed
0.0298
APA 7 style write-up
t(24) = 2.31, p = .030
Exact p to three decimals, no zero before the decimal point. Statistic symbols are italic when you paste into your paper.
Chart style
Paper
Z statistic to p-value
One-tailed p = P(Z > |z|) and two-tailed p = 2 × P(Z > |z|), for |z| from 0.0 to 4.0 in steps of 0.1. Values below 0.0001 are shown as < 0.0001. For the cumulative area at negative and positive z, use the z table.
| |z| | One-tailed p | Two-tailed p |
|---|---|---|
| 0.0 | 0.5000 | 1.0000 |
| 0.1 | 0.4602 | 0.9203 |
| 0.2 | 0.4207 | 0.8415 |
| 0.3 | 0.3821 | 0.7642 |
| 0.4 | 0.3446 | 0.6892 |
| 0.5 | 0.3085 | 0.6171 |
| 0.6 | 0.2743 | 0.5485 |
| 0.7 | 0.2420 | 0.4839 |
| 0.8 | 0.2119 | 0.4237 |
| 0.9 | 0.1841 | 0.3681 |
| 1.0 | 0.1587 | 0.3173 |
| 1.1 | 0.1357 | 0.2713 |
| 1.2 | 0.1151 | 0.2301 |
| 1.3 | 0.0968 | 0.1936 |
| 1.4 | 0.0808 | 0.1615 |
| 1.5 | 0.0668 | 0.1336 |
| 1.6 | 0.0548 | 0.1096 |
| 1.7 | 0.0446 | 0.0891 |
| 1.8 | 0.0359 | 0.0719 |
| 1.9 | 0.0287 | 0.0574 |
| 2.0 | 0.0228 | 0.0455 |
| 2.1 | 0.0179 | 0.0357 |
| 2.2 | 0.0139 | 0.0278 |
| 2.3 | 0.0107 | 0.0214 |
| 2.4 | 0.0082 | 0.0164 |
| 2.5 | 0.0062 | 0.0124 |
| 2.6 | 0.0047 | 0.0093 |
| 2.7 | 0.0035 | 0.0069 |
| 2.8 | 0.0026 | 0.0051 |
| 2.9 | 0.0019 | 0.0037 |
| 3.0 | 0.0013 | 0.0027 |
| 3.1 | 0.0010 | 0.0019 |
| 3.2 | 0.0007 | 0.0014 |
| 3.3 | 0.0005 | 0.0010 |
| 3.4 | 0.0003 | 0.0007 |
| 3.5 | 0.0002 | 0.0005 |
| 3.6 | 0.0002 | 0.0003 |
| 3.7 | 0.0001 | 0.0002 |
| 3.8 | < 0.0001 | 0.0001 |
| 3.9 | < 0.0001 | < 0.0001 |
| 4.0 | < 0.0001 | < 0.0001 |
T statistic to two-tailed p-value
Two-tailed p = 2 × P(T > |t|) for common t values and degrees of freedom. Halve the value for a one-tailed test in the predicted direction. All other df and t values: use the calculator, or see the t table for critical values.
| |t| \ df | 5 | 10 | 15 | 20 | 30 | 60 | ∞ |
|---|---|---|---|---|---|---|---|
| 1.5 | 0.1939 | 0.1645 | 0.1544 | 0.1492 | 0.1441 | 0.1389 | 0.1336 |
| 2.0 | 0.1019 | 0.0734 | 0.0639 | 0.0593 | 0.0546 | 0.0500 | 0.0455 |
| 2.5 | 0.0545 | 0.0314 | 0.0245 | 0.0212 | 0.0181 | 0.0152 | 0.0124 |
| 3.0 | 0.0301 | 0.0133 | 0.0090 | 0.0071 | 0.0054 | 0.0039 | 0.0027 |
| 3.5 | 0.0173 | 0.0057 | 0.0032 | 0.0023 | 0.0015 | 0.0009 | 0.0005 |
Significance conventions
These ranges, stars and phrases are a common convention, not a standard. They vary by journal and field, so follow the style of the venue you are writing for.
| p range | Stars | Common wording |
|---|---|---|
| p ≥ .05 | ns (no stars) | Not significant at the .05 level |
| p < .05 | * | Significant at the .05 level |
| p < .01 | ** | Significant at the .01 level |
| p < .001 | *** | Significant at the .001 level |
Free P-Value Table Charts
Every chart below is drawn from the same code as the calculator above. View, download and print them free, no sign-up.
Z to P-Value Table
One-tailed and two-tailed p-values for |z| from 0.0 to 4.0, four decimals.
Reference tables
How to read
Reporting
Need critical values instead of p-values? Use the critical values table, or look up the full tables for the z distribution, t distribution, chi-square distribution and F distribution. APA rules quoted on this page come from the APA Style Numbers and Statistics Guide.
What a p-value is, and what it is not
A p-value is the probability of getting a test statistic at least as extreme as the one you observed, assuming the null hypothesis is true. A small p-value means your data would be unusual if the null hypothesis were true, so it counts as evidence against it. It is not the probability that the null hypothesis is true, it is not the probability that your result happened by chance, and it says nothing about how large or important an effect is. A tiny p-value can come from a trivial effect in a huge sample, and a large p-value can come from a real effect in a small one. Report an effect size next to every p-value.
How to read a p-value from a table
- Compute your test statistic first, then find its degrees of freedom. A printed table lists critical values for a few significance levels, so it can only bracket the p-value. For t = 2.31 with df = 24, the two-tailed critical values are 2.064 at 0.05 and 2.492 at 0.02. Your t sits between them, so the p-value lies between 0.02 and 0.05.
- The calculator above removes the bracket and gives the exact value, 0.0298 for that example. Use the quick tables on this page when you only need a rough answer: |z| = 1.96 gives a two-tailed p of 0.0500 and |z| = 2.58 gives 0.0099. For the critical values themselves, see the full z table, t table, chi-square table and F distribution table linked below.
One-tailed versus two-tailed p-values
A two-tailed p-value counts extreme results in both directions, so for a symmetric distribution such as z or t it is twice the smaller tail. For t = 2.31 with df = 24 the right tail is 0.0149 and the two-tailed value is 0.0298. Use a one-tailed p-value only when you named a single direction before collecting data, and say so in the report. In the usual chi-square and F tests (goodness of fit, independence, ANOVA), only a large statistic counts against the null hypothesis, so the right tail is the p-value and this page shows no two-tailed value. Two-sided tests of a variance are a separate case that this calculator does not cover. To compare a p-value with your significance level α, reject the null hypothesis when p is smaller than α, for example p = 0.0298 is below α = 0.05 but not below α = 0.01.
Very small p-values
Software often prints a tiny p-value as 0.000, which is not a probability of zero. Write it as p < .001 in a paper, as the APA guide says. A table that prints four decimals may show < 0.0001 instead, which is a display choice, not an APA rule. The calculator shows both the plain form and scientific notation. For example z = 5 has a two-tailed p-value of 5.733 × 10⁻7. Values this small are accurate here, but they depend on the model assumptions being true far into the tail, so treat them as "very small" and not as a literal chance.
How to report a p-value in APA 7
- The APA Style Numbers and Statistics Guide says to report exact p-values to two or three decimals, to write p < .001 when p is smaller than that, and to leave out the zero before the decimal point because p cannot exceed 1. It also asks for italic letters for statistical symbols, upright Greek letters, and a space on both sides of =, < and >.
- Independent-samples t test: t(24) = 2.31, p = .030
- One-way ANOVA: F(3, 20) = 4.12, p = .020
- Chi-square test: χ²(5, N = 120) = 13.20, p = .022. Chi-square results usually also give the sample size, and N = 120 here is an example value.
- Pearson correlation: r(10) = .65, p = .022. The test of r assumes the two variables are roughly bivariate normal.
- Putting the degrees of freedom in brackets after the symbol is the usual layout in published results, and the calculator uses it. Your journal or department may ask for something different, so check its guidelines.
Significance stars are a convention
Many tables mark p < .05 with one star, p < .01 with two and p < .001 with three. This is a convention that varies by journal and field, not a standard. Some fields add a dagger for p < .10, and many journals prefer exact p-values to stars. If you use stars, define them in a note under the table, and remember that a star only says which threshold p crossed, not how large the effect is.
Frequently Asked Questions
Related Statistics Tools
 Research
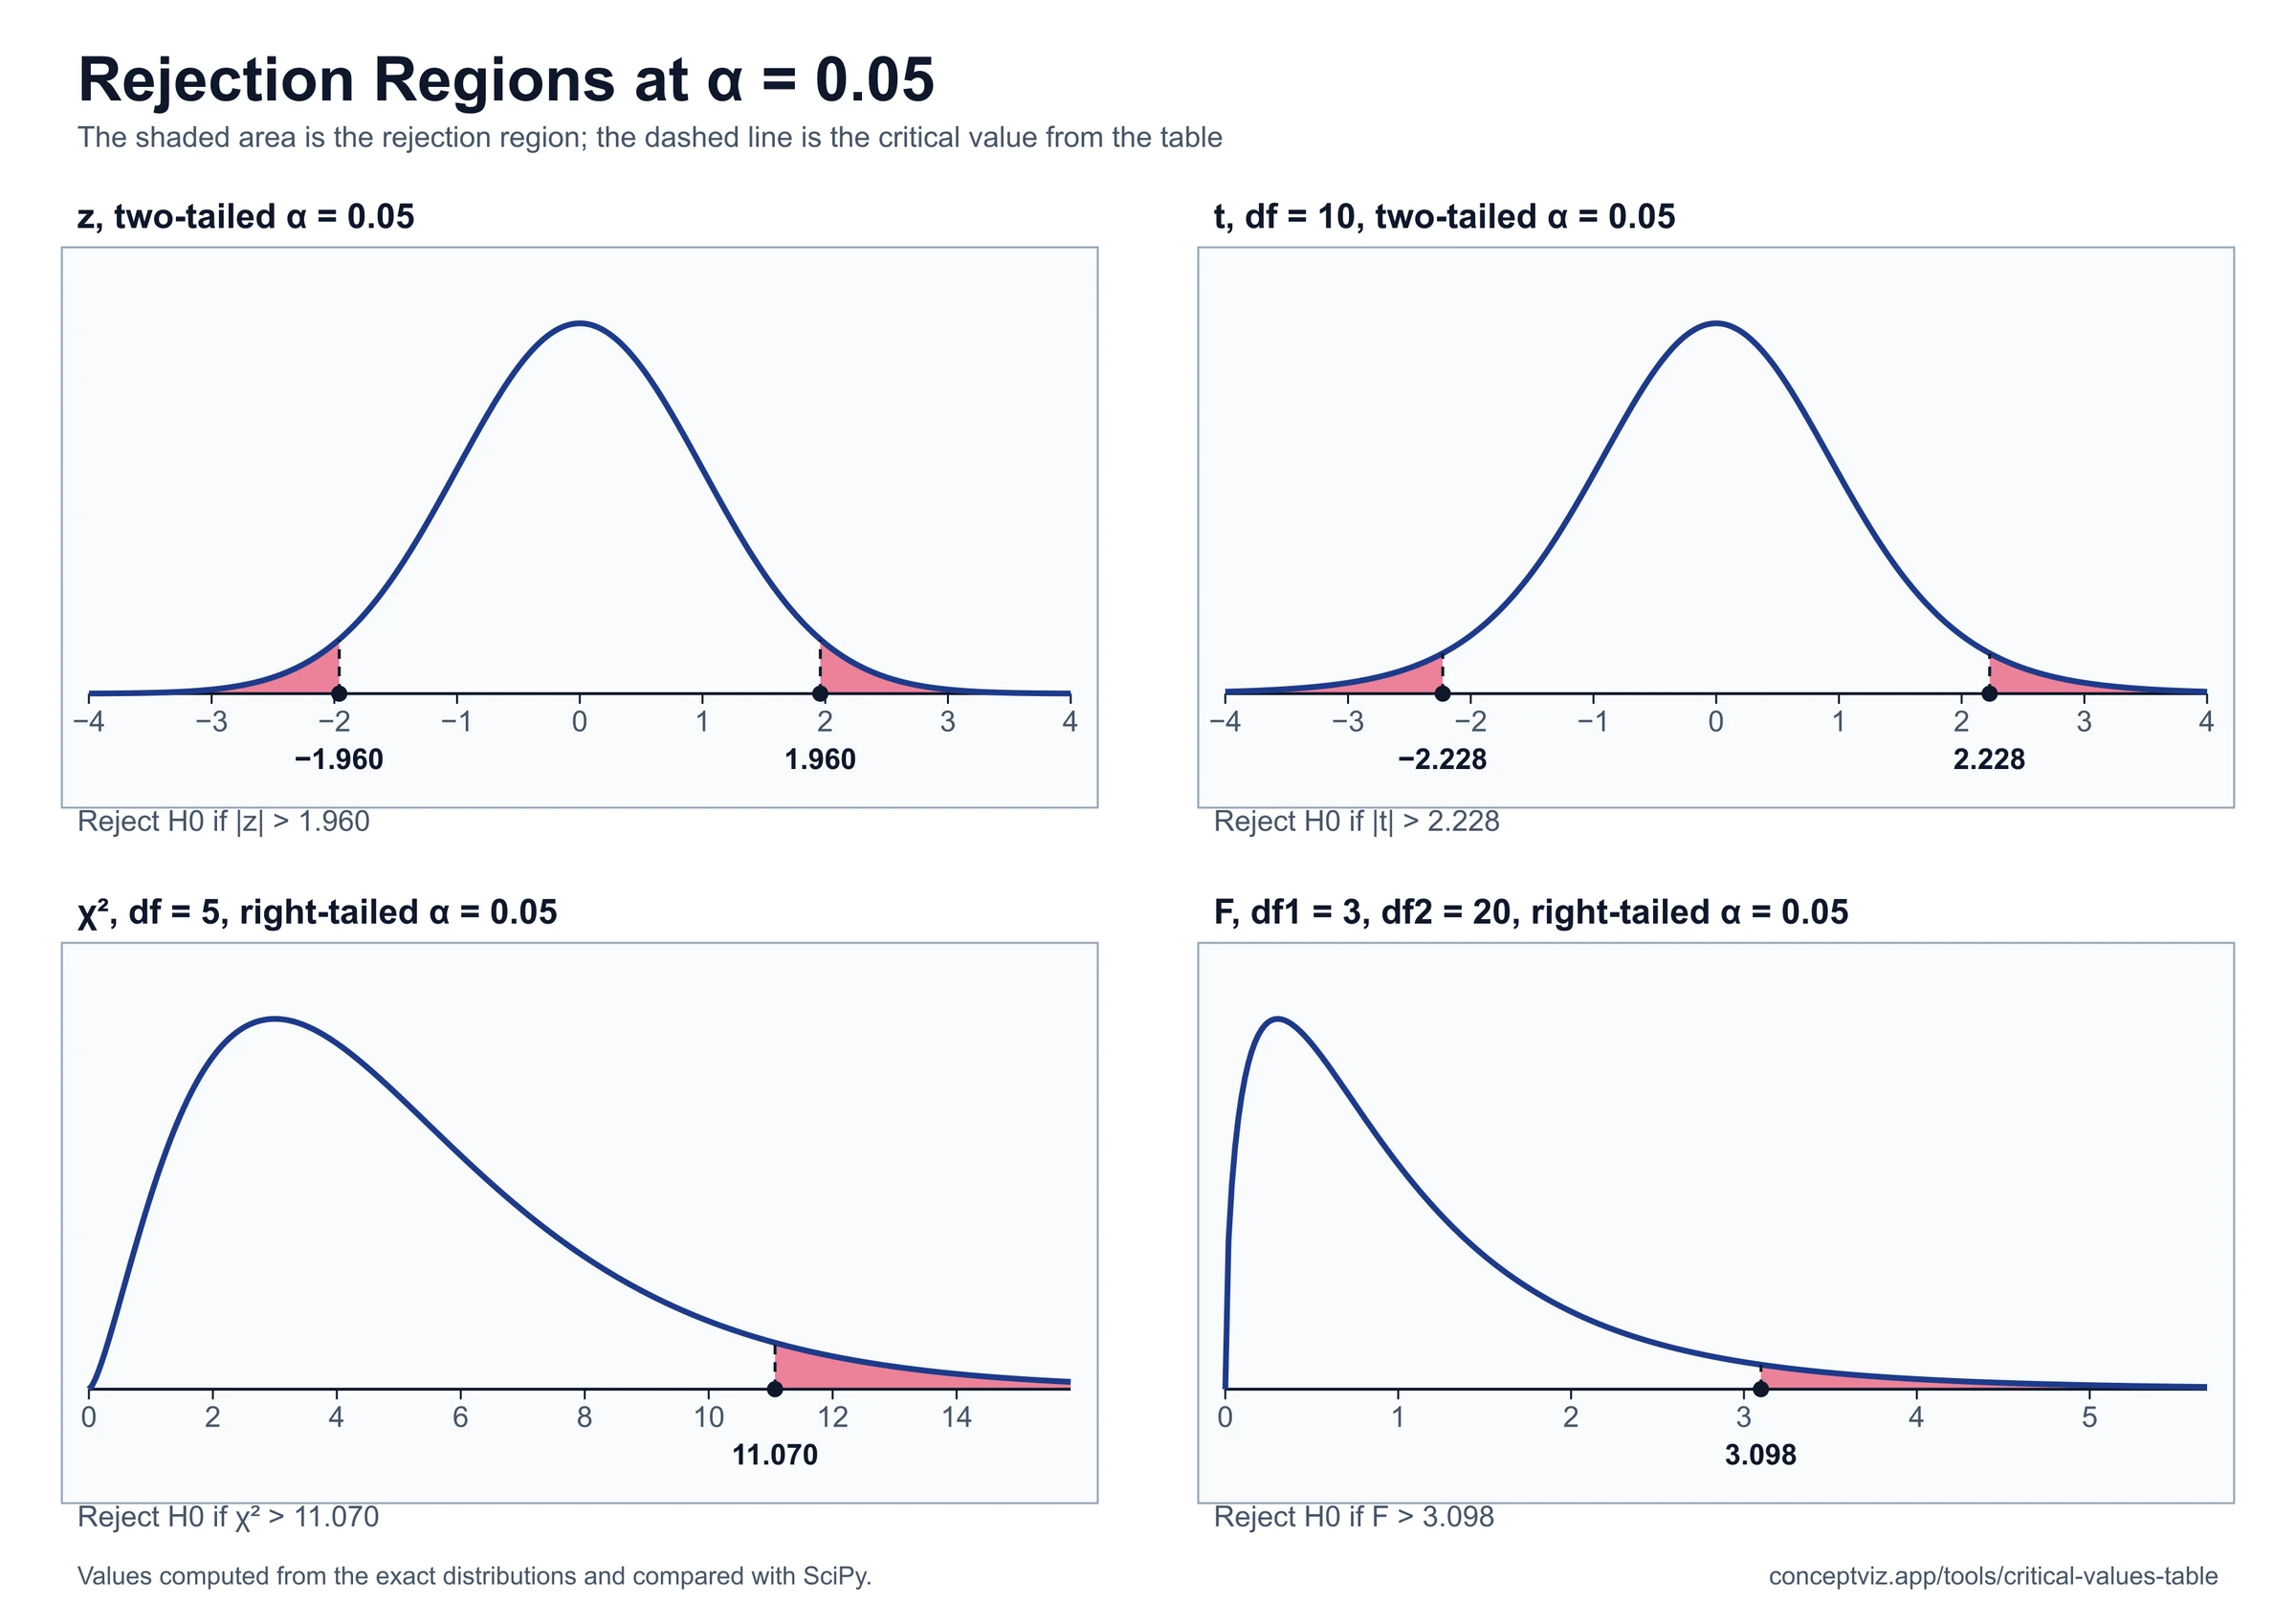
Critical Values Table
Critical values for z, t, chi-square, F and Pearson r from your significance level and degrees of freedom, with a calculator.
 Research
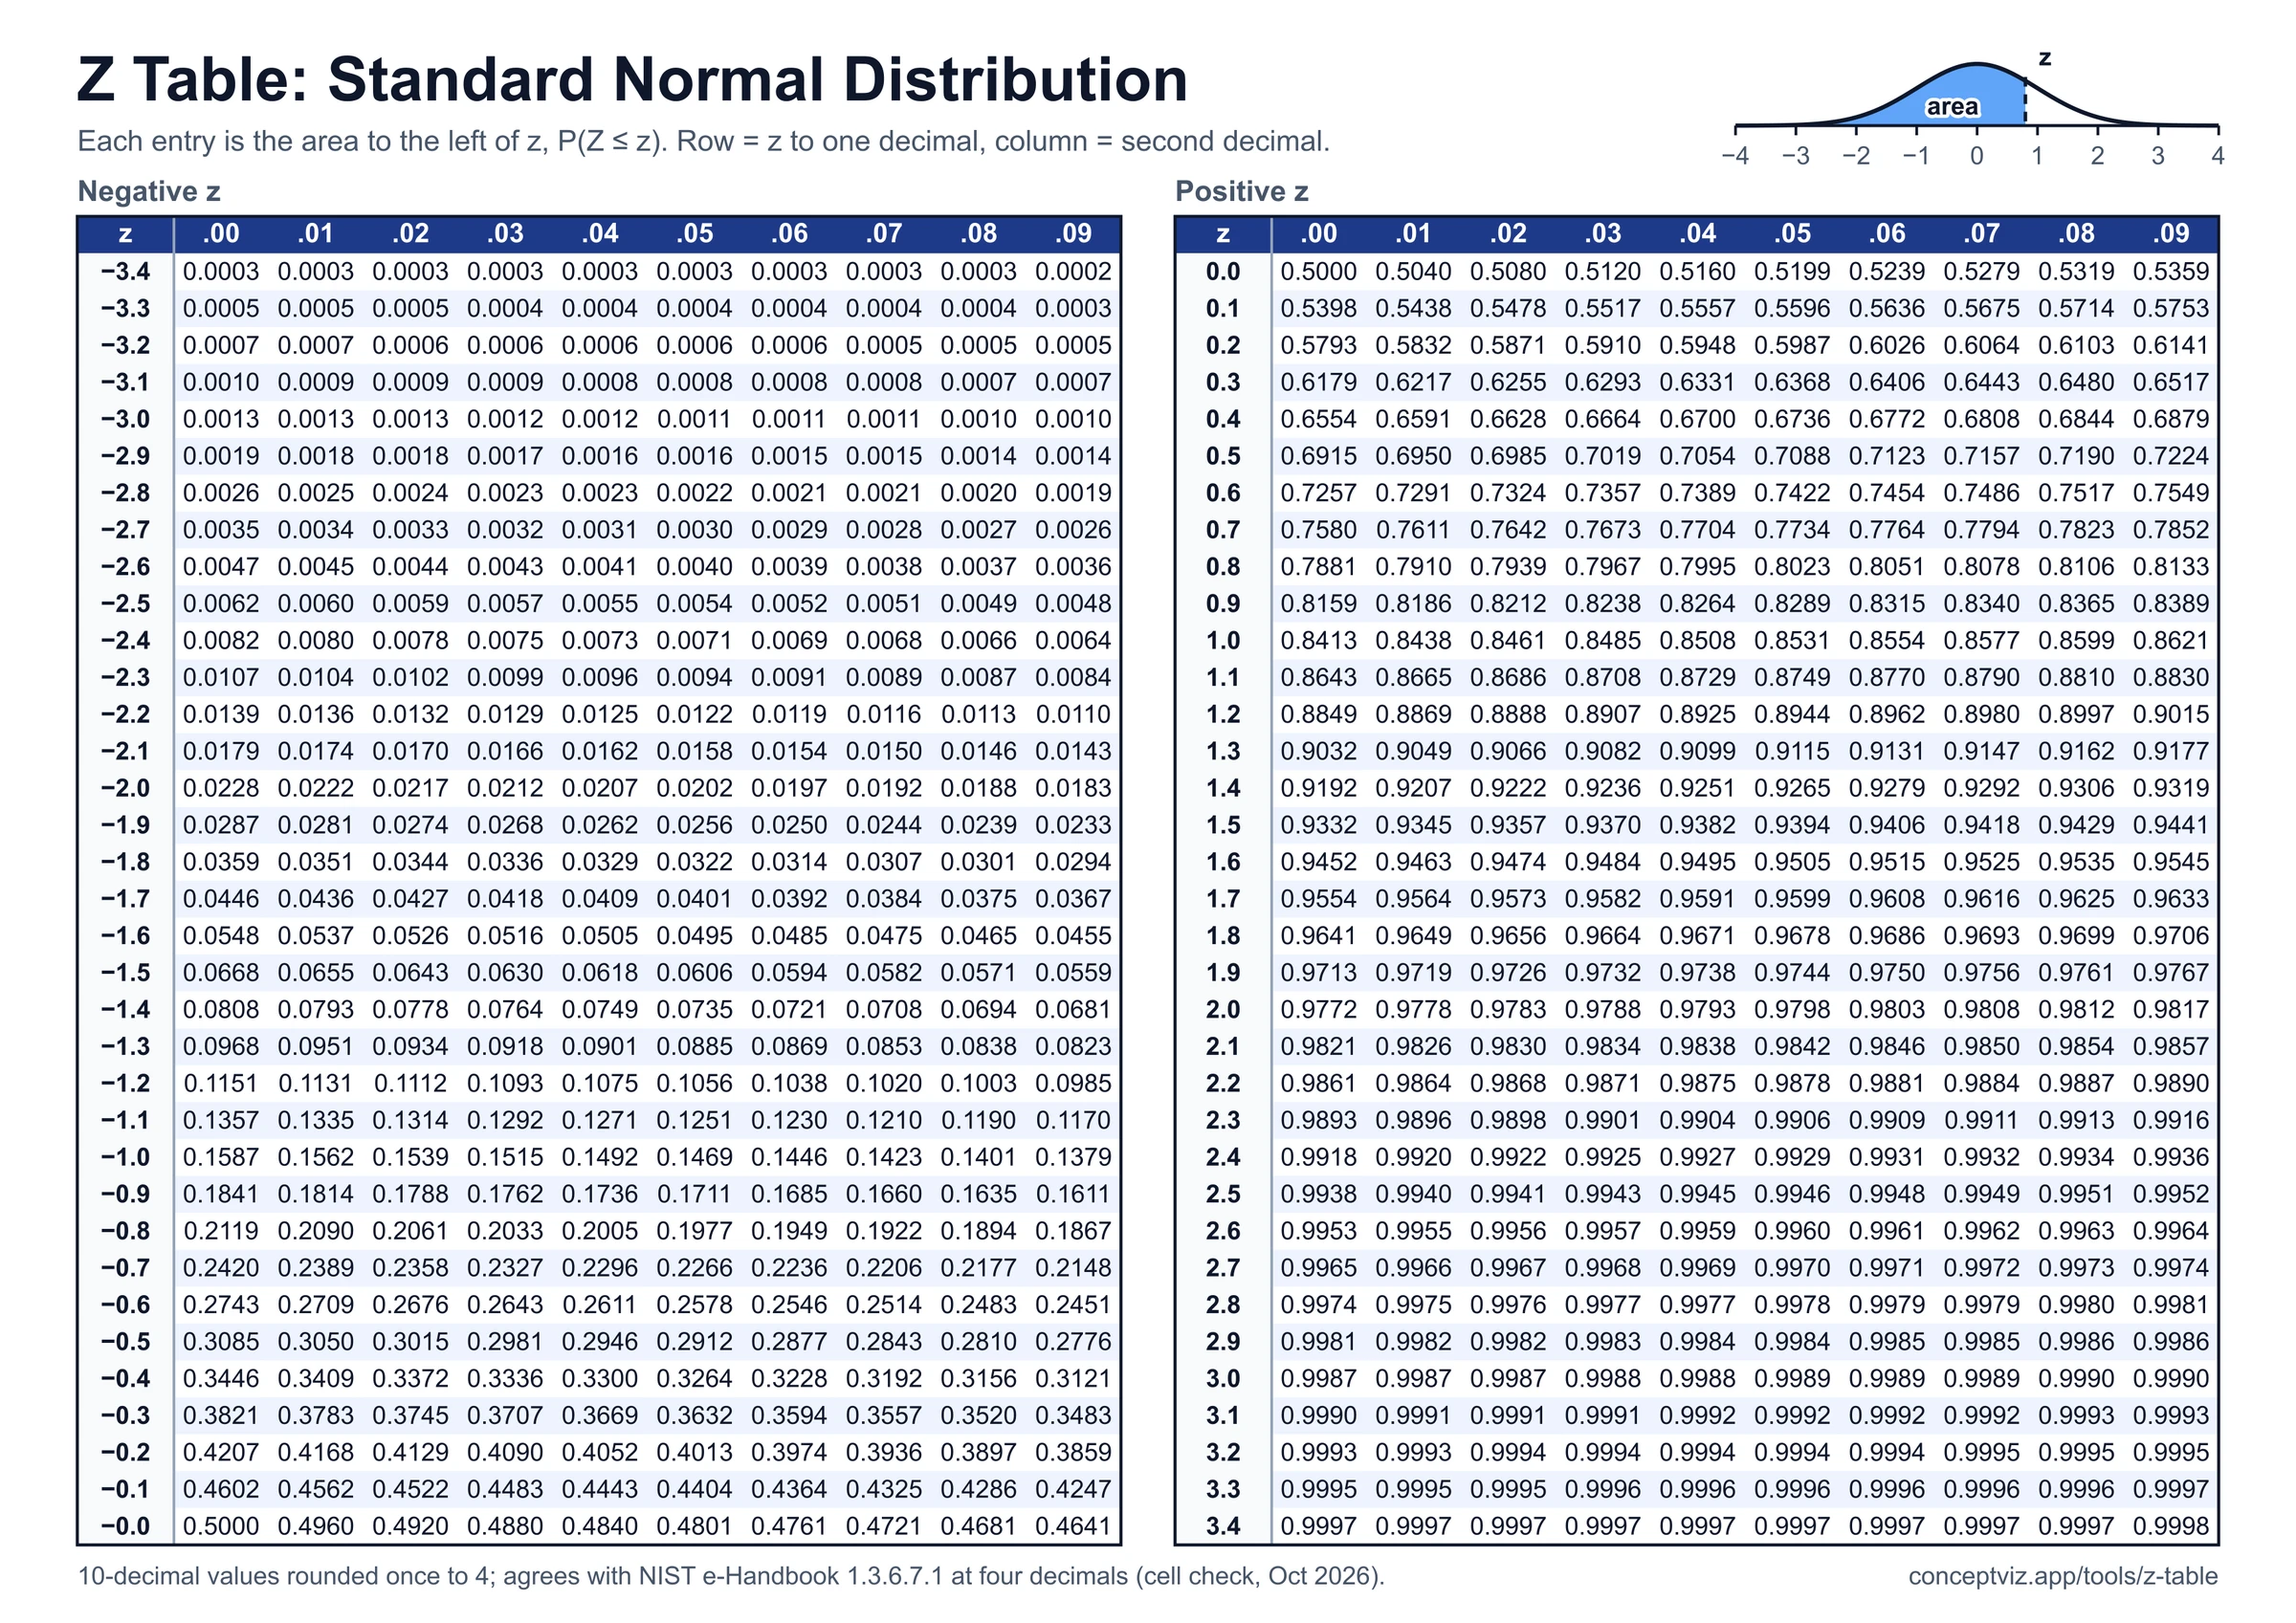
Z Table
Z table with positive and negative z-scores, left-tail cumulative area, z to p and p to z calculator, shaded curve and printable A4 and Letter sheets.
 Research
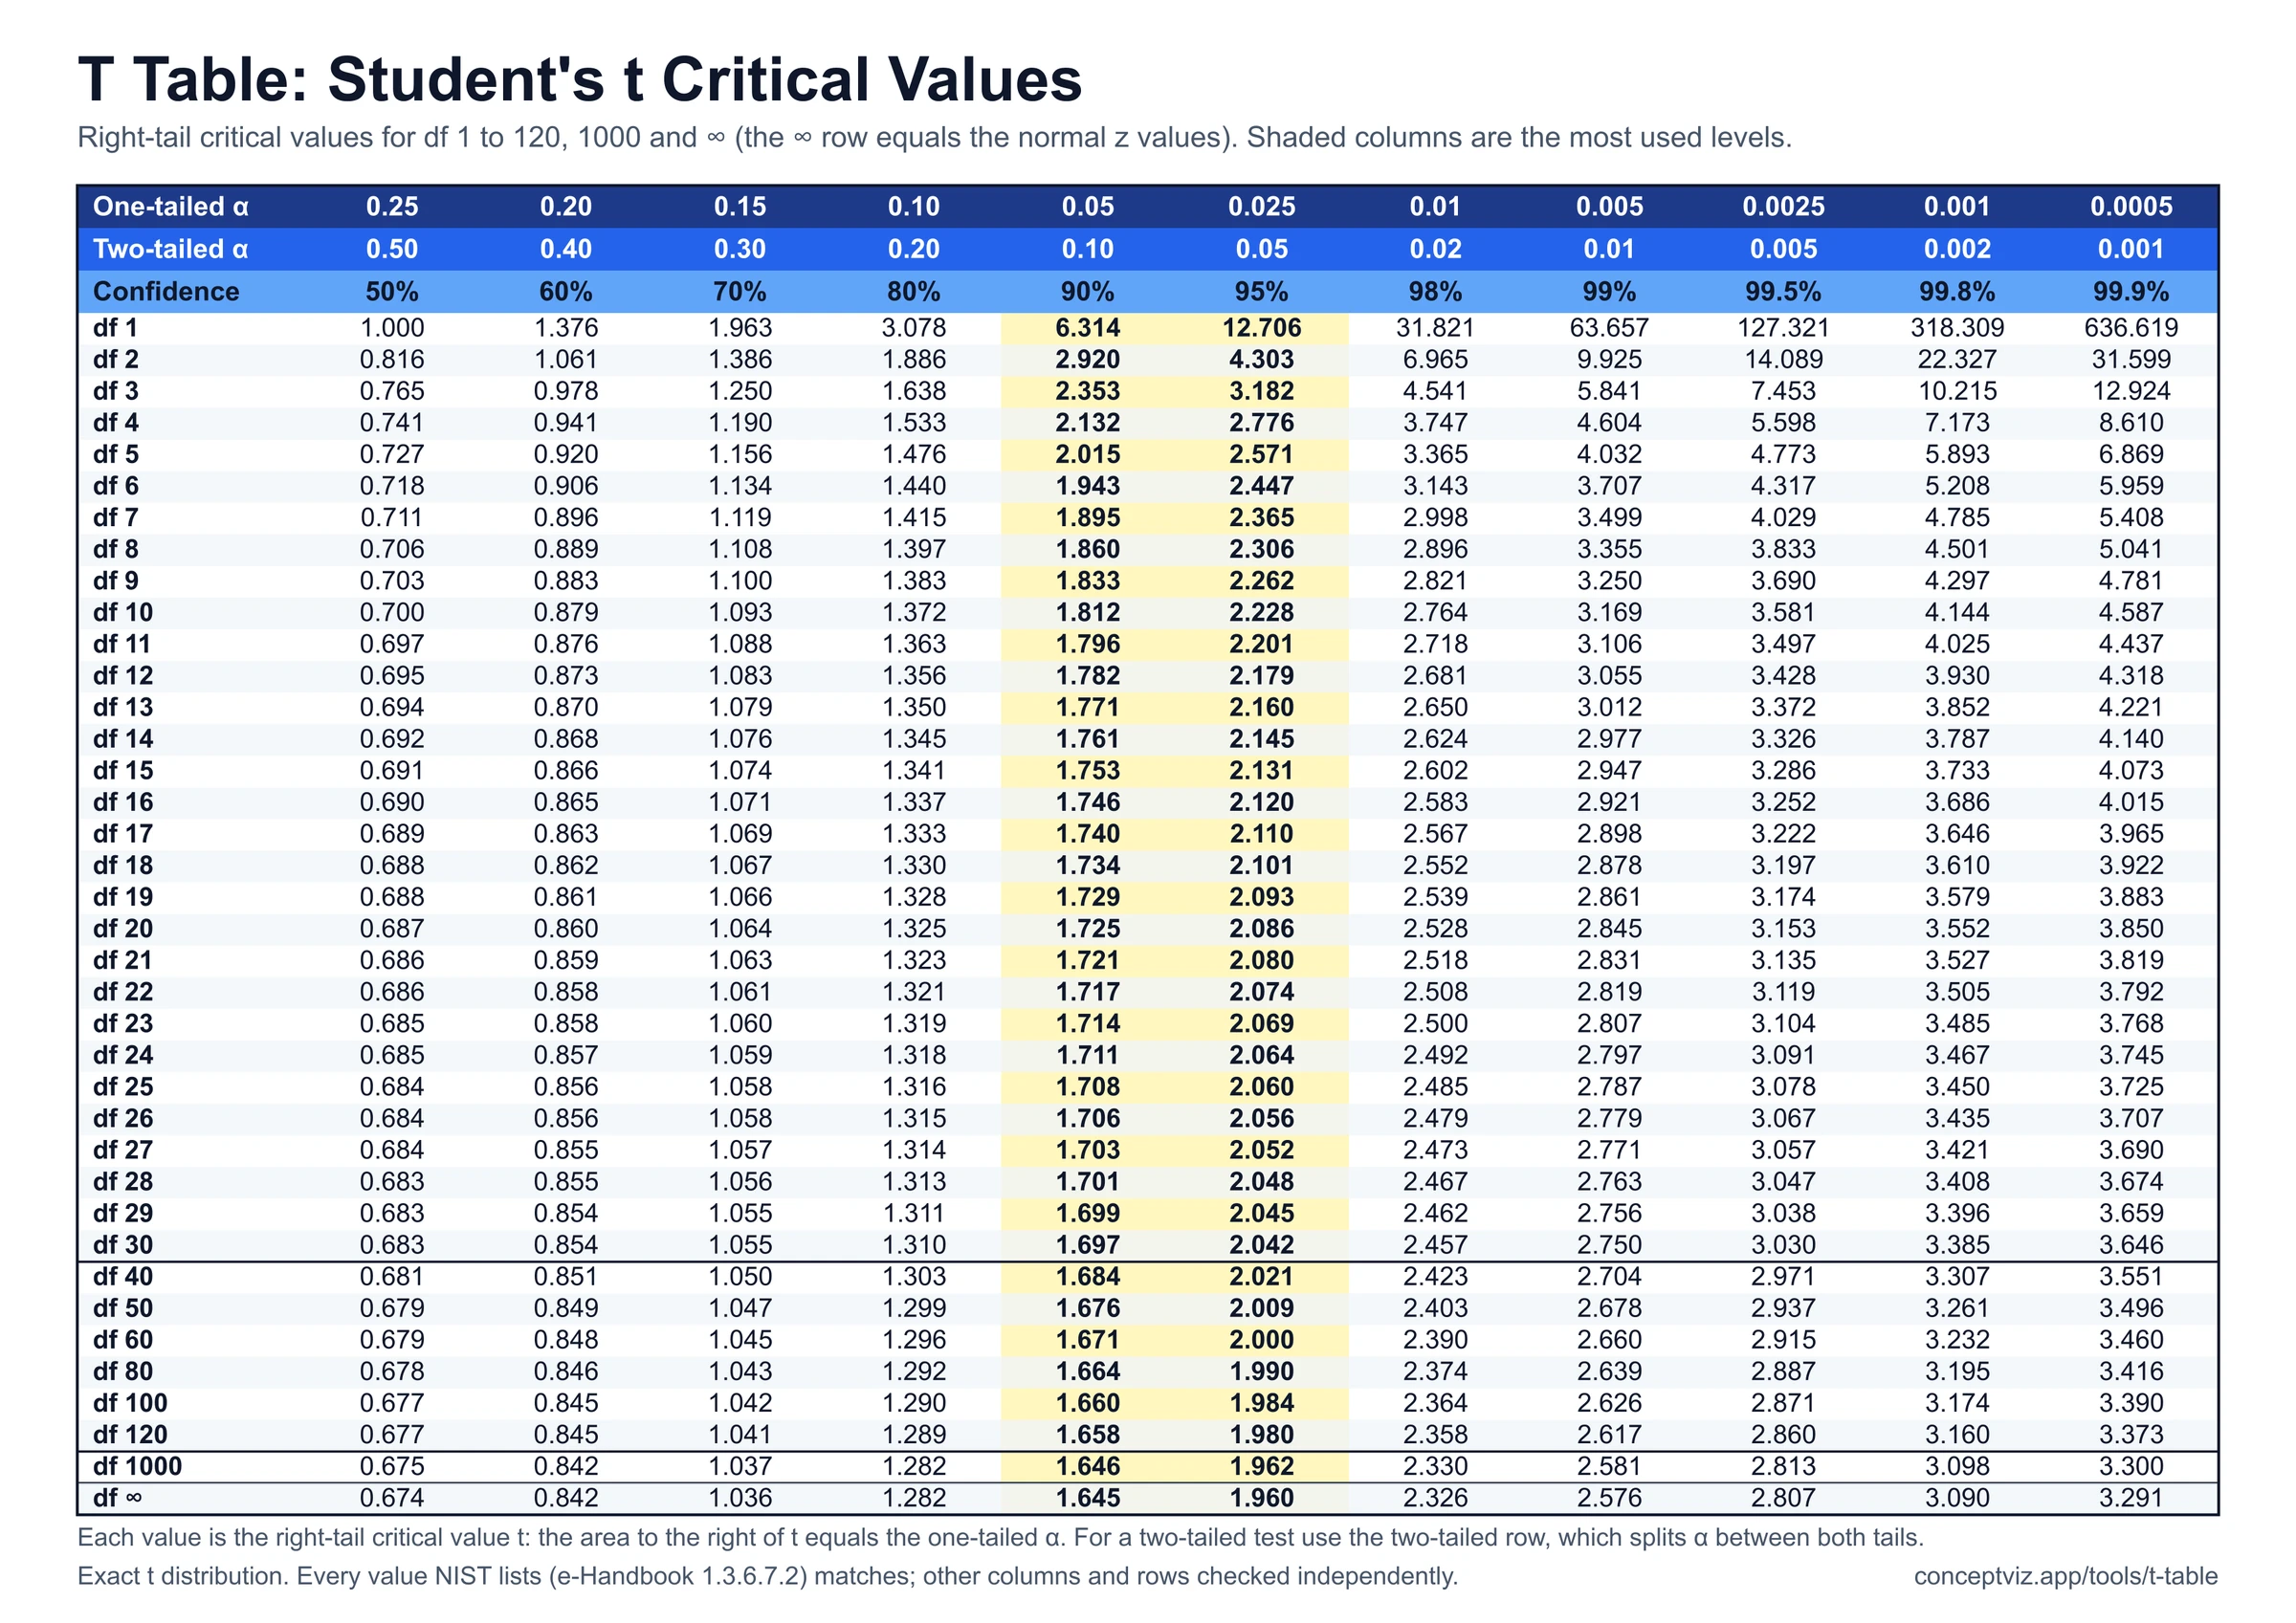
T Table
T table with one-tailed and two-tailed critical values for df 1 to 120 and infinity, a critical value and p-value calculator, and printable sheets.
 Research
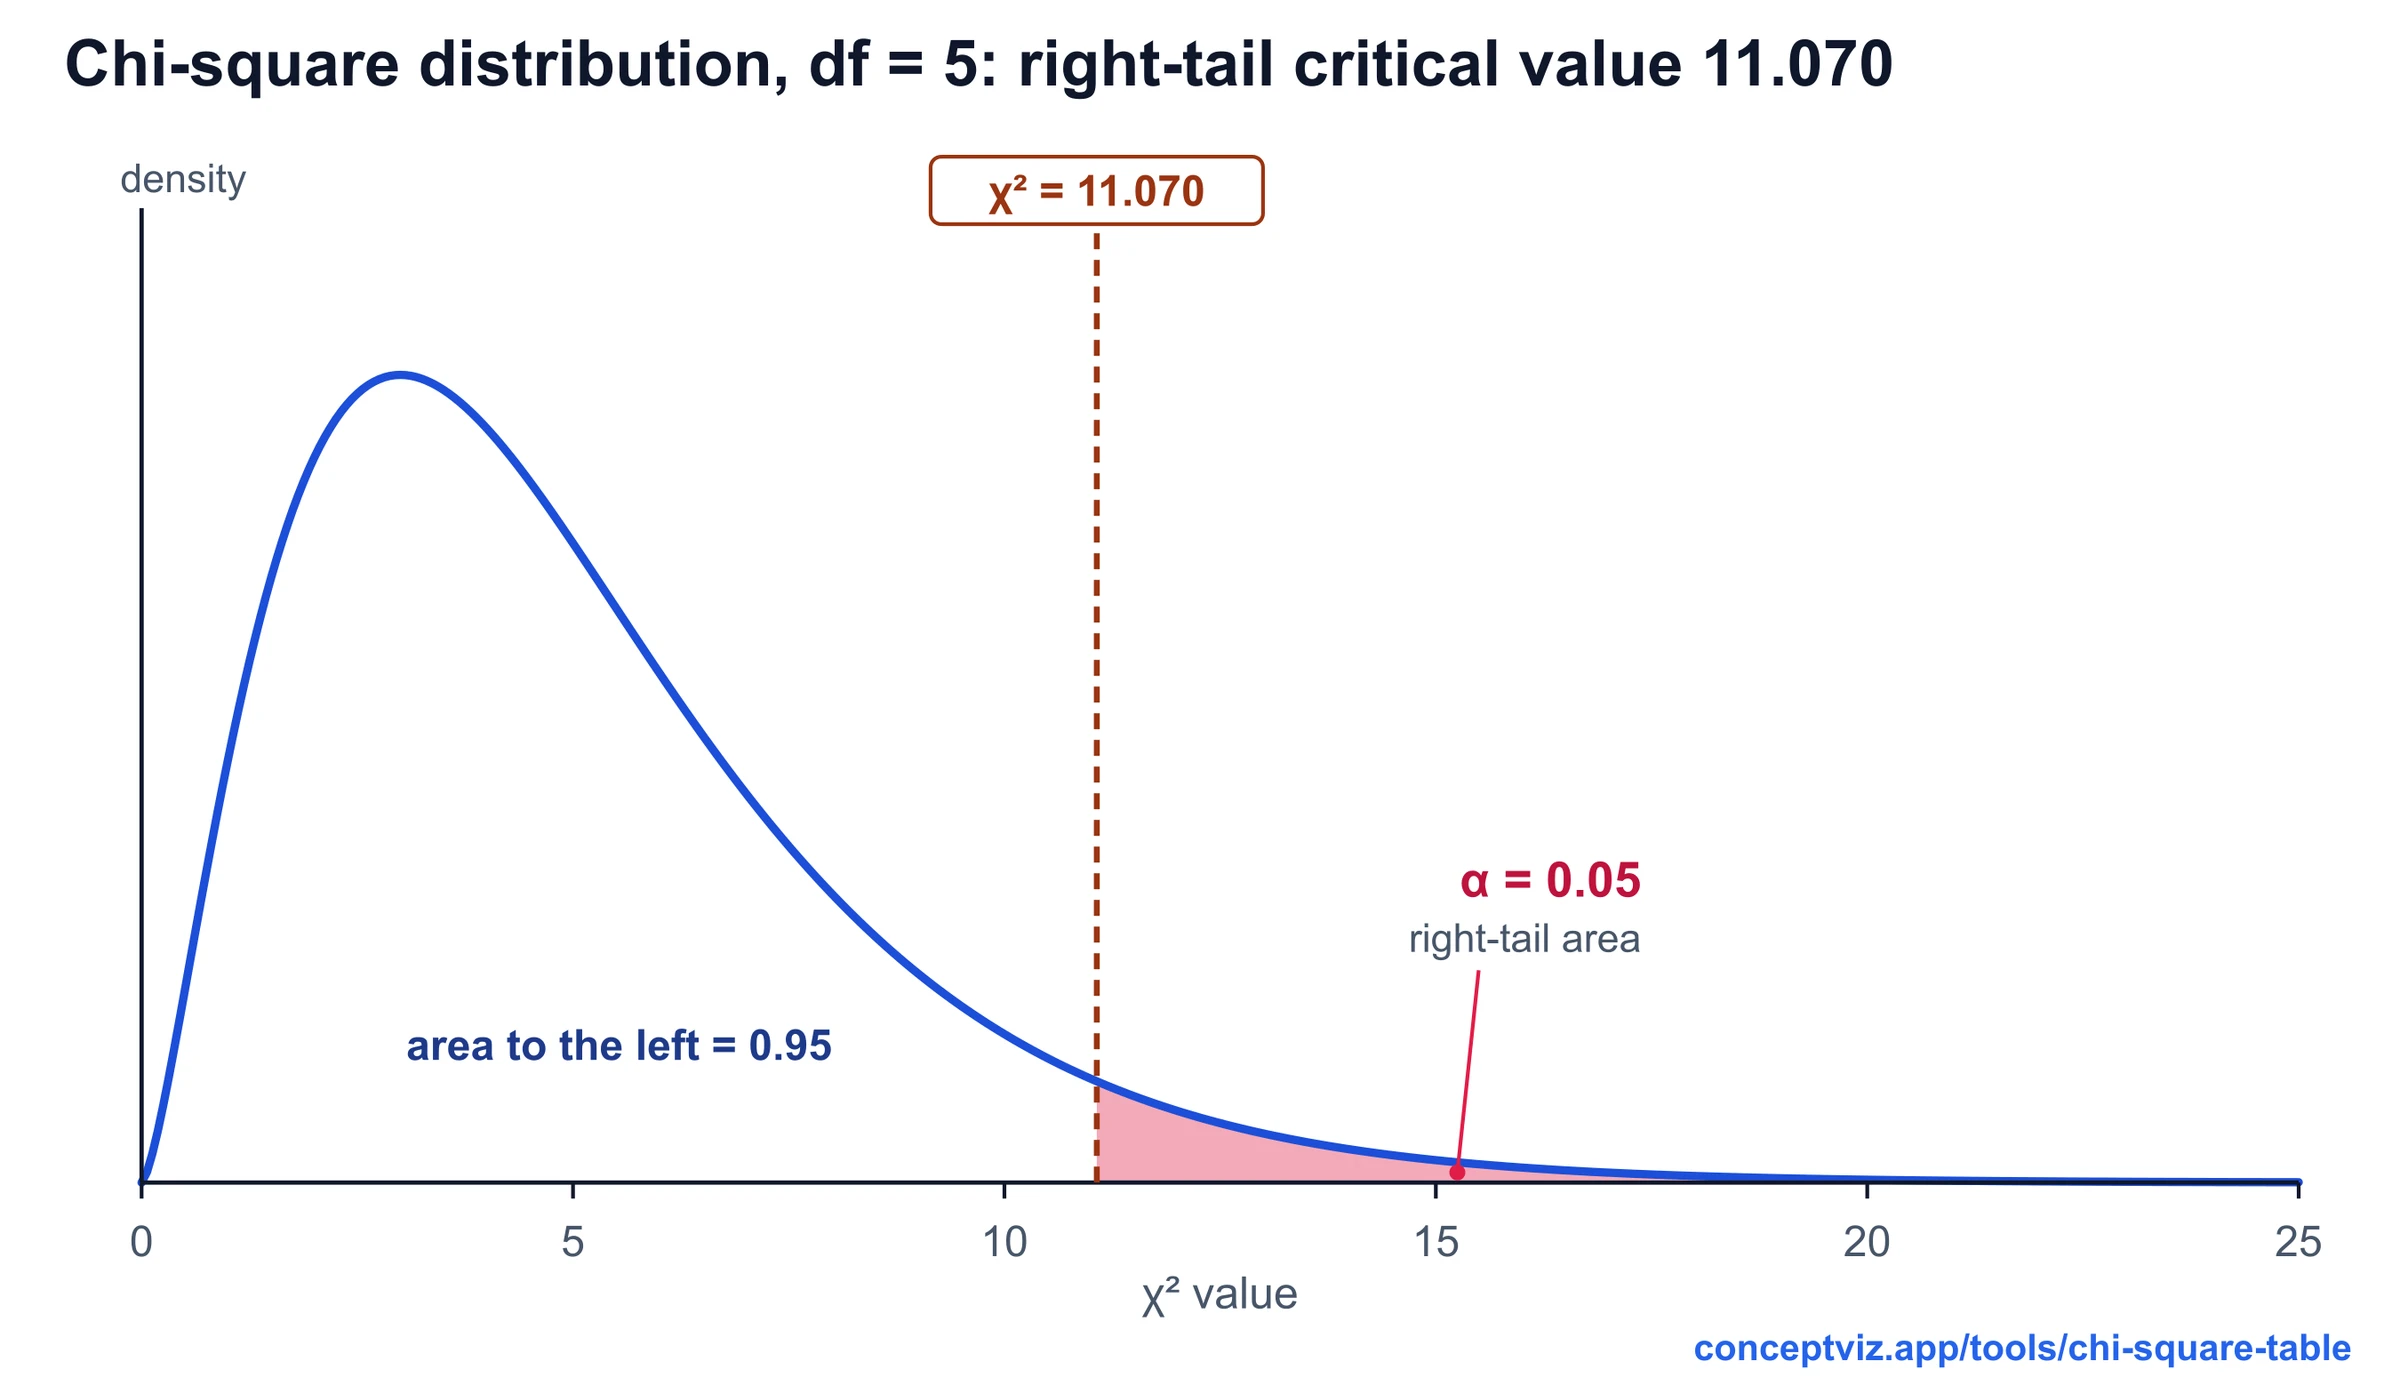
Chi-Square Table
Chi-square table with right-tail critical values for df 1 to 100, a p-value calculator with shaded area and lower-tail columns. Print or download.
 Research
F Distribution Table
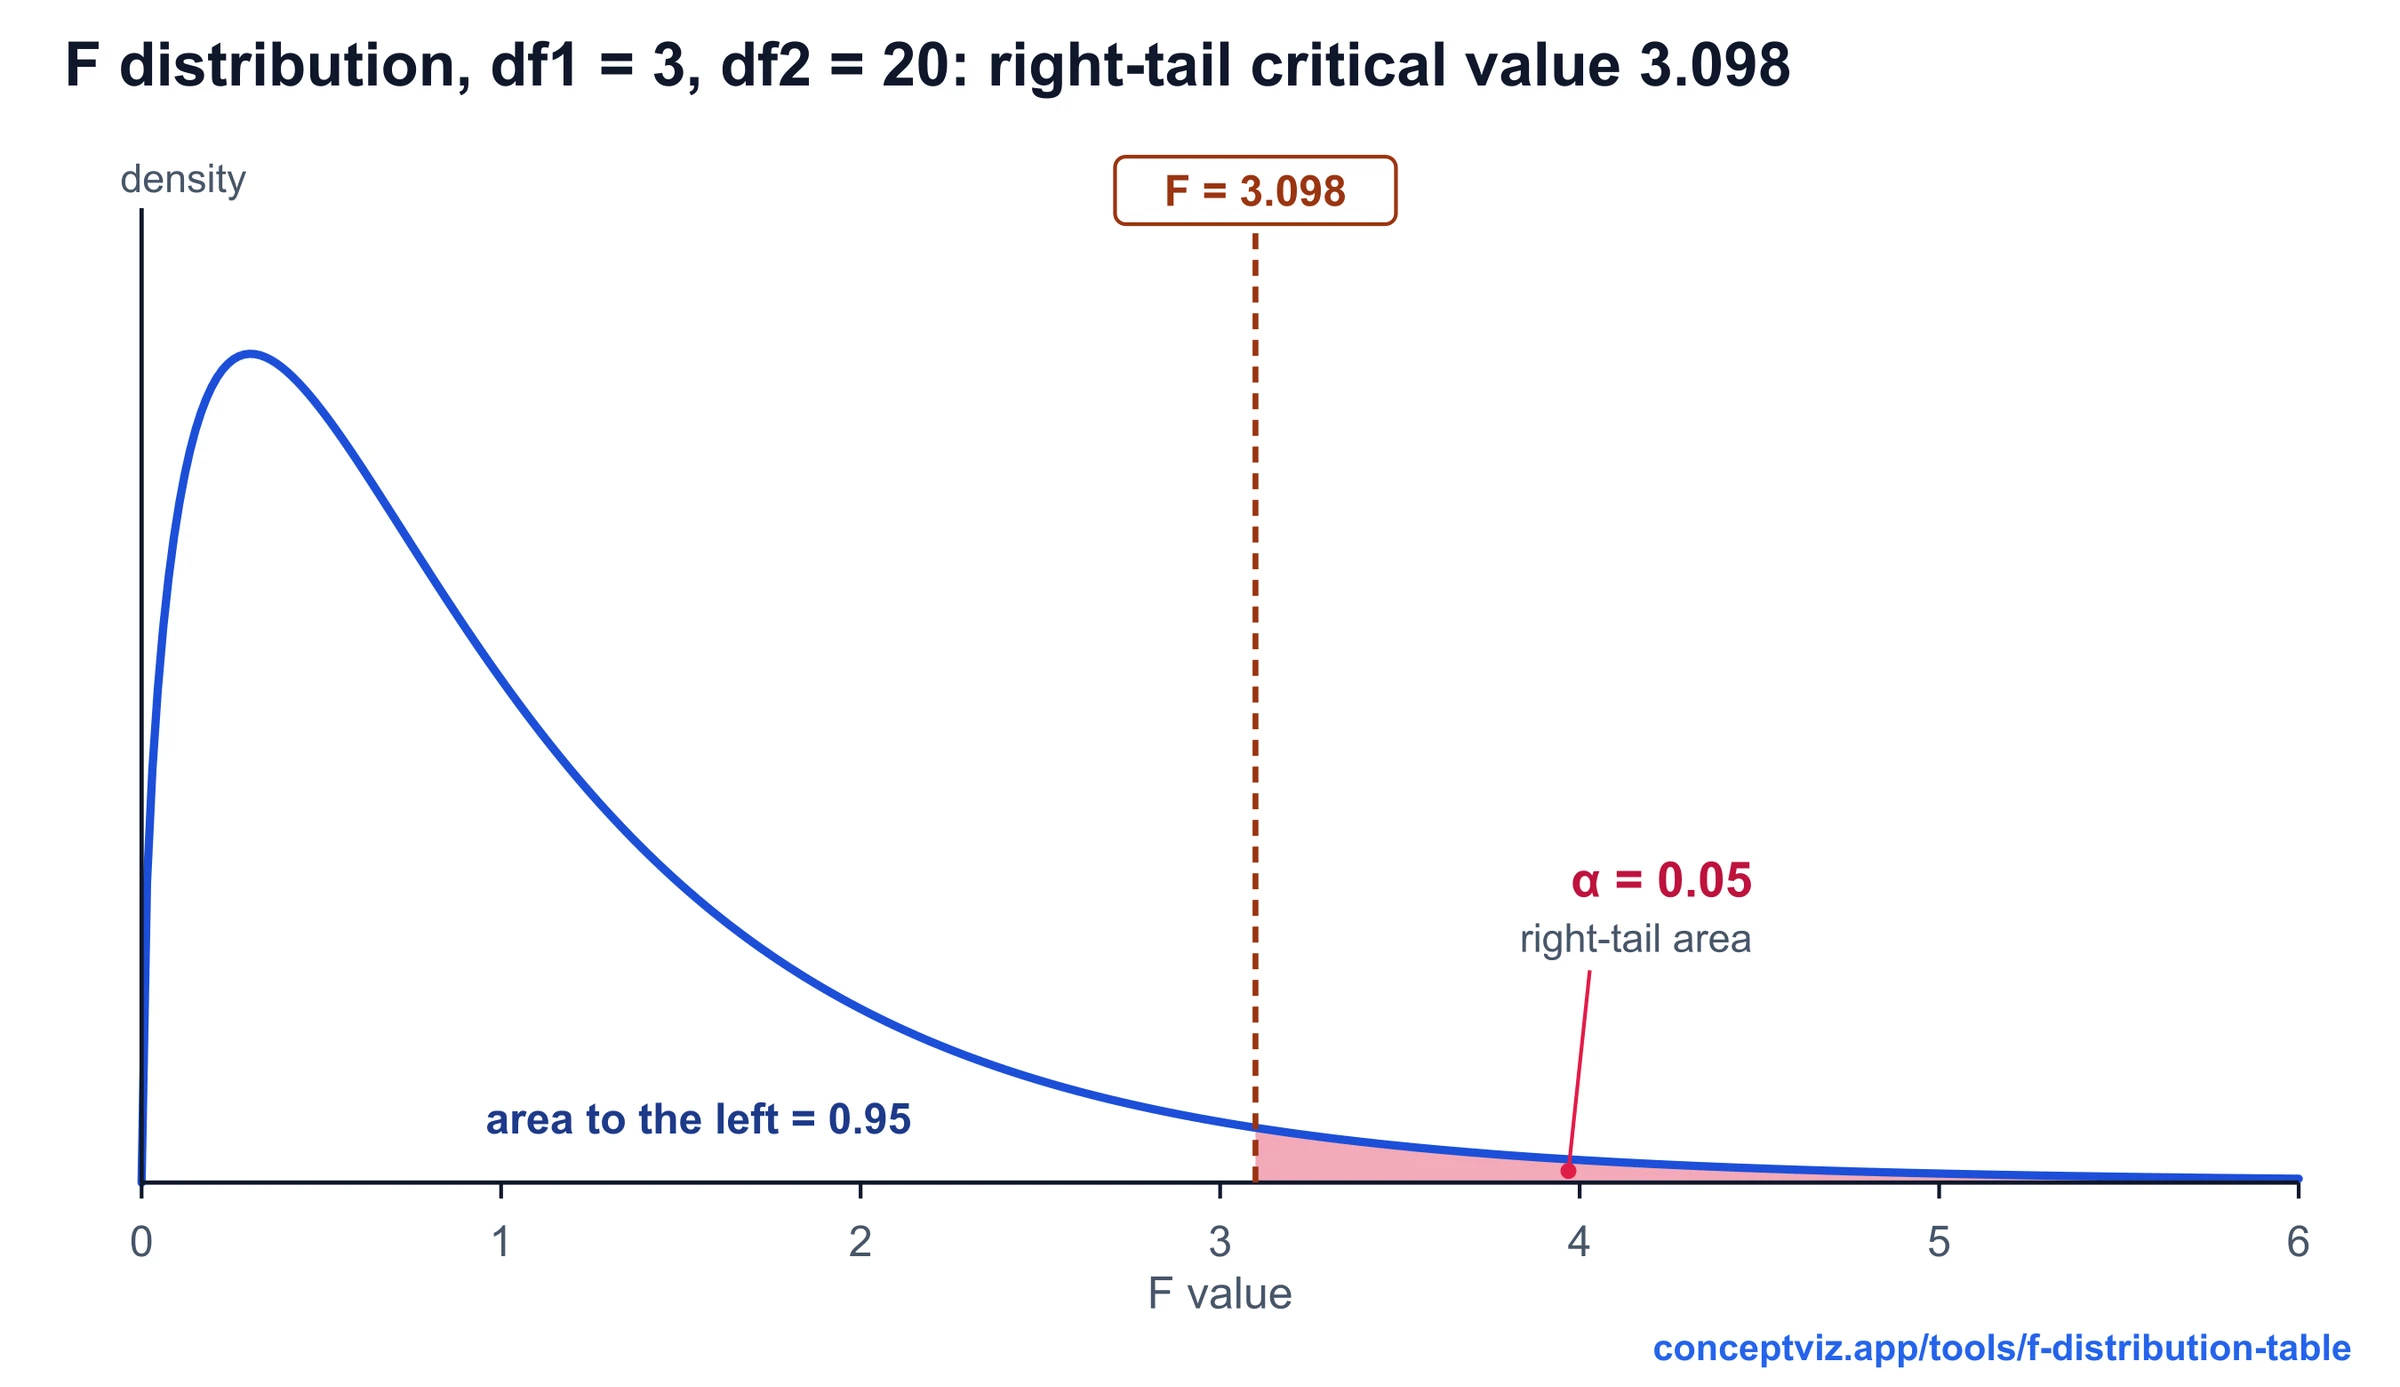
F distribution table with right-tail critical values for alpha 0.10, 0.05, 0.025 and 0.01, a critical value and p-value calculator, and printable sheets.
 Research
Bell Curve Generator
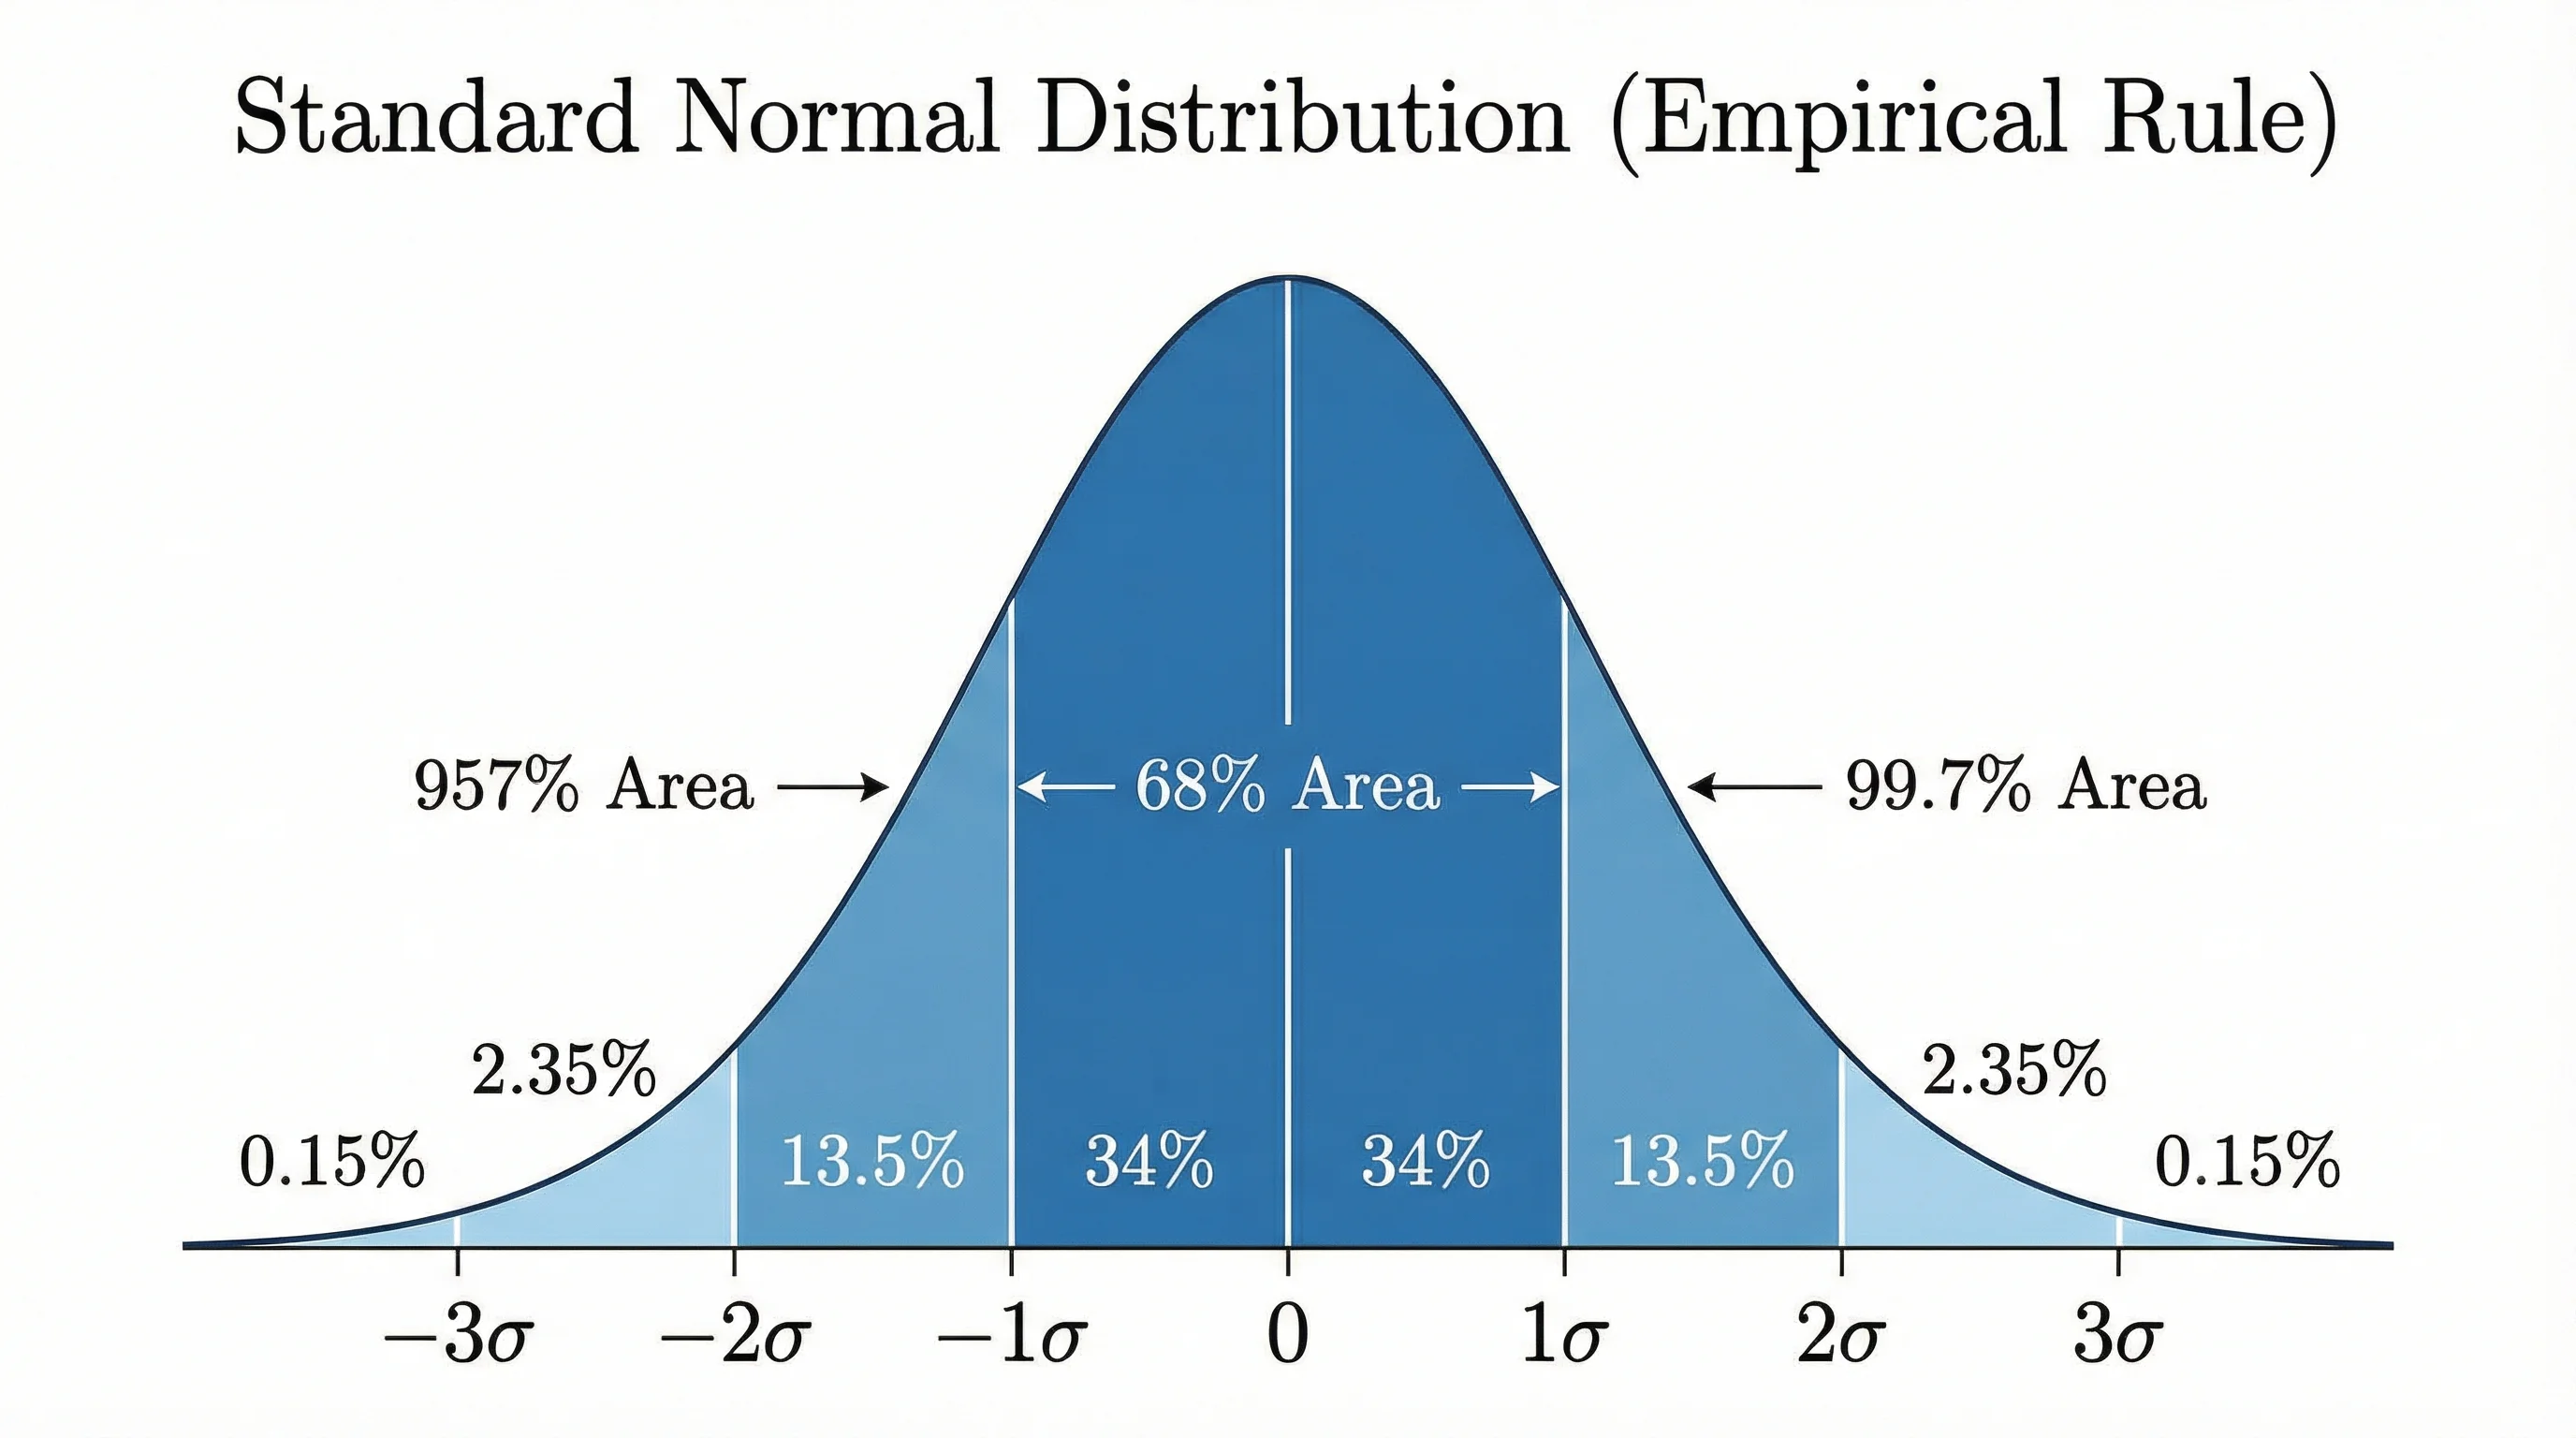
Create professional bell curves and normal distribution graphs for statistics, data analysis, and academic papers.