How to Make Figures for an NIH Grant Application
Figures belong in the Research Strategy, not Specific Aims. NIH rules with sources, three fictional overview-figure examples with prompts, and a checklist.
Most NIH grant figures fail for a boring reason: they are drawn last, squeezed in, and unreadable when the page is printed. NIH's own guidance gives you the constraints in a few sentences, and the rest is design. This guide covers the official rules (linked, checked October 2026), the figure types that earn their space in a Research Strategy, and three worked overview figures with the exact prompts, using fictional projects.
AI Scientific Image Generator
Describe your hypothesis and aims in plain text and get a clean overview figure to check every word before you use it.
Draft an aims overview figure →NIH figure rules at a glance
| Question | What NIH says | Source |
|---|---|---|
| Where do figures go? | "Figures should be included in the Research Strategy, Program Plan, or equivalent attachment and count towards page limits." | Format Attachments |
| Legibility | "Images and other figures must be readable as printed on an 8.5" x 11" page at normal (100%) scale." | Format Attachments |
| Text inside figures | Body text must be 11 points or larger, but smaller text in graphics, figures, graphs, diagrams, and charts is acceptable "as long as it is legible when the page is viewed at 100%." | Format Attachments |
| Margins and paper | At least one-half inch margins on all sides, nothing applicant-supplied in the margins, paper no larger than 8.5 x 11 inches | Format Attachments |
| Page limits | Follow the Table of Page Limits or your funding opportunity; limits are strictly enforced and the funding opportunity wins when they differ | Page Limits and Format Attachments |
| File size | "Applicants should use image compression such as JPEG or PNG to reduce overall application file size." | Format Attachments |
| Style | "Consider using a consistent font, color palettes, and visual style (e.g., icons and symbols)." Label axes with units, include keys, "Avoid relying solely on color to convey meaning," and "Try a test print in grayscale." | Tips for Tables, Charts, and Figures |
| Accessibility | NIH encourages "structural headers and meaningful Alt Text for images." | Tips page |
| Summary and Narrative | "should only include text (no figures)" unless the funding opportunity says otherwise | Format Attachments |
Checked October 2026. Your funding opportunity (NOFO) or a related NIH Guide notice overrides the general pages, so read Section IV of your own announcement.
Can you put a figure on the Specific Aims page?
The official answer is no. The NIH Format Attachments page says: "Figures should not be included in the Specific Aims attachment." It also notes that figures can interfere with NIH's post-award process for categorizing awards in RePORT. The Specific Aims attachment is limited to one page for application forms that use it (NIH Page Limits, checked October 2026), and the funding opportunity can change the limit.
So the aims overview figure in this guide is for the Research Strategy, for lab-meeting or mentor review, and for a slide when you talk to a program officer. It does not go on the aims page. If you think your situation is an exception, ask your program officer before you submit.
Which figures earn their space
The NIH tips page says figures can "summarize data, clarify your research, and add interest," and names branching diagrams such as flowcharts and workflows for scientific plans, and timelines for stages of research done and planned. In a Research Strategy, four jobs recur:
| Figure | Job | Common placement (convention, not an NIH rule) |
|---|---|---|
| Aims overview | Show hypothesis, how the aims connect, and the expected outcome in one glance | Start of Research Strategy or start of Approach |
| Study design or workflow | Show who or what is sampled, what is manipulated, what is measured, and when | Inside each aim |
| Timeline | Show stages done and planned, milestones, and decision points | End of Approach |
| Preliminary data panel | Prove feasibility with real data | Significance or Approach |
A preliminary data panel is your real data, not something to generate. Lay it out so each panel answers one reviewer question, label axes with units, state n, and keep panel letters and colors consistent with the rest of the section. An AI tool is useful for the diagrams in the first three rows, where you supply the words and check every one.
One more NIH rule matters if you use an AI image tool. NIH notice NOT-OD-25-132 (released July 17, 2025) says NIH will not consider applications substantially developed by AI to be the applicant's original ideas. The notice also covers applications that contain sections substantially developed by AI. It does not mention figures or image tools, so the following is our reading, not NIH's wording: a figure that lays out your own hypothesis and aims in your own words is a layout aid, and you should not ask a tool to invent the science. Check with your institution's research office. We searched NIH's site for a newer AI notice that replaces this one and found none (checked October 2026).
What the current top results cover, and the gap
Searching for NIH grant figures returns NIH's own two pages (Format Attachments and Tips for Tables, Charts, and Figures), a design-studio post that maps five figure types to reviewer questions, a medical-illustration vendor guide, and university formatting slides. The NIH pages give the rules but no worked examples. The vendor posts give good advice (one job per figure, consistent symbols across aims) but, in the one we read in full, no worked example, no sample caption, and no NIH rule citations. This guide adds the rules with links, three complete examples with the exact prompts, and a checklist you can run before submission.
Figure 1: the aims overview, from vague prompt to exact prompt
The aims overview is the figure most grant writers want first, so we built three. Start with what a vague prompt gives you.
First draft: a vague prompt
The first prompt was deliberately loose:
Make a clean specific aims overview figure for an NIH grant about microglia and lipid droplets in the aging brain, with three aims.
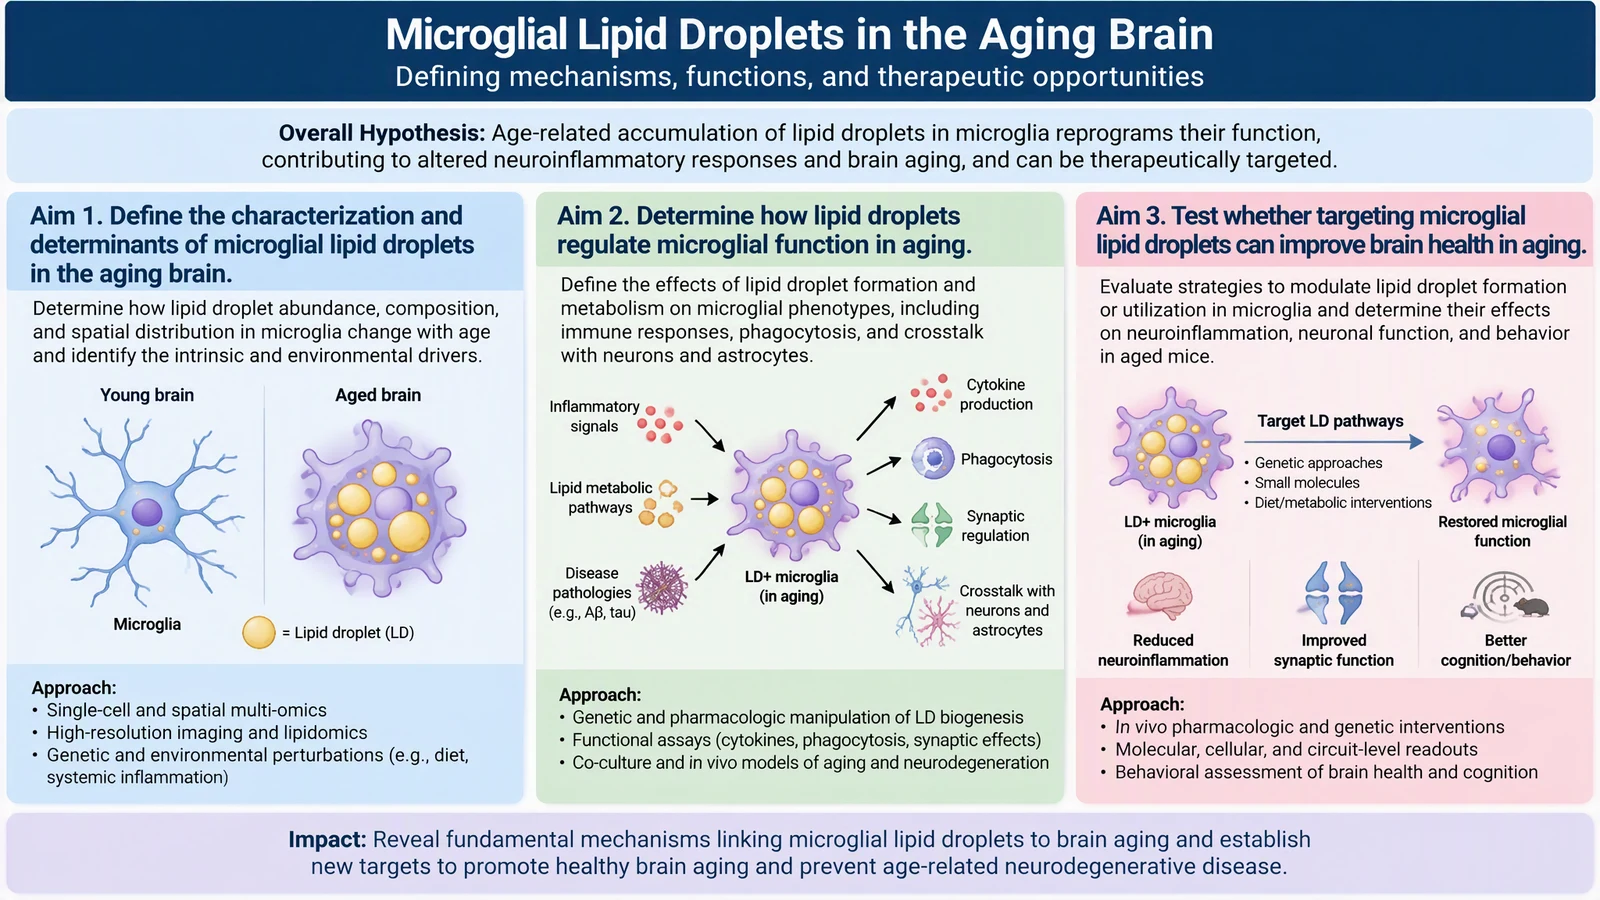
First draft from the vague prompt above. It reads well, but the tool wrote its own aim wording ("Define the characterization and determinants of microglial lipid droplets..."), added claims about Aβ, tau, diet, and astrocytes that the prompt never gave, and packed in so much small text that it would not survive a one-column Research Strategy layout. Aim 3's heading also touches the edge of its box. Fictional project; do not reuse the wording.
This is the usual failure. If you do not give the exact words, the tool supplies plausible ones, and plausible is not the same as yours.
Revised version: exact text in the prompt
The fix is to put the exact words in the prompt and to say "use exactly this text and no other words."
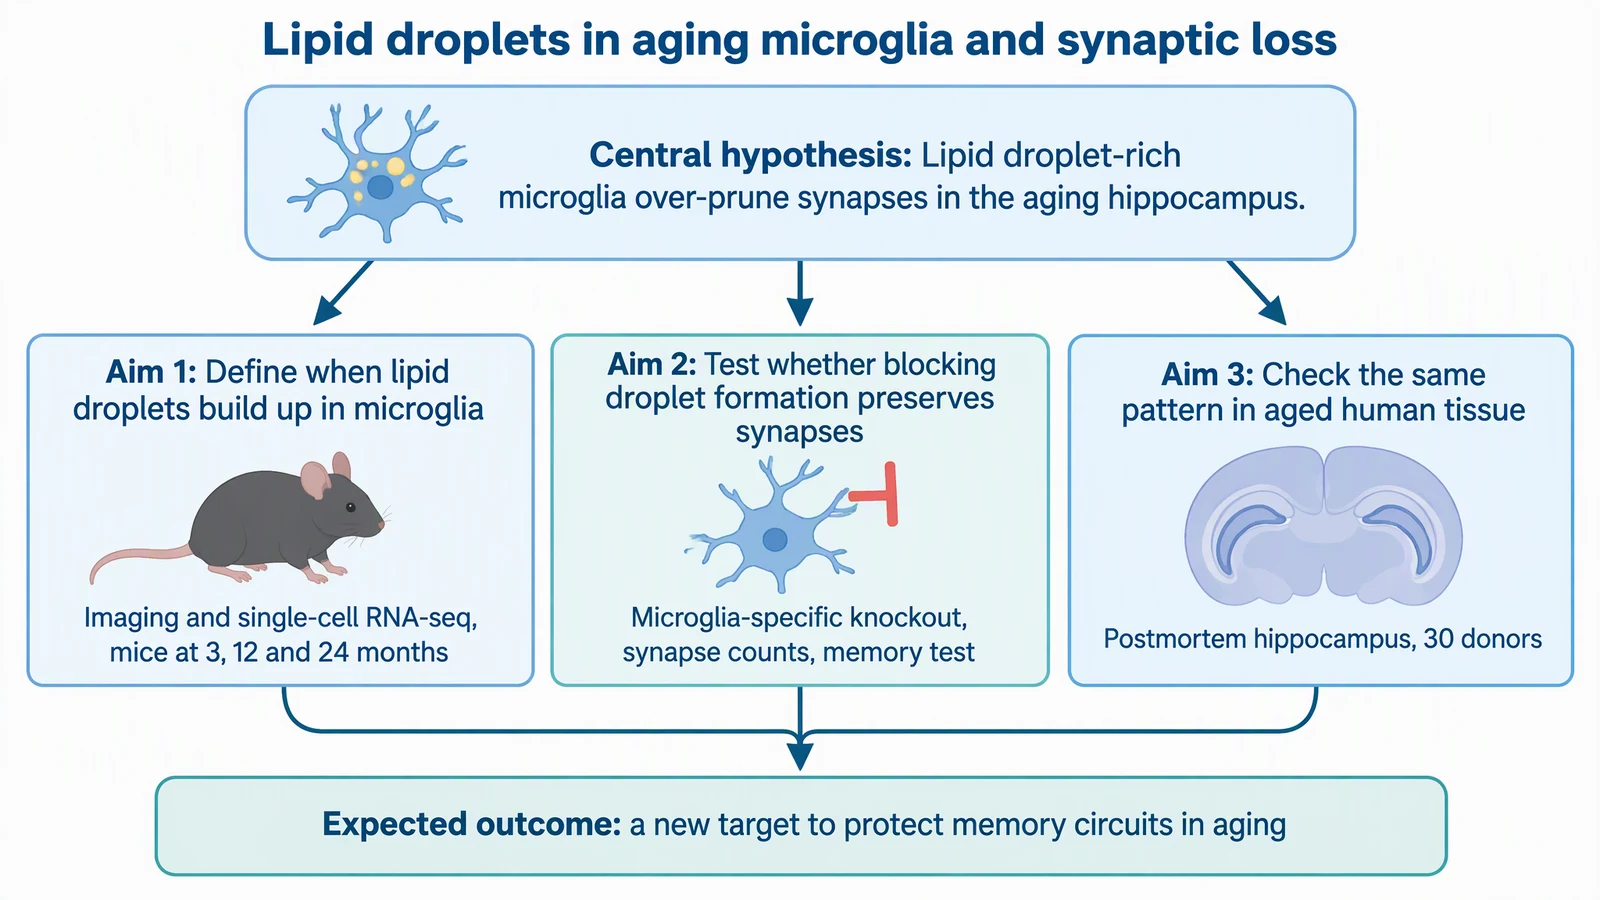
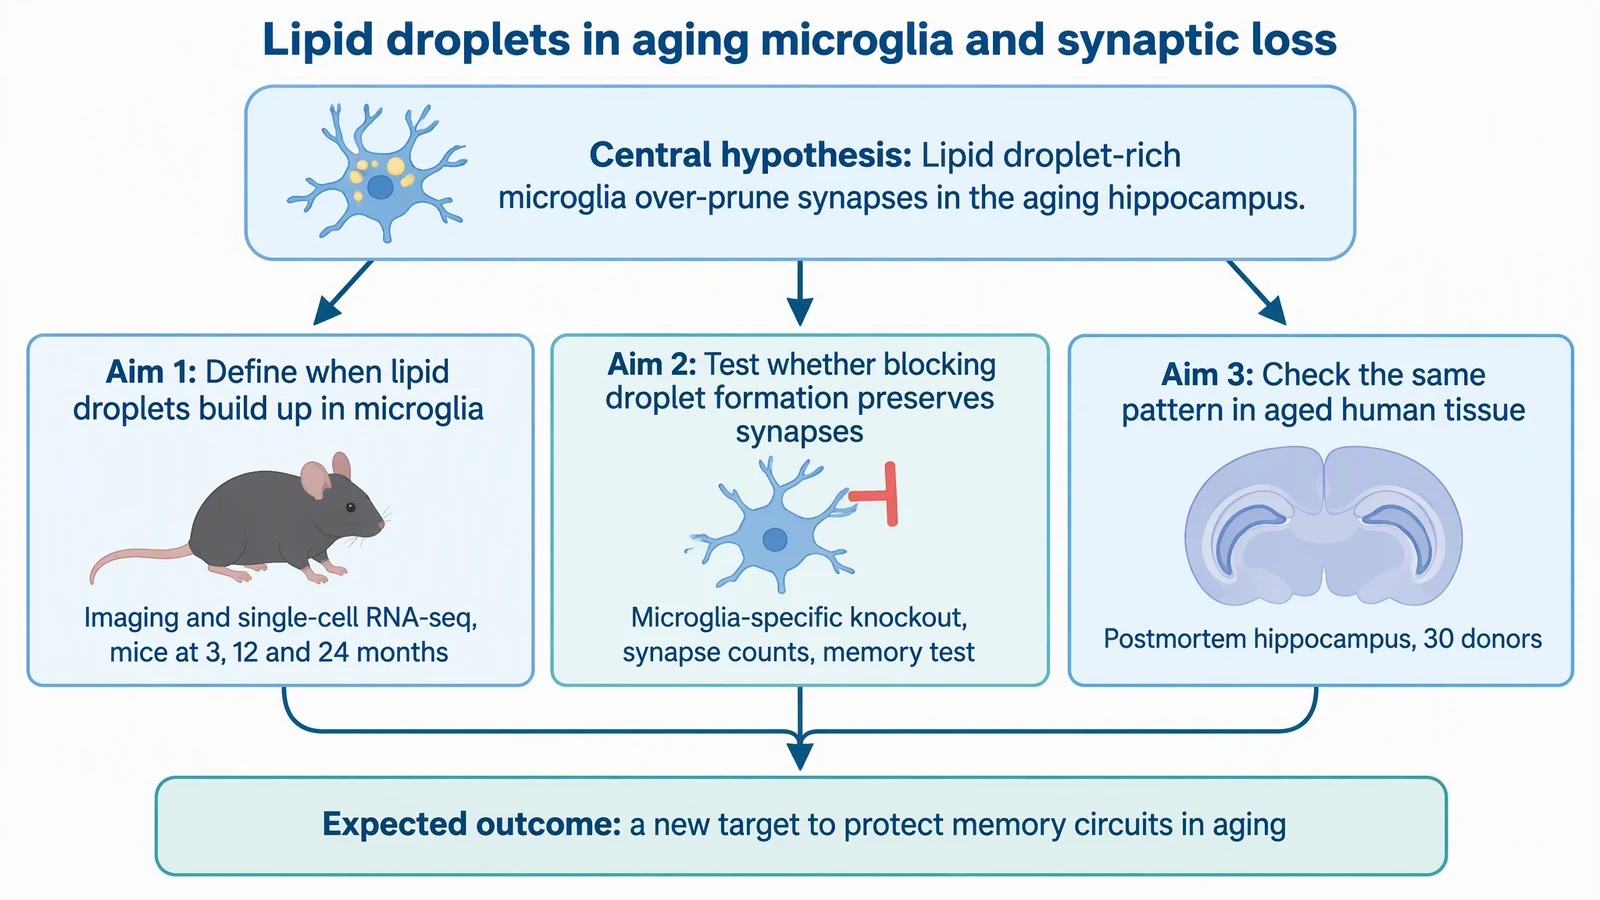
Revised overview figure, neuroscience example (fictional project). Every word matches the prompt below. Known flaws: the blocking symbol in the Aim 2 icon is unlabeled, and the Aim 3 icon looks like a rodent brain section rather than a human one. Icons are decorative; delete or replace them if they could mislead. Size check: at a full 7.5-inch text width the small approach lines in these images are roughly 8 pt, and they would fall below legible at half-page width, so print a test page as the checklist says.
The prompt, with the layout and text spelled out:
A clean, flat scientific overview figure for the Research Strategy of a grant application, white background, landscape, blue and teal palette, sans-serif text, generous margins. Layout: title across the top, then a central hypothesis box, then three aim boxes in a row connected by arrows, then an expected outcome bar at the bottom. Use exactly this text and no other words.
Title: "Lipid droplets in aging microglia and synaptic loss"
Hypothesis box: "Central hypothesis: Lipid droplet-rich microglia over-prune synapses in the aging hippocampus."
Aim 1 box: "Aim 1: Define when lipid droplets build up in microglia" with smaller line "Imaging and single-cell RNA-seq, mice at 3, 12 and 24 months"
Aim 2 box: "Aim 2: Test whether blocking droplet formation preserves synapses" with smaller line "Microglia-specific knockout, synapse counts, memory test"
Aim 3 box: "Aim 3: Check the same pattern in aged human tissue" with smaller line "Postmortem hippocampus, 30 donors"
Bottom bar: "Expected outcome: a new target to protect memory circuits in aging"
Simple flat icons only (a microglia cell, a mouse, a brain section); no extra text, no logos, no watermark.
Example 2: public health trial
Different field, same five parts. Here the aims are drawn left to right: barriers, then trial, then cost.
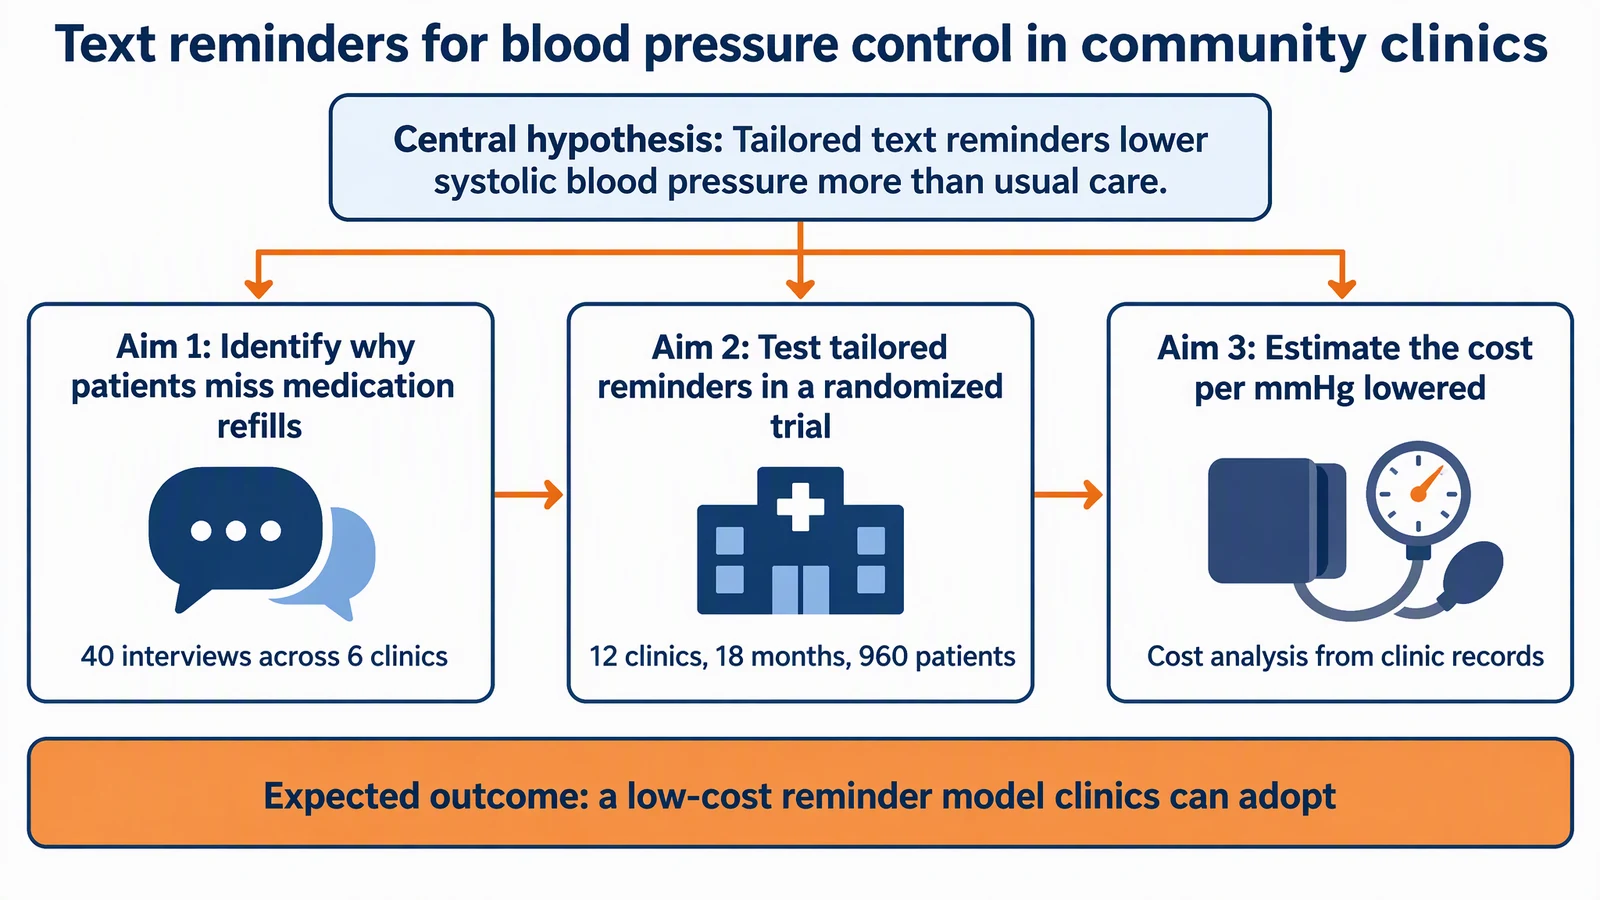
Public health example (fictional project, invented numbers). All text matches the prompt exactly. Known flaw: the sequence arrows suggest Aim 3 waits for Aim 2 to finish, which may not be true in your design, so remove arrows that overstate dependence.
A clean, flat scientific overview figure for the Research Strategy of a grant application, white background, landscape, navy and orange palette, sans-serif text, generous margins. Layout: title across the top, then a central hypothesis box, then three aim boxes in a row connected by arrows, then an expected outcome bar at the bottom. Use exactly this text and no other words.
Title: "Text reminders for blood pressure control in community clinics"
Hypothesis box: "Central hypothesis: Tailored text reminders lower systolic blood pressure more than usual care."
Aim 1 box: "Aim 1: Identify why patients miss medication refills" with smaller line "40 interviews across 6 clinics"
Aim 2 box: "Aim 2: Test tailored reminders in a randomized trial" with smaller line "12 clinics, 18 months, 960 patients"
Aim 3 box: "Aim 3: Estimate the cost per mmHg lowered" with smaller line "Cost analysis from clinic records"
Bottom bar: "Expected outcome: a low-cost reminder model clinics can adopt"
Simple flat icons only (a chat bubble, a clinic building, a blood pressure cuff); no extra text, no logos, no watermark.
Example 3: materials chemistry
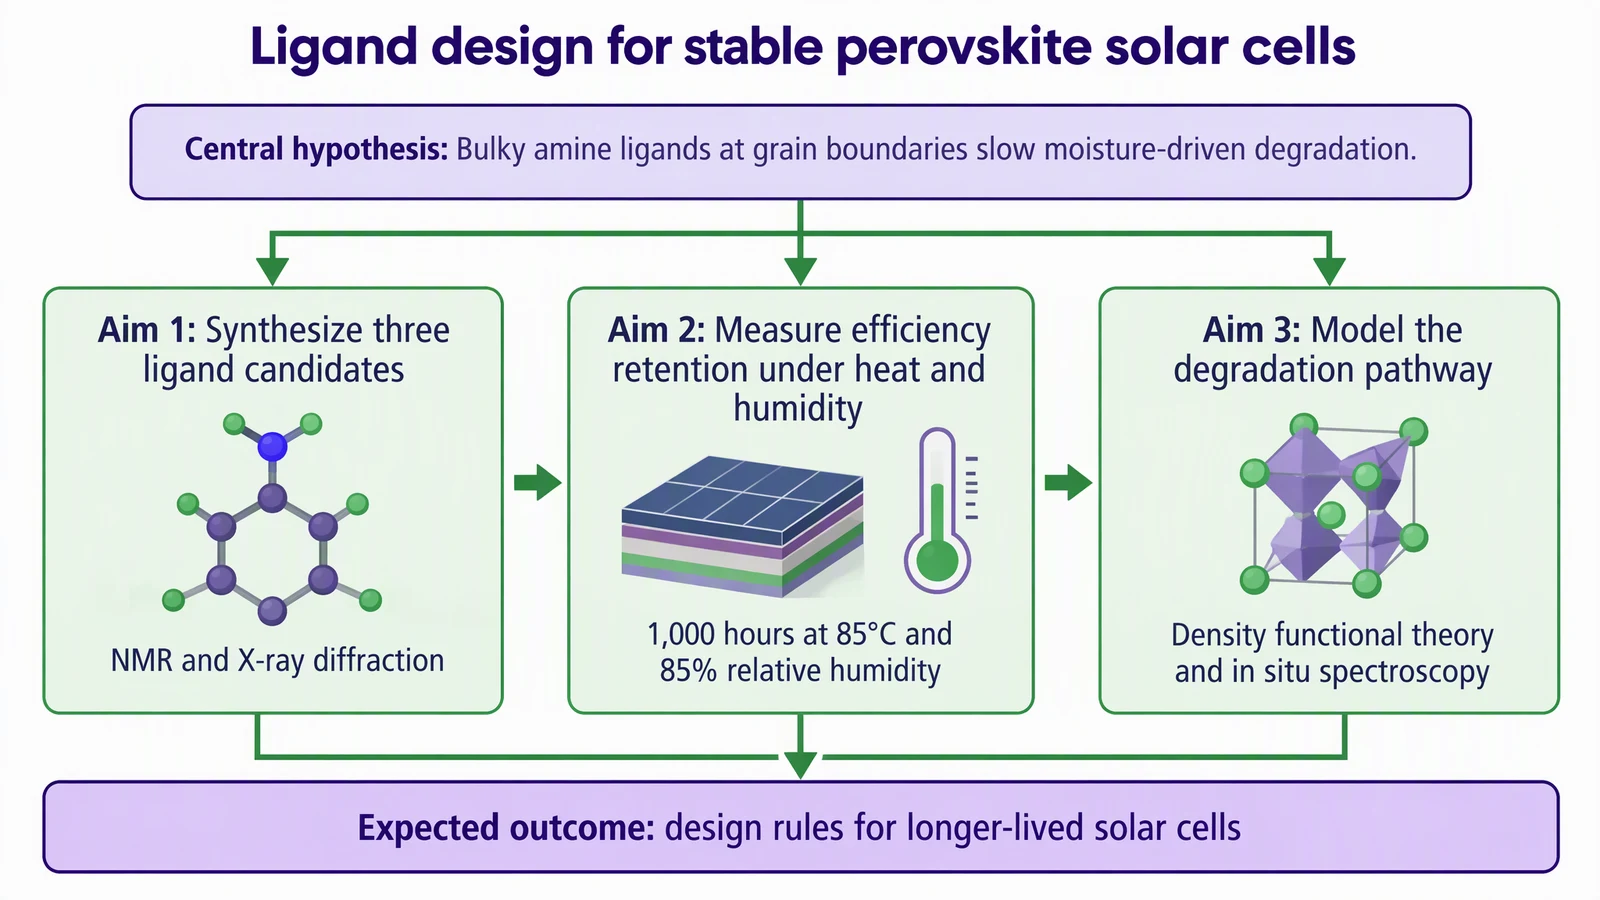
Materials example (fictional project). The first render spelled the verb "Synthesise", so we regenerated it with the spelling spelled out in the prompt; this version reads "Synthesize" and every other word matches. Known flaws: the Aim 1 molecule is a generic ring with an amine group, not one of the proposed ligands, and the Aim 2 and Aim 3 icons are illustrative only. The arrows between aims imply Aim 3 follows Aim 2; delete them if your aims run in parallel.
A clean, flat scientific overview figure for the Research Strategy of a grant application, white background, landscape, purple and green palette, sans-serif text, generous margins. Layout: title across the top, then a central hypothesis box, then three aim boxes in a row connected by arrows, then an expected outcome bar at the bottom. Use exactly this text and no other words.
Title: "Ligand design for stable perovskite solar cells"
Hypothesis box: "Central hypothesis: Bulky amine ligands at grain boundaries slow moisture-driven degradation."
Aim 1 box: "Aim 1: Synthesize three ligand candidates" (spelled with a letter z, American spelling) with smaller line "NMR and X-ray diffraction"
Aim 2 box: "Aim 2: Measure efficiency retention under heat and humidity" with smaller line "1,000 hours at 85°C and 85% relative humidity"
Aim 3 box: "Aim 3: Model the degradation pathway" with smaller line "Density functional theory and in situ spectroscopy"
Bottom bar: "Expected outcome: design rules for longer-lived solar cells"
Simple flat icons only (a molecule, a solar cell layer stack, a thermometer); keep the temperature icon clear of the Aim 2 text; no extra text, no logos, no watermark.
The same template works for clinical trials, field ecology, computational methods, and training grants. Swap the title, the three aim lines, and the outcome; keep the layout sentence.
Research Strategy figure checklist
The size and legibility rules come from the NIH Format Attachments page above.
- Text matches. Every word in the figure appears in your written aims. Read the image word by word, including small lines and titles. AI tools misspell and respell.
- Readable at 100%. Print at letter size, or view the PDF at 100%. If you cannot read the smallest line without zooming, shorten the text or drop an element.
- Small text is legible, not tiny. NIH accepts figure text below 11 points only if it stays legible at 100%. As a working habit, keep aim lines as large as the layout allows and test the smallest line on a printed page.
- Fits the page. Margins of at least one-half inch, paper no larger than 8.5 x 11 inches, nothing in the margins. Figures count toward the Research Strategy page limit.
- Three aims, three boxes. Same numbering and order as your text. If you changed an aim, change the figure.
- Arrows are true. Draw dependence only where it exists. If Aim 3 can proceed without Aim 2, no arrow.
- No results in the overview. The overview states plans and expected outcomes. Data belongs in preliminary data panels.
- Survives grayscale. Print a test page in grayscale, as NIH suggests, and do not encode meaning in color alone.
- Consistent style. Same font, palette, and icon style across all figures in the application.
- Compressed and accessible. Use PNG or JPEG compression, add meaningful alt text where your workflow allows, and check the final PDF, because some conversion software reduces font size.
- Ideas are yours. The hypothesis, aims, and outcome came from you. Cross-check NIH's AI originality notice and your institution's rules.
How to build yours
- Write your aims text first. Finish it before drawing.
- Copy the title, hypothesis, three aim lines, one approach line each, and the outcome into the prompt template, with the sentence "Use exactly this text and no other words."
- Generate, then read every word. Fix a misspelling by quoting the correct spelling in the prompt and regenerating.
- Delete anything that is not in your text. Remove arrows that overstate dependence.
- Place it in the Research Strategy, a lab-meeting slide, or a program officer slide, then run the checklist.
You can start free with 2 image credits, valid for 7 days, no card required. Generated figures are drafts you must check and, if needed, redraw by hand.
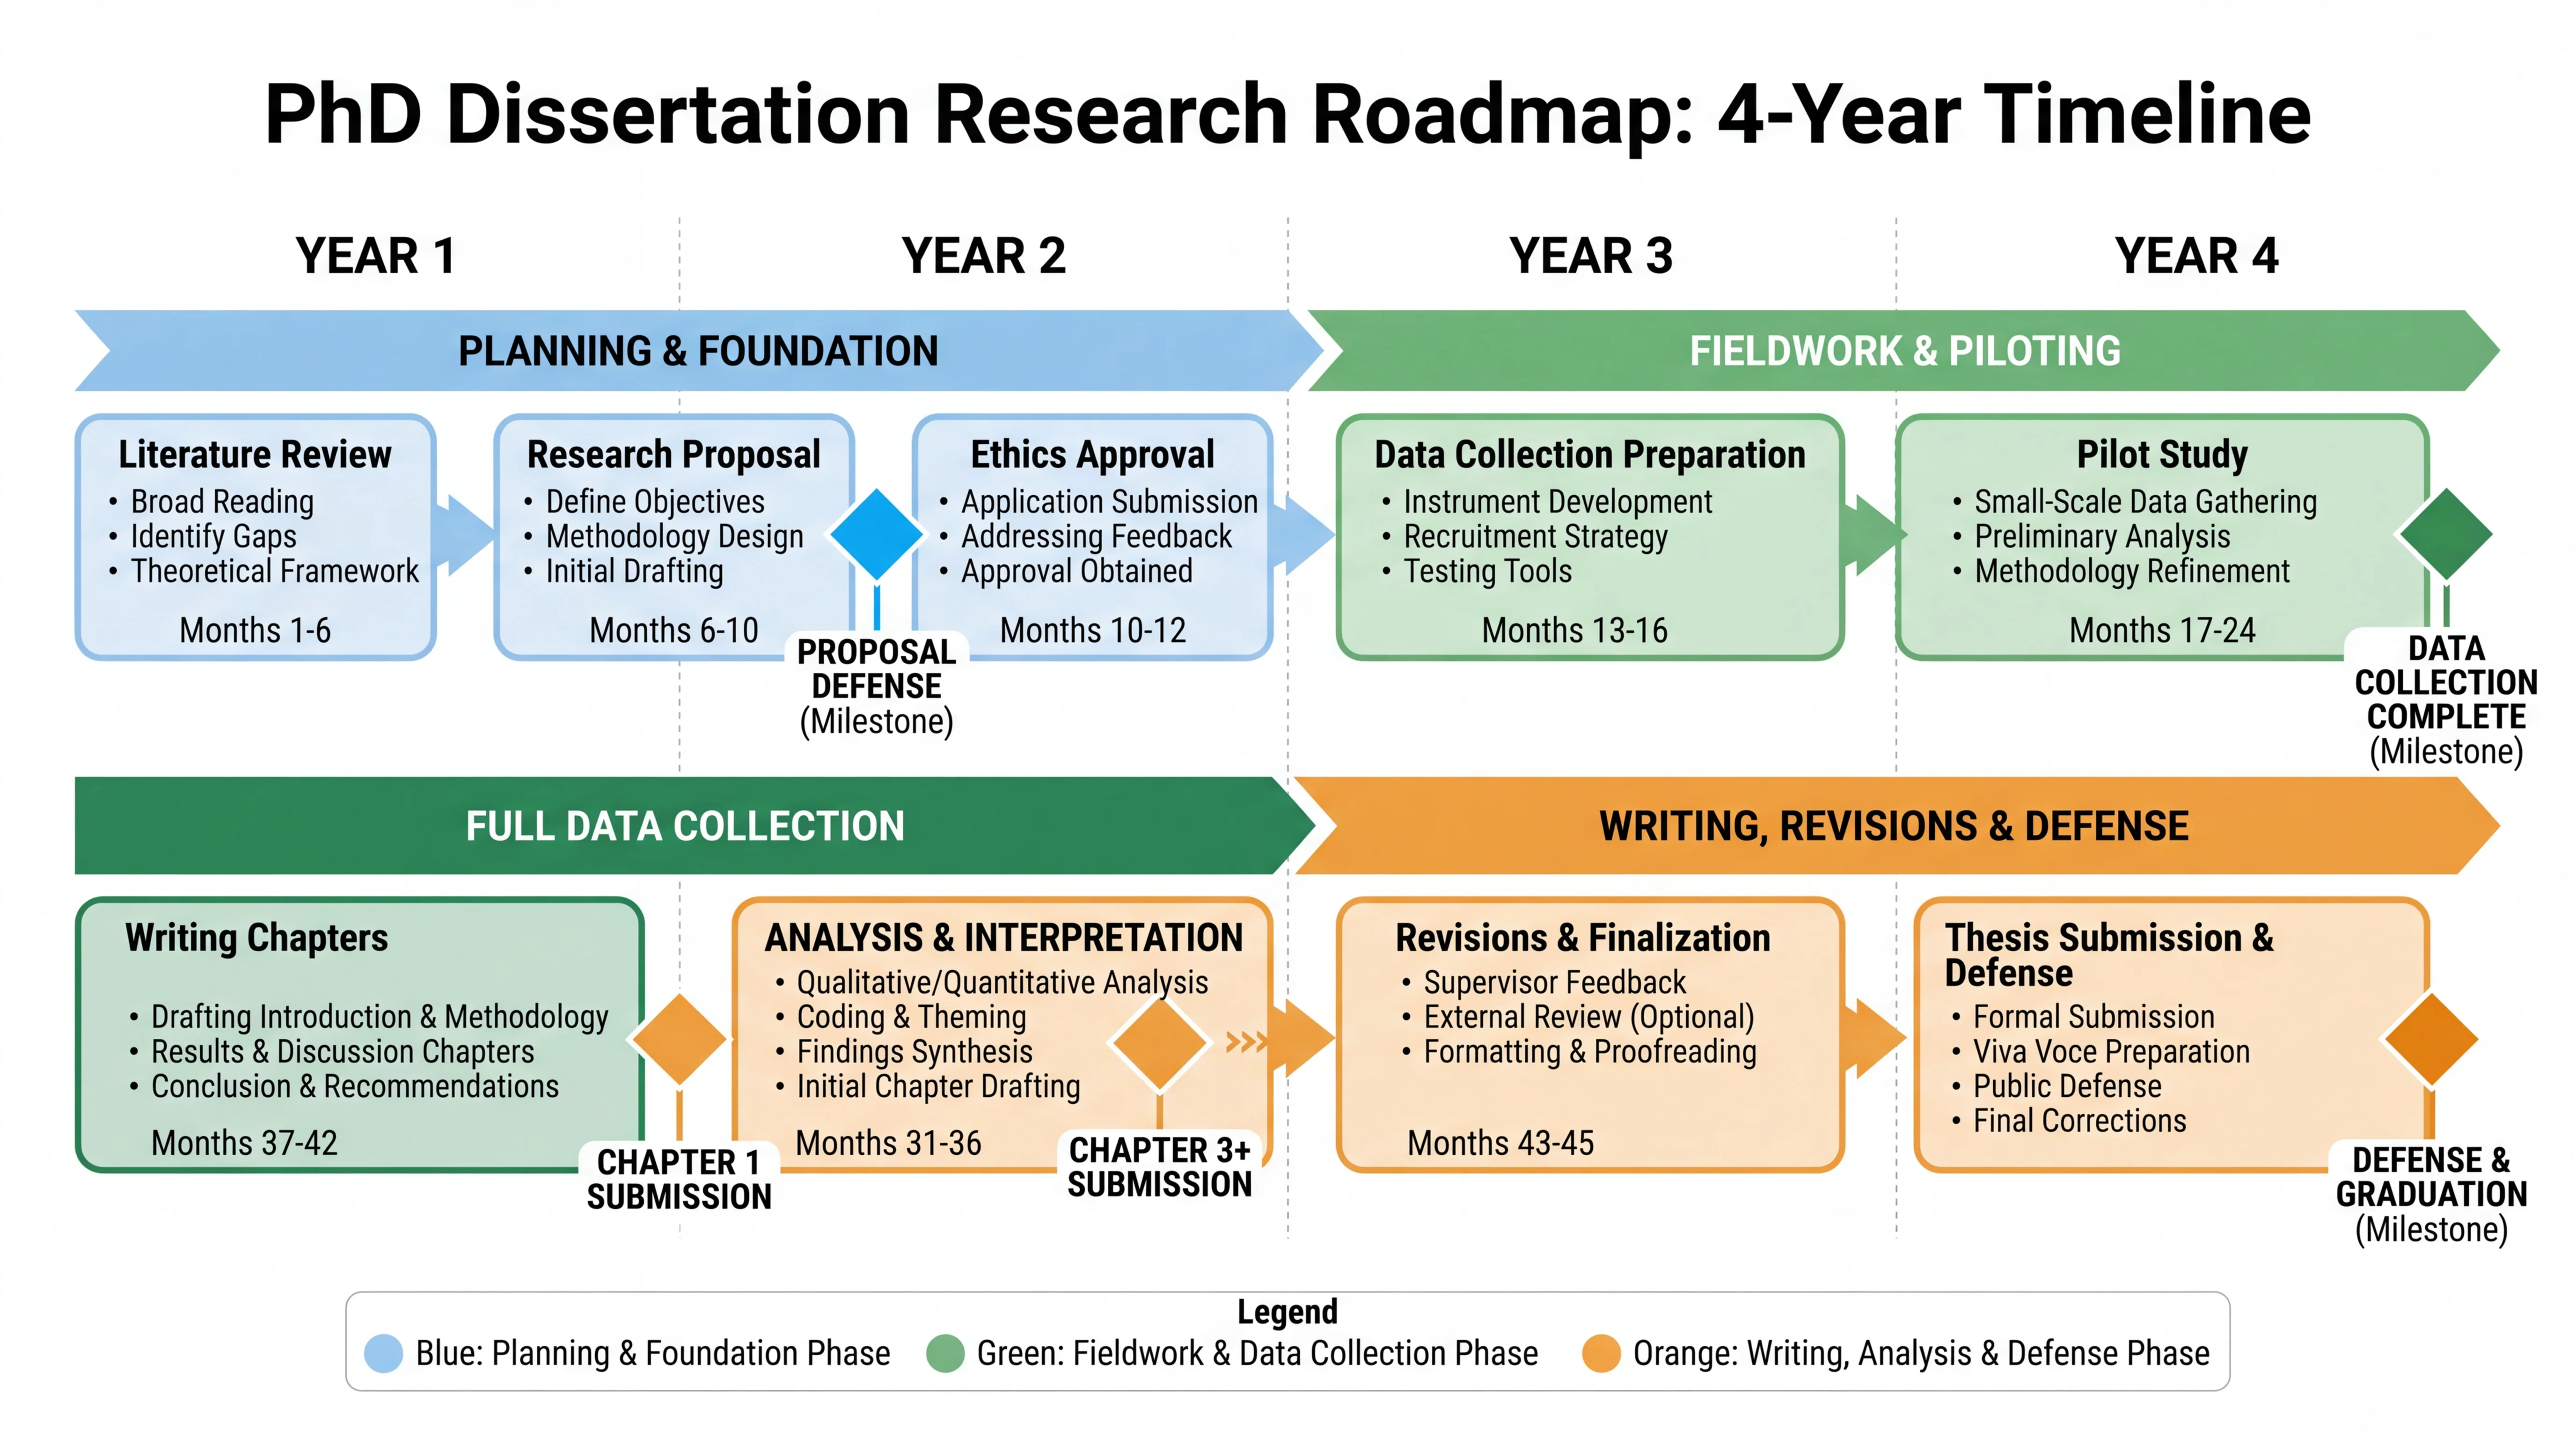
Research Roadmap Maker
Turn a multi-year plan into a timeline when reviewers need to see sequence and milestones.
This is not a graphical abstract
A graphical abstract is a single panel for a journal article's landing page, built after the work is done. An aims overview is a planning figure for work you have not done yet.
- For journal panels, see How to Make a Graphical Abstract and Visual Abstract vs Graphical Abstract.
- For a multi-year timeline, use the Research Roadmap Maker.
- For inputs, activities, outputs, and outcomes (common in training and community grants), use the Logic Model Generator.
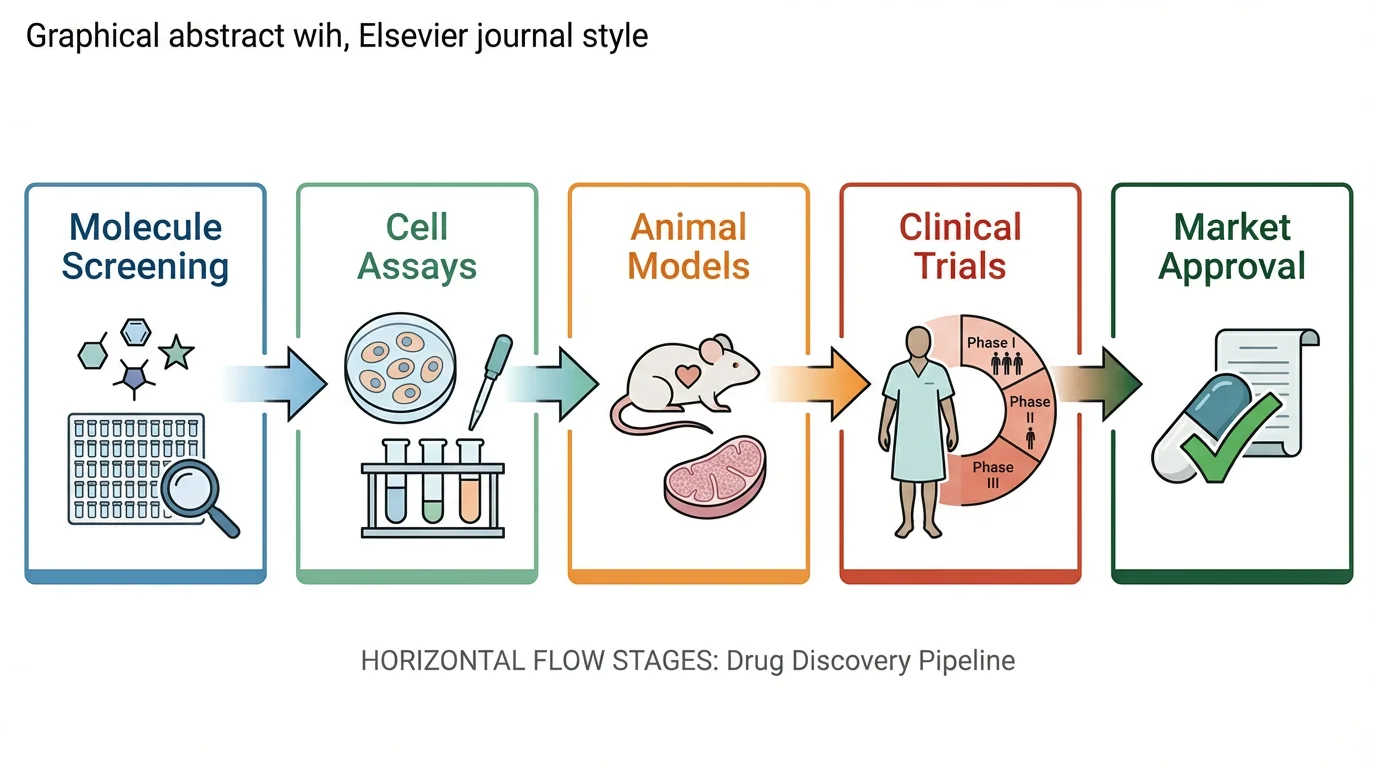
Graphical Abstract Maker
For the finished study panel a journal asks for, after the aims have turned into results.
FAQ
Can I put a figure on the Specific Aims page? NIH's Format Attachments page says "Figures should not be included in the Specific Aims attachment." Put the figure in the Research Strategy, and ask your program officer if you believe you have a special case.
Do figures count toward the Research Strategy page limit? Yes. NIH says figures in the Research Strategy "count towards page limits," and that page limits are strictly enforced. Check your funding opportunity for the exact limit.
What font size should text in a figure be? Body text must be 11 points or larger. NIH accepts smaller text in graphics, figures, graphs, diagrams, and charts as long as it is legible when the page is viewed at 100%.
Can I add figures to the Project Summary or Project Narrative? Not unless the funding opportunity says otherwise. NIH says those attachments should only include text.
Can I use an AI tool to make a grant figure? NIH's notice NOT-OD-25-132 says applications substantially developed by AI are not considered the applicant's original ideas. Using a tool to lay out your own words is different from asking it to write the science, but follow your institution's and NIH's current rules, and check every word.
Related guides
Further reading
- NIH, Format Attachments (checked October 2026)
- NIH, Page Limits (checked October 2026)
- NIH, Tips for Tables, Charts, and Figures (checked October 2026)
- NIH, NOT-OD-25-132, Supporting Fairness and Originality in NIH Research Applications
更多文章
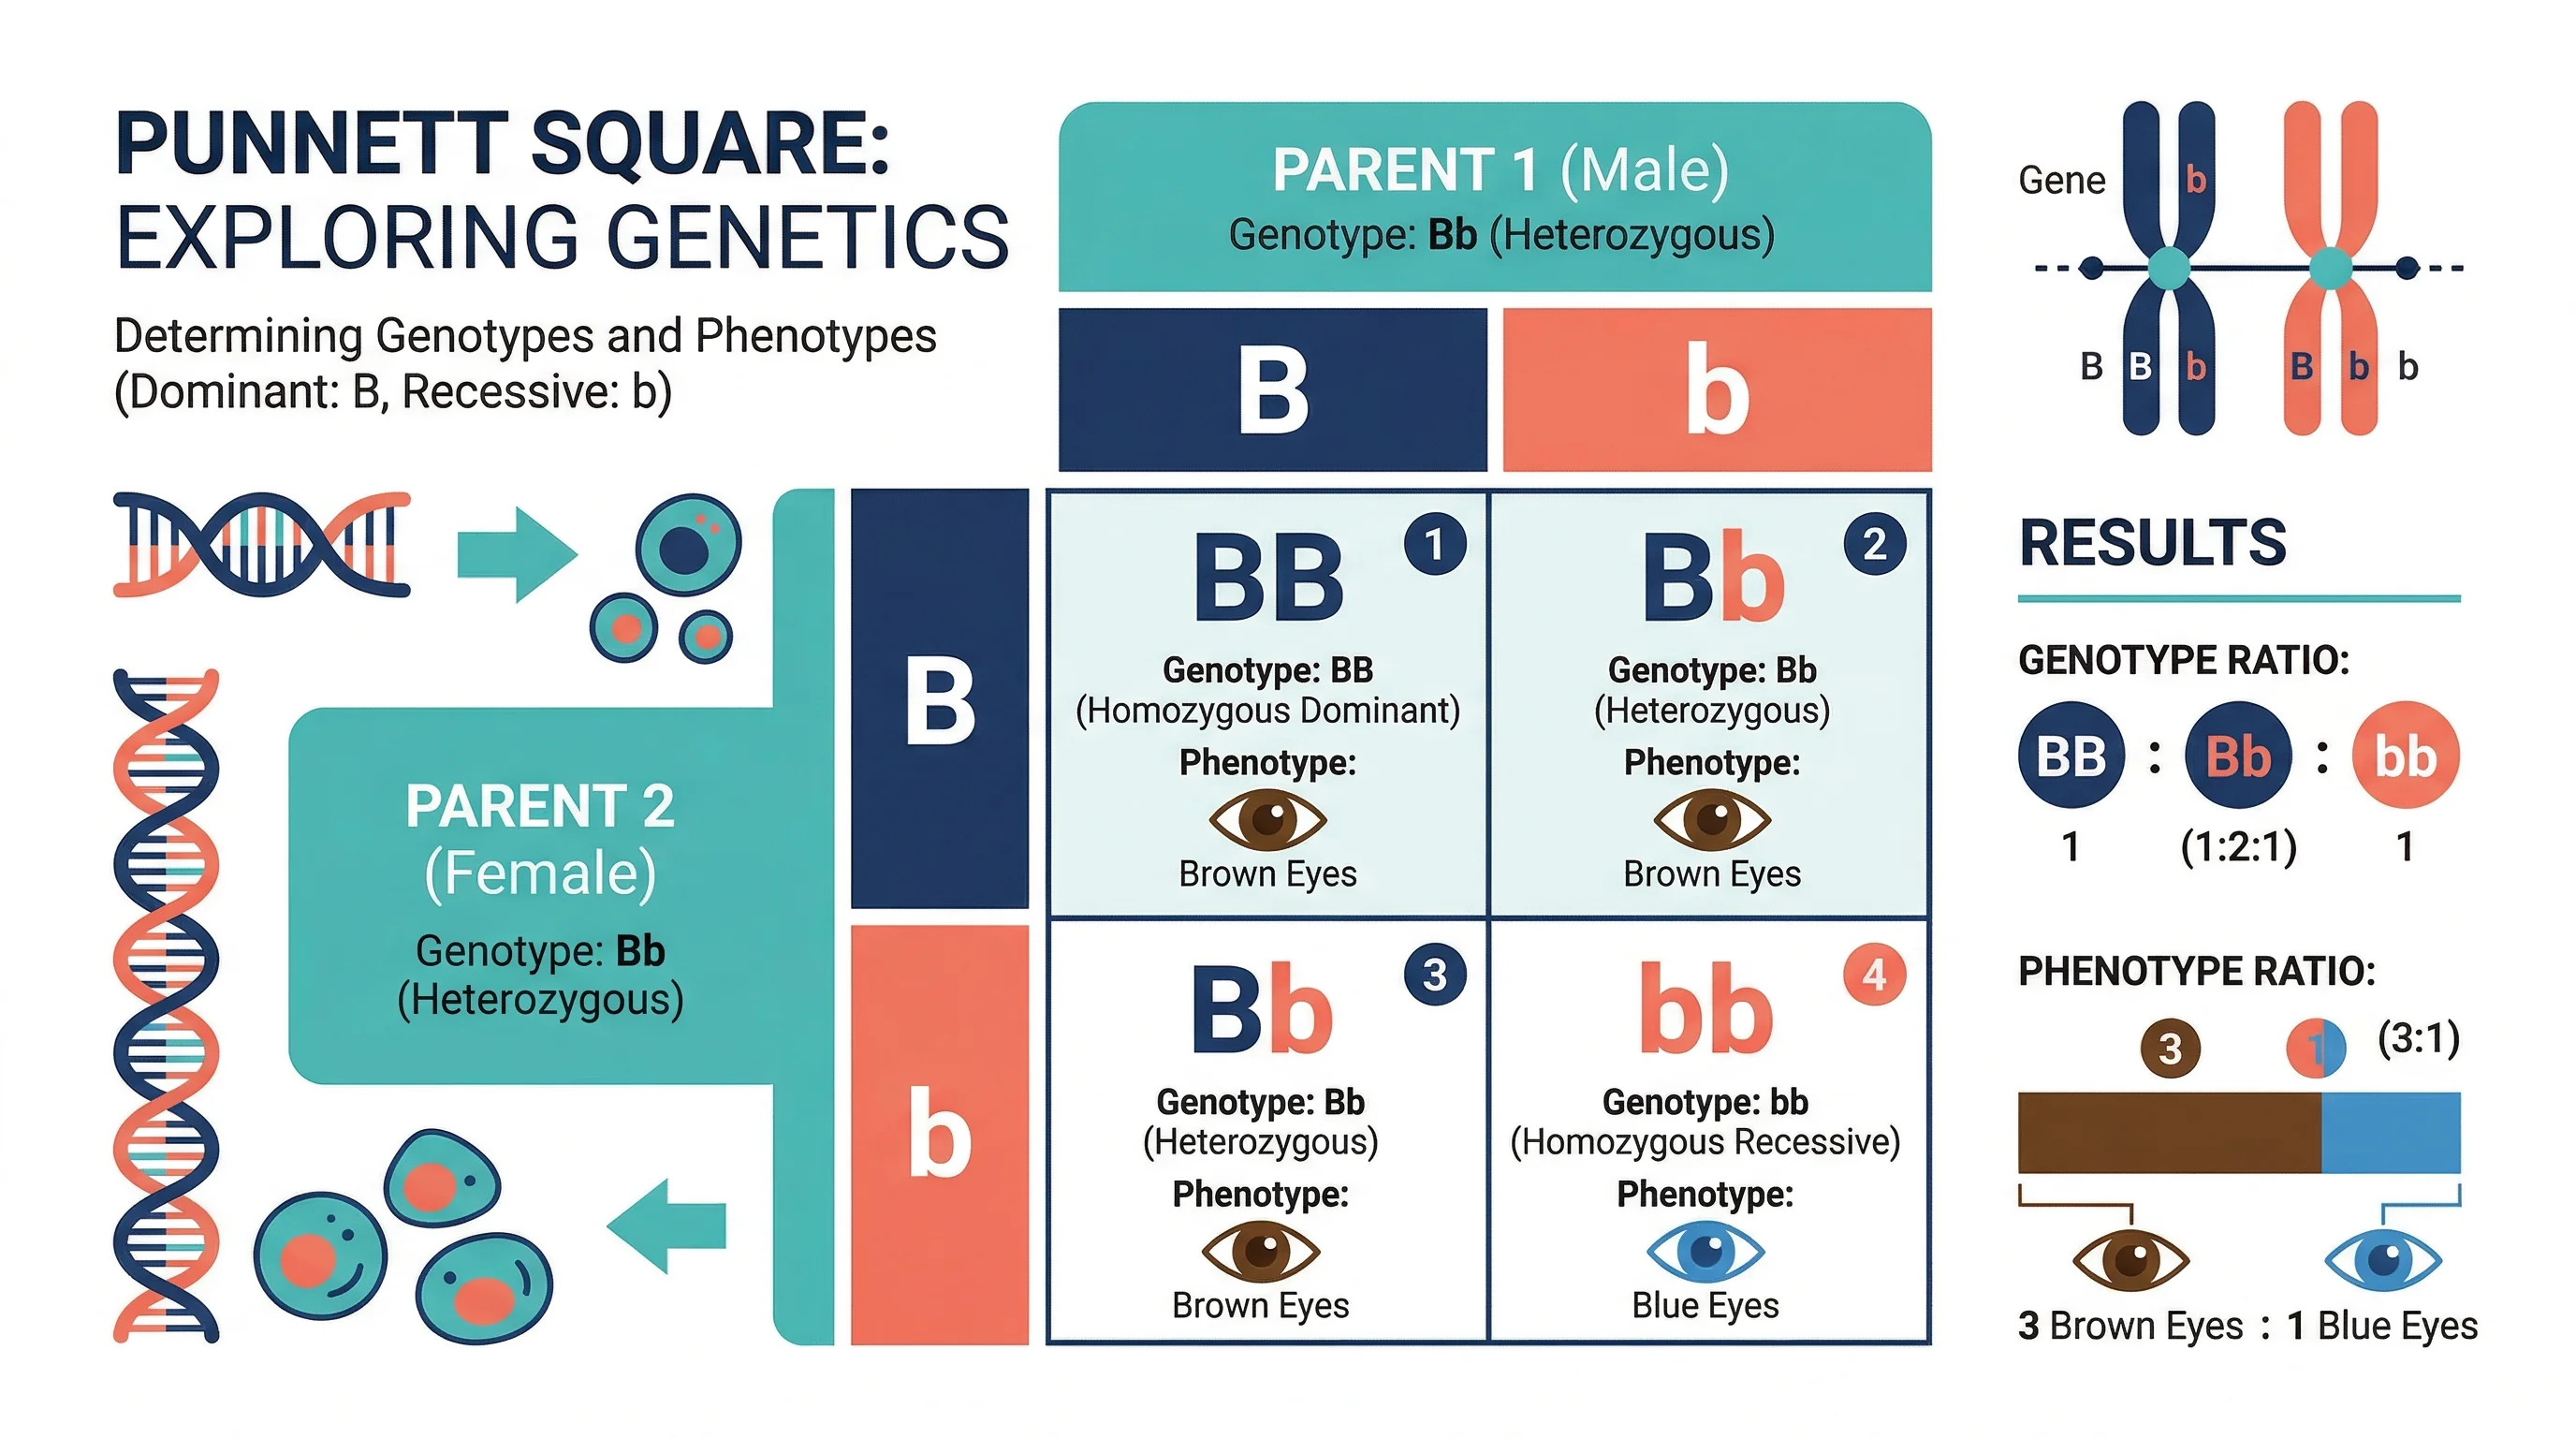
How to Make a Punnett Square: Step-by-Step Genetics Guide (2026)
Learn how to make a Punnett square for monohybrid and dihybrid crosses. Covers genotype and phenotype ratios, incomplete dominance, and mistakes, with examples.
How to Make a Bar Chart in Excel: Step-by-Step Guide (2026)
Learn how to create a bar chart in Excel, sort categories, adjust gap width, add labels, and choose between bar and column charts, with official references.
Best Scientific Color Palettes: Hex Codes & Examples
Compare Okabe-Ito, Viridis, Paul Tol and other scientific color palettes for research figures. Includes colorblind-safe hex codes, use cases and code snippets.